Academic Profile
Statistics
Similar Authors
Papers on arXiv
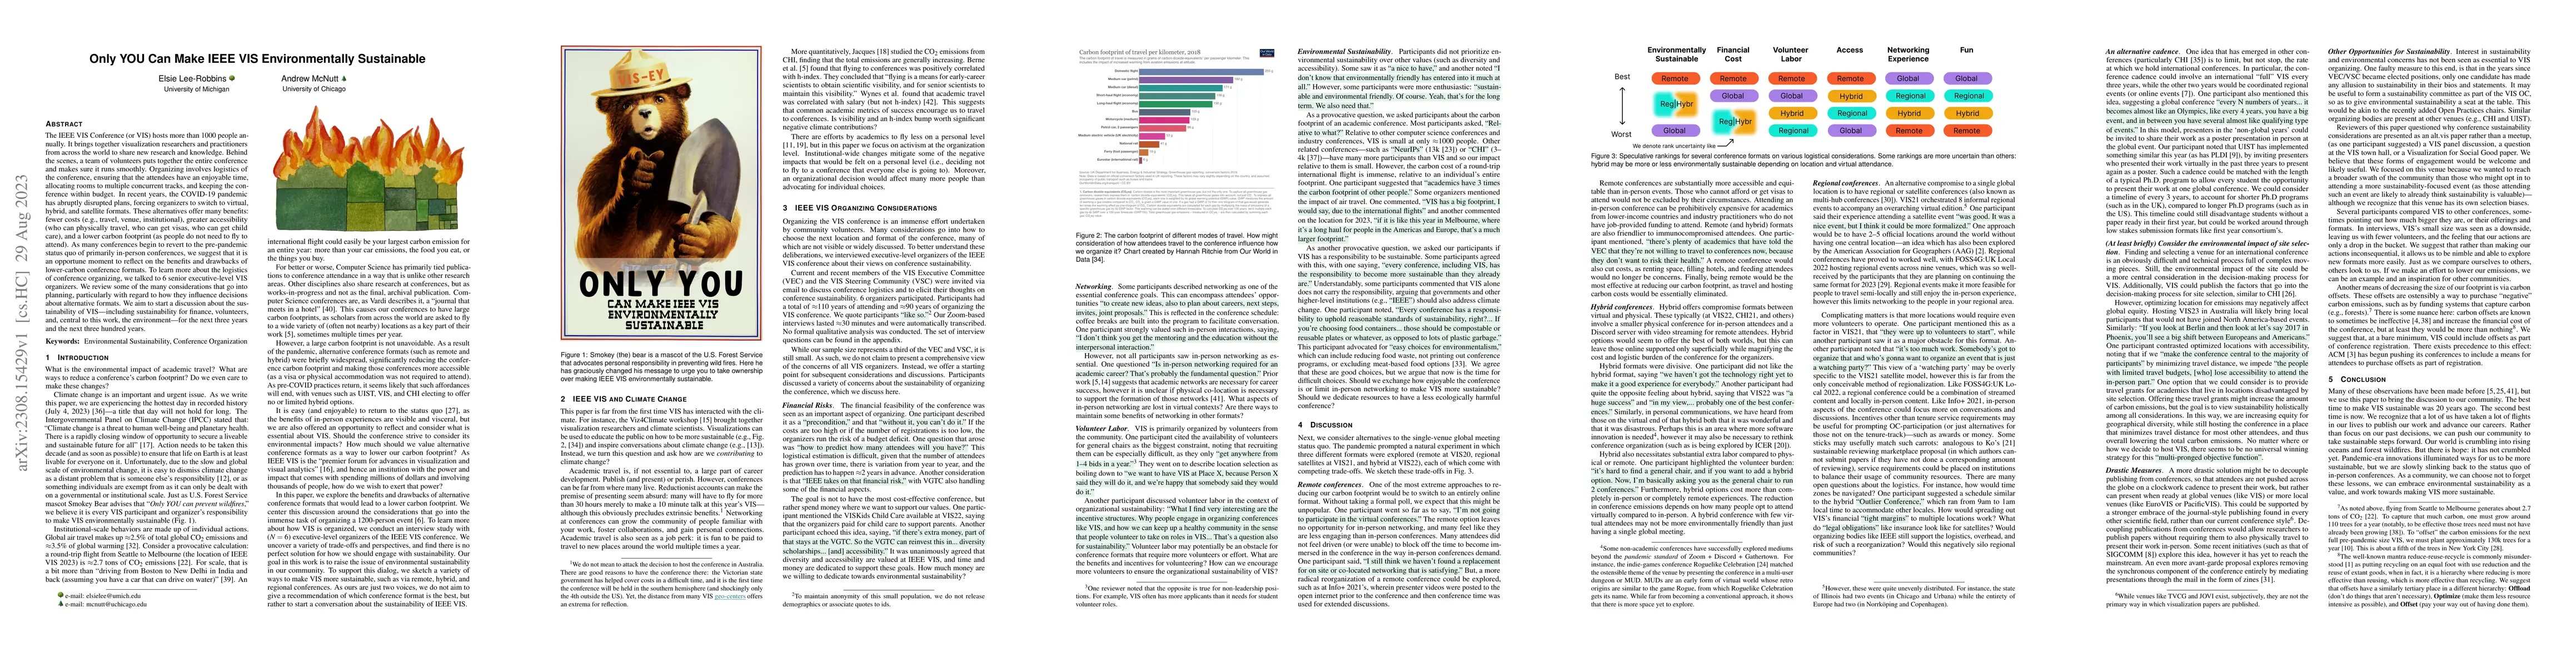
The IEEE VIS Conference (or VIS) hosts more than 1000 people annually. It brings together visualization researchers and practitioners from across the world to share new research and knowledge. Behin...
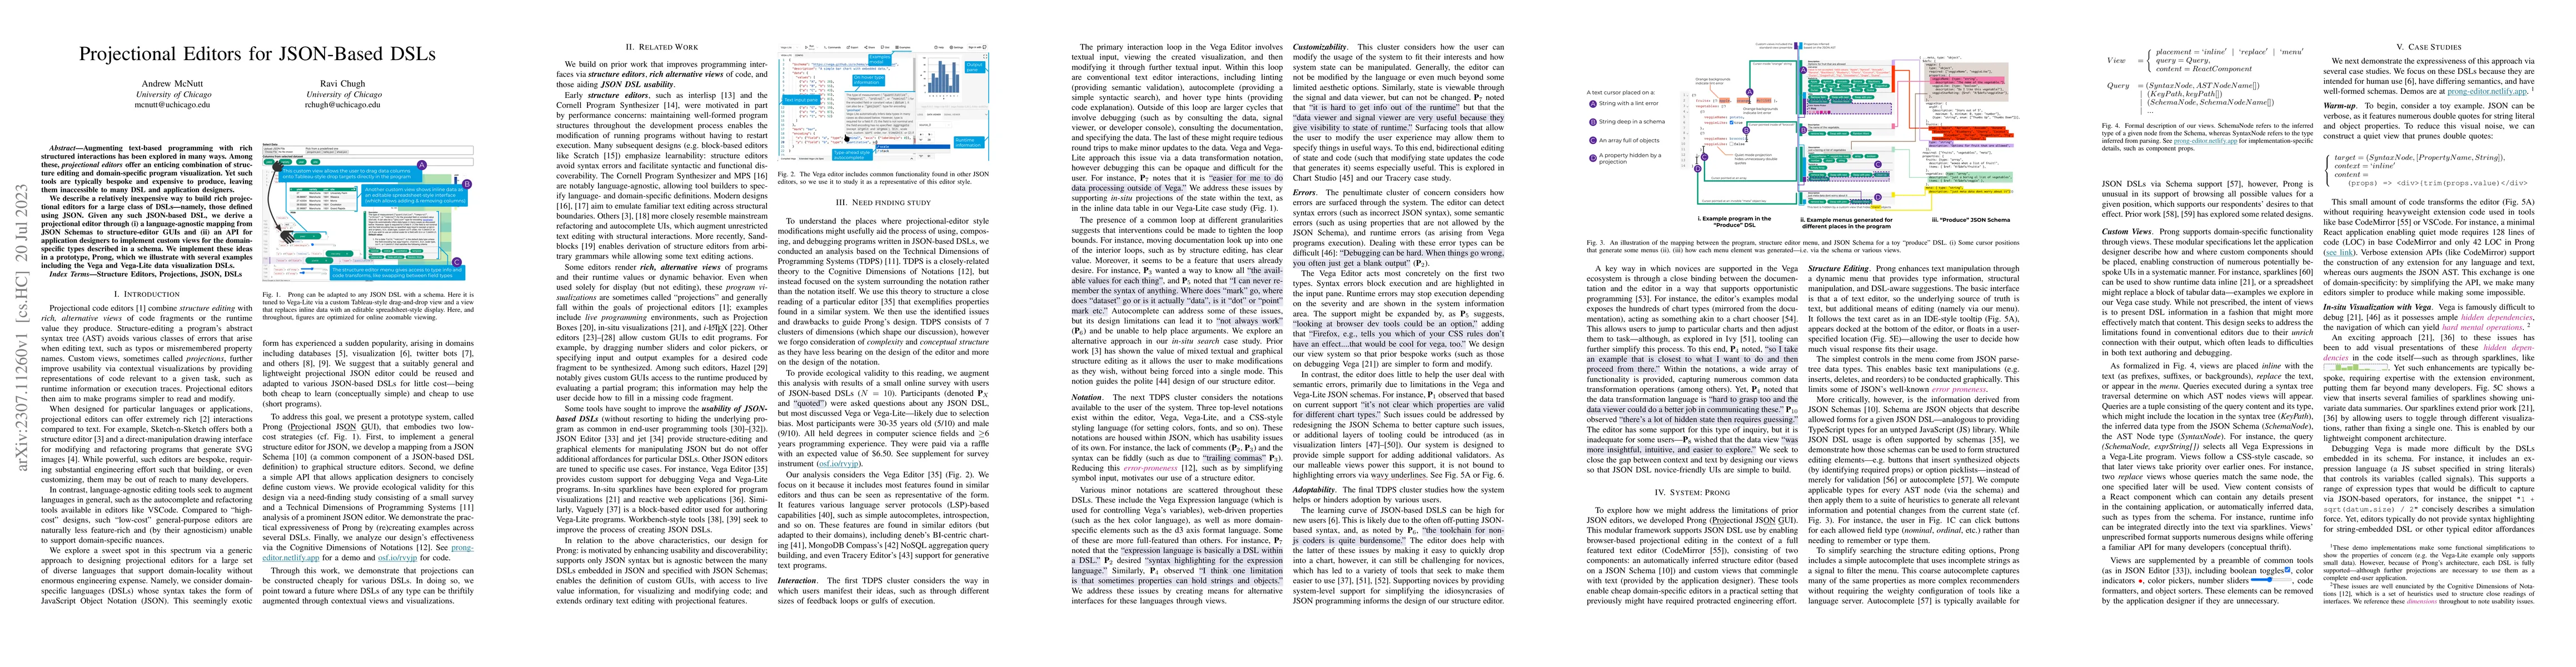
Augmenting text-based programming with rich structured interactions has been explored in many ways. Among these, projectional editors offer an enticing combination of structure editing and domain-sp...
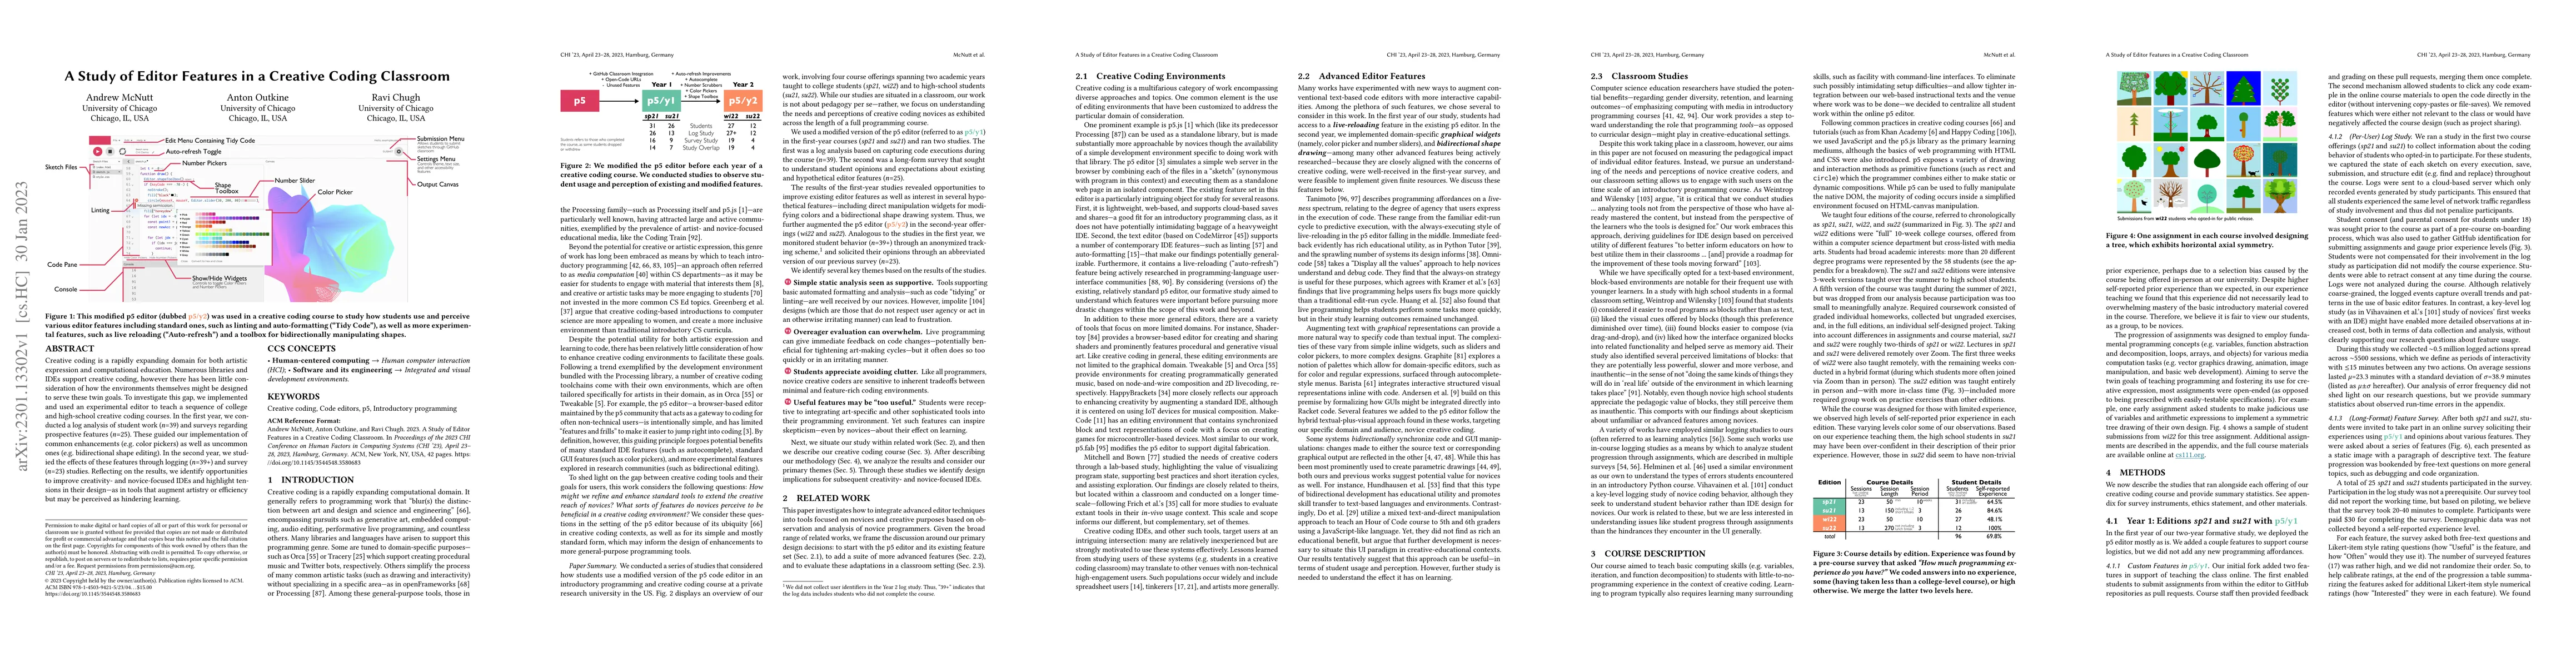
Creative coding is a rapidly expanding domain for both artistic expression and computational education. Numerous libraries and IDEs support creative coding, however there has been little considerati...
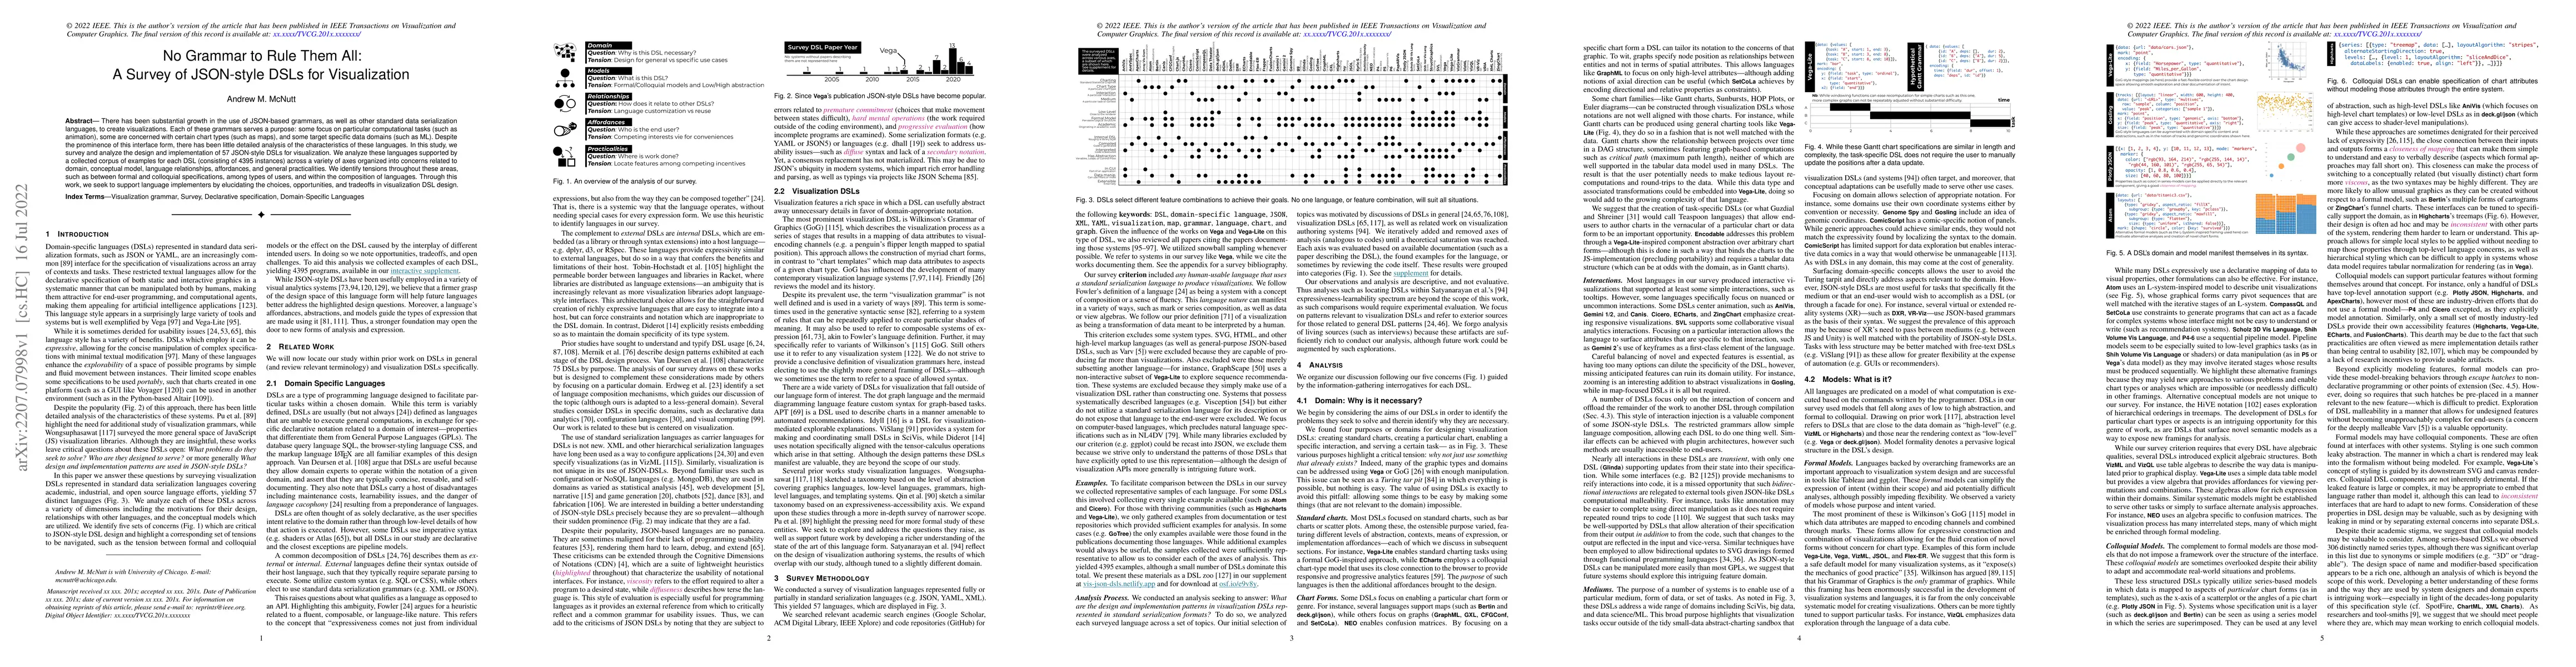
There has been substantial growth in the use of JSON-based grammars, as well as other standard data serialization languages, to create visualizations. Each of these grammars serves a purpose: some f...
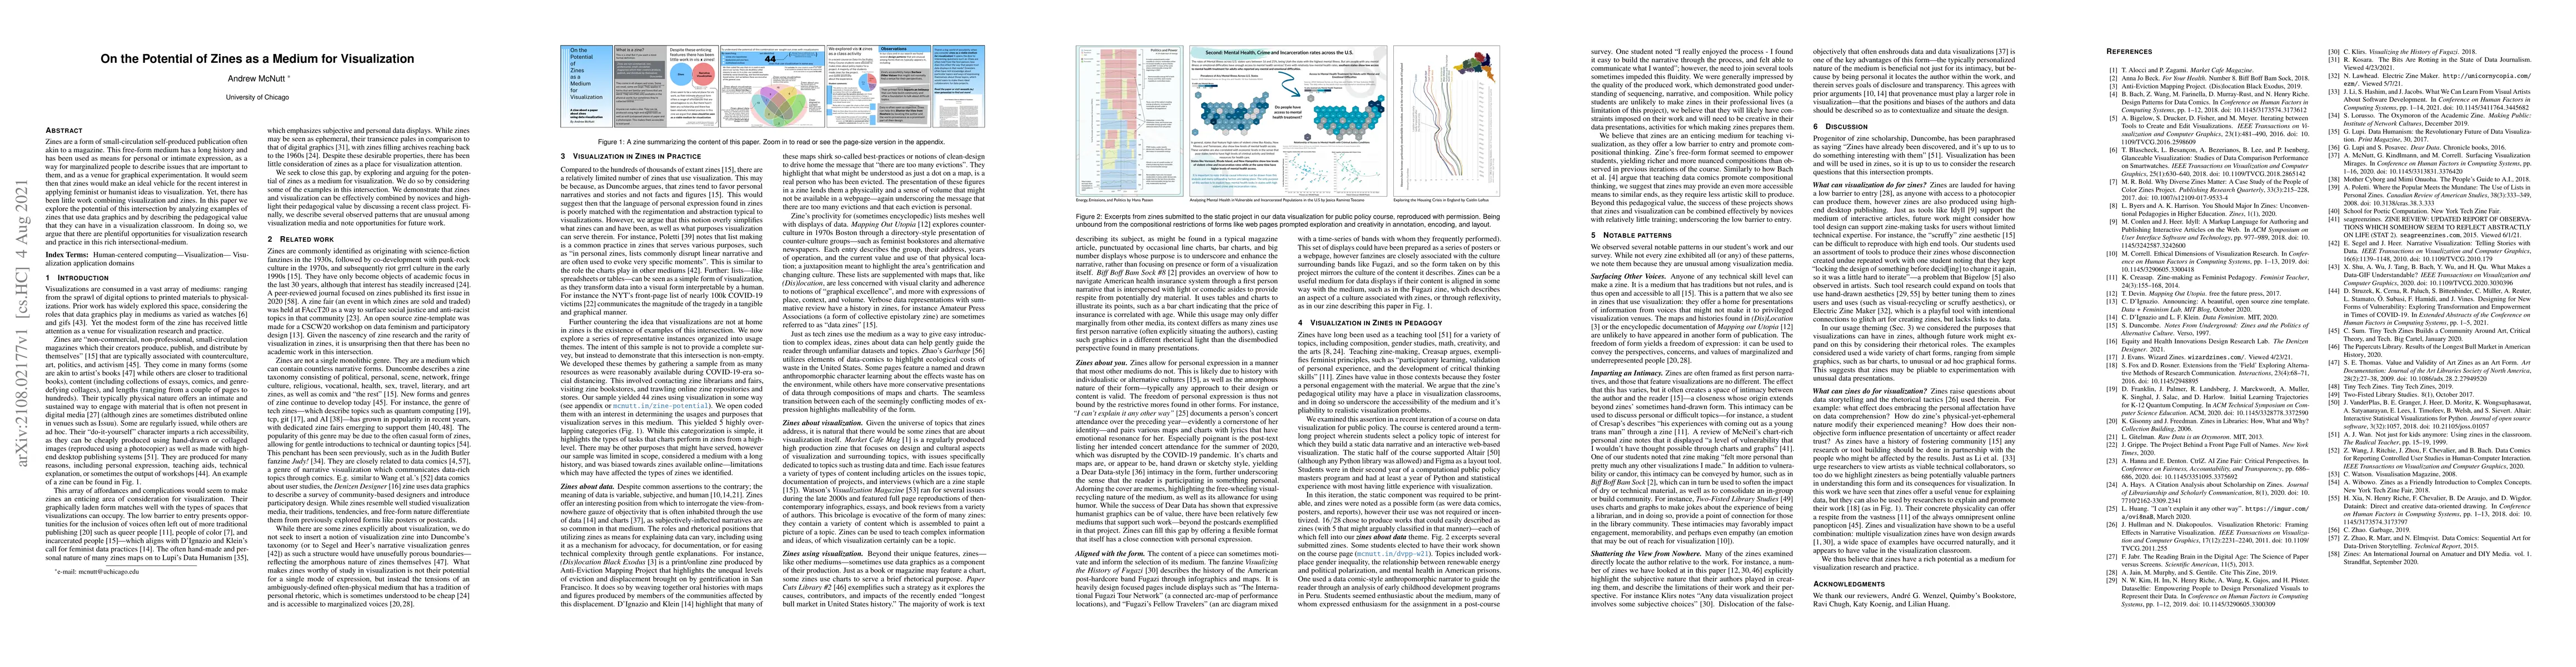
Zines are a form of small-circulation self-produced publication often akin to a magazine. This free-form medium has a long history and has been used as means for personal or intimate expression, as ...
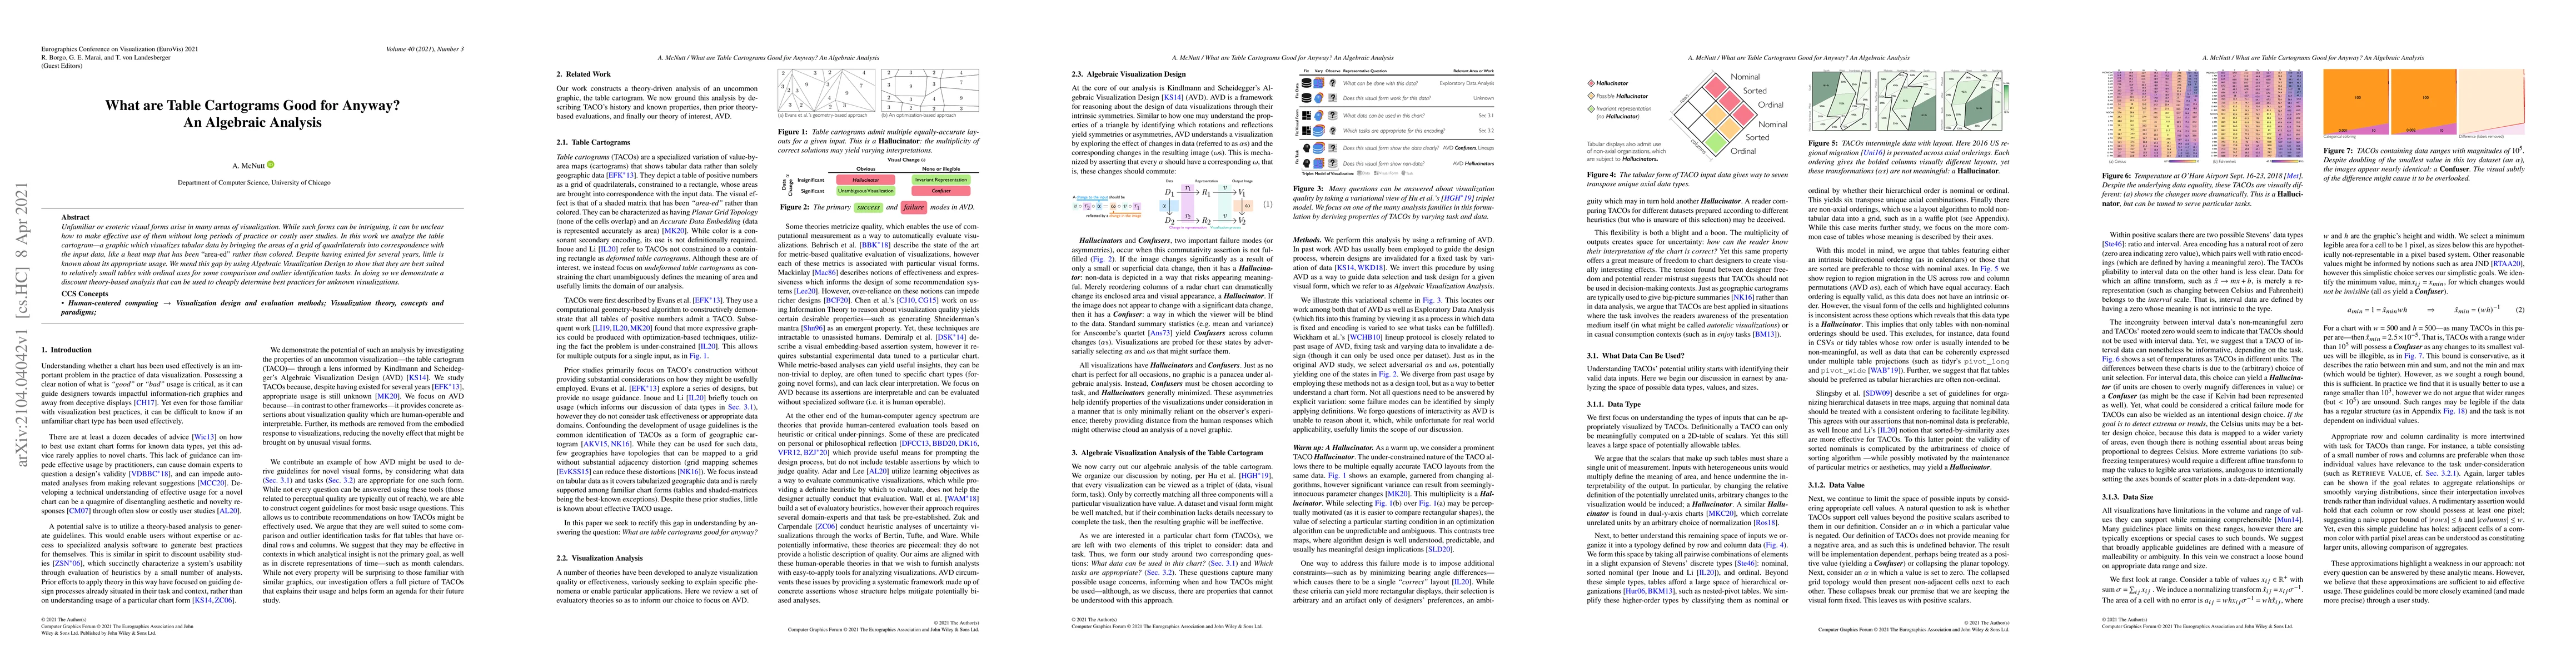
Unfamiliar or esoteric visual forms arise in many areas of visualization. While such forms can be intriguing, it can be unclear how to make effective use of them without long periods of practice or ...
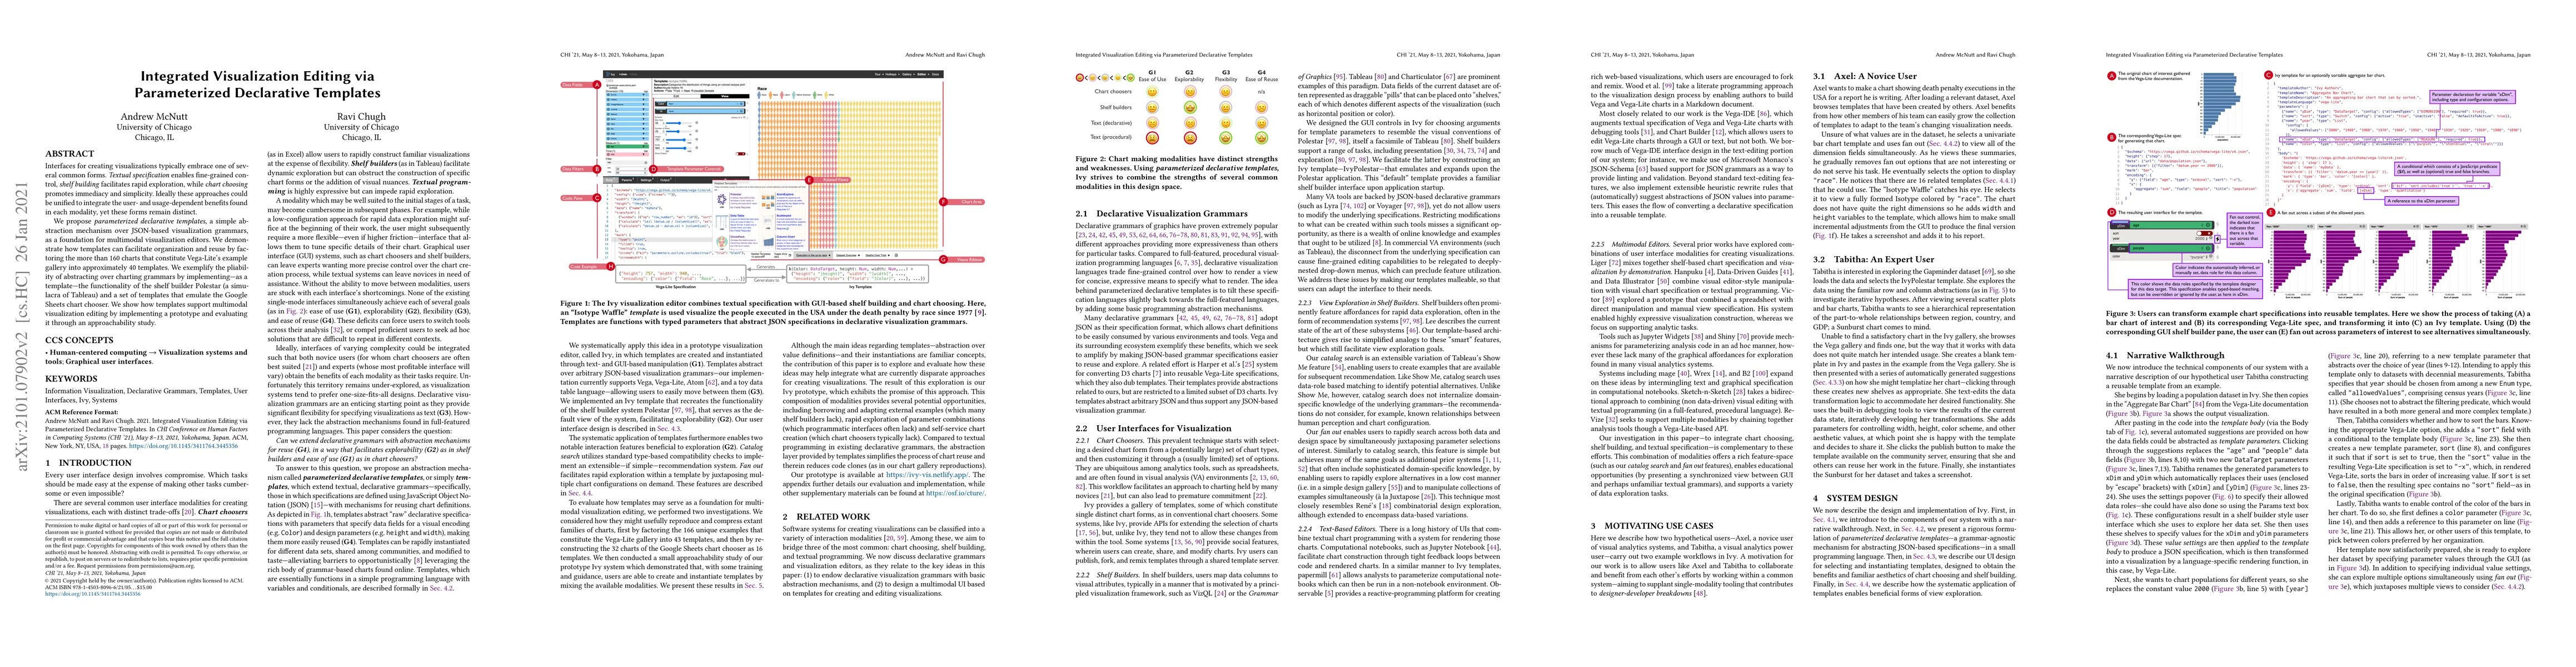
Interfaces for creating visualizations typically embrace one of several common forms. Textual specification enables fine-grained control, shelf building facilitates rapid exploration, while chart ch...
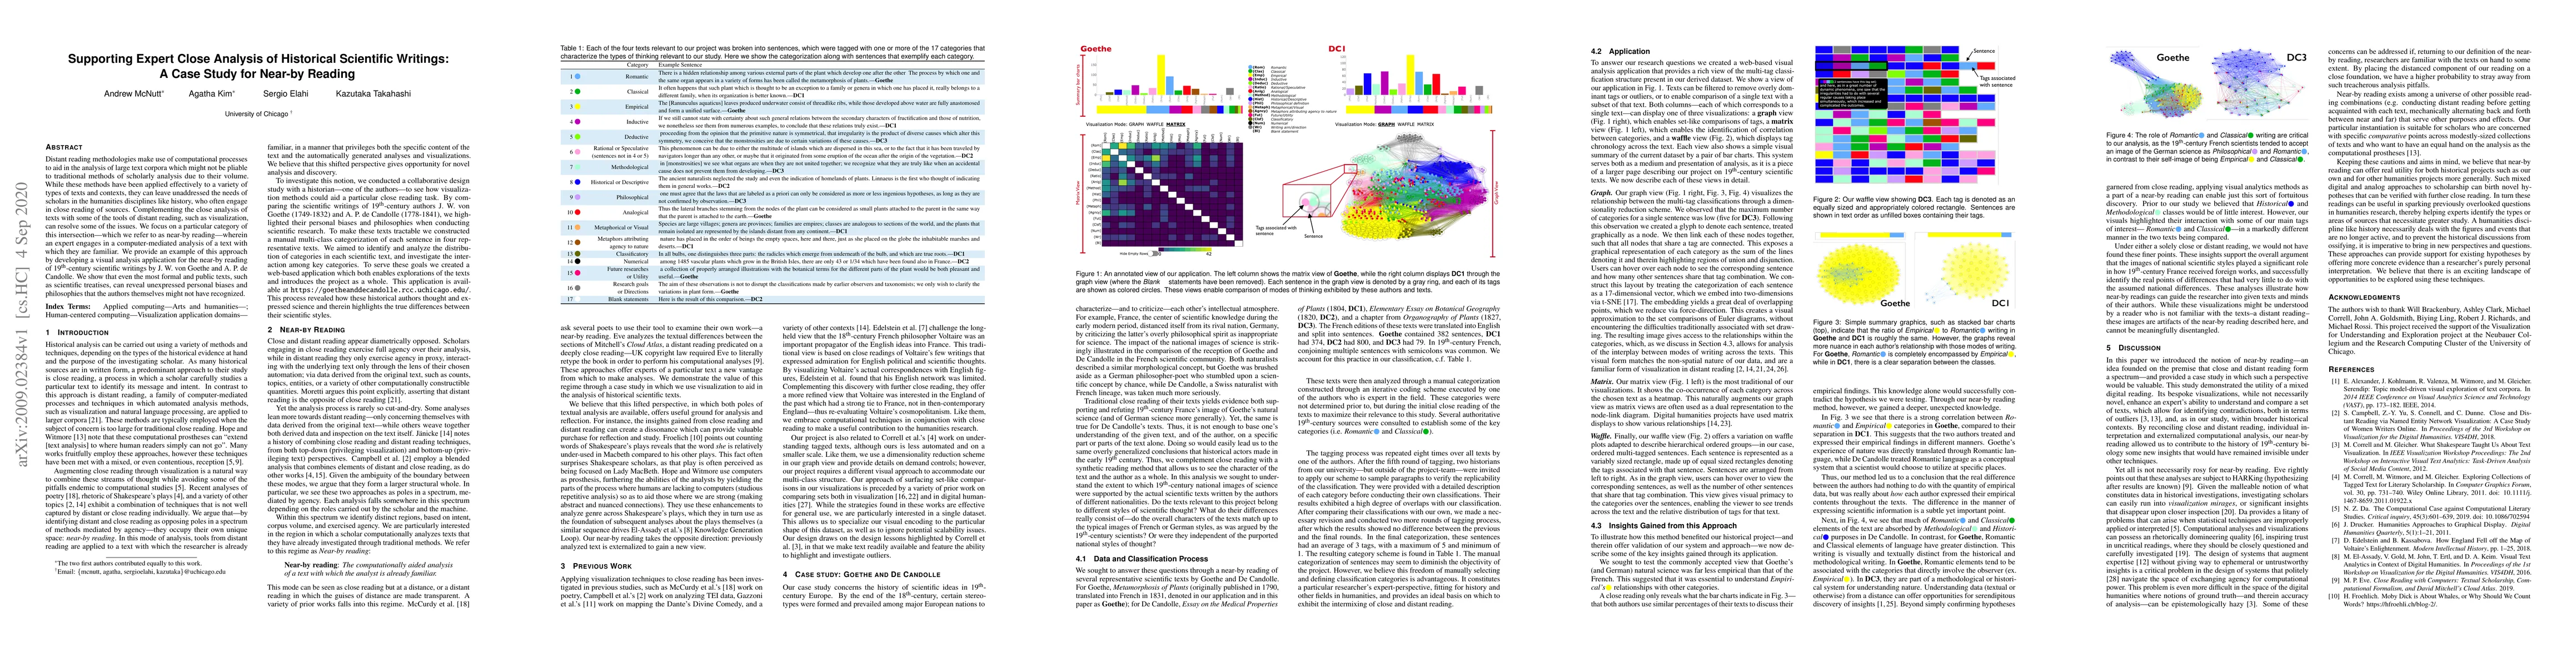
Distant reading methodologies make use of computational processes to aid in the analysis of large text corpora which might not be pliable to traditional methods of scholarly analysis due to their vo...
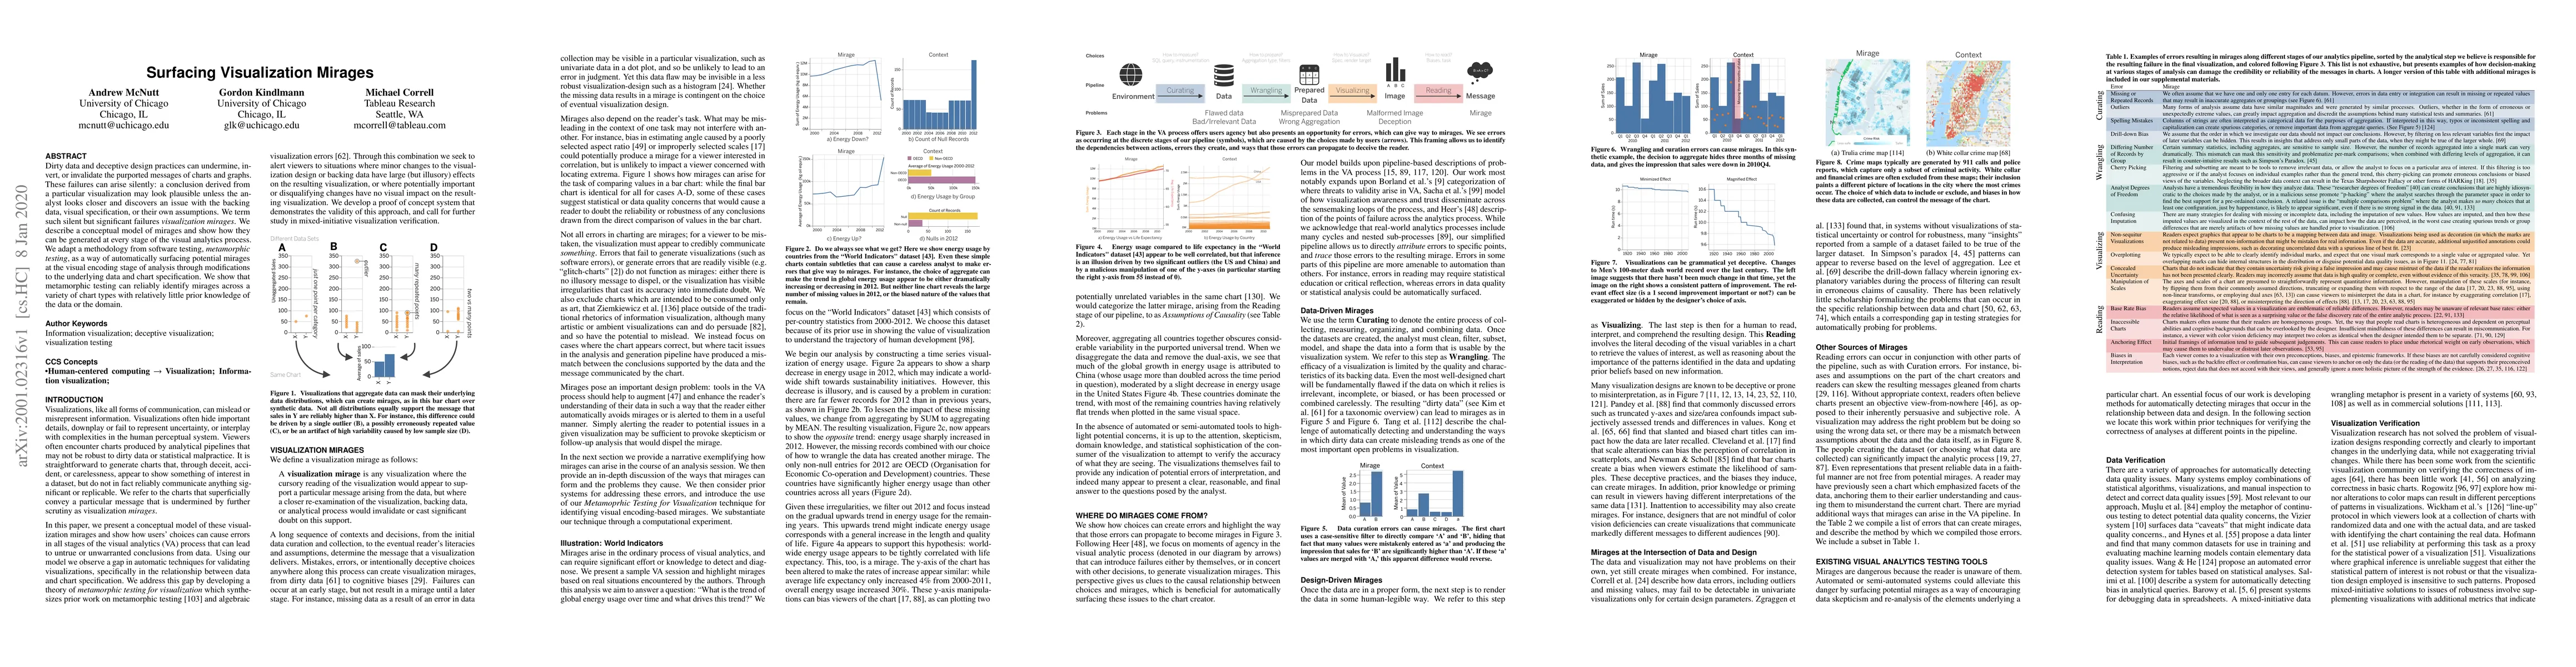
Dirty data and deceptive design practices can undermine, invert, or invalidate the purported messages of charts and graphs. These failures can arise silently: a conclusion derived from a particular ...
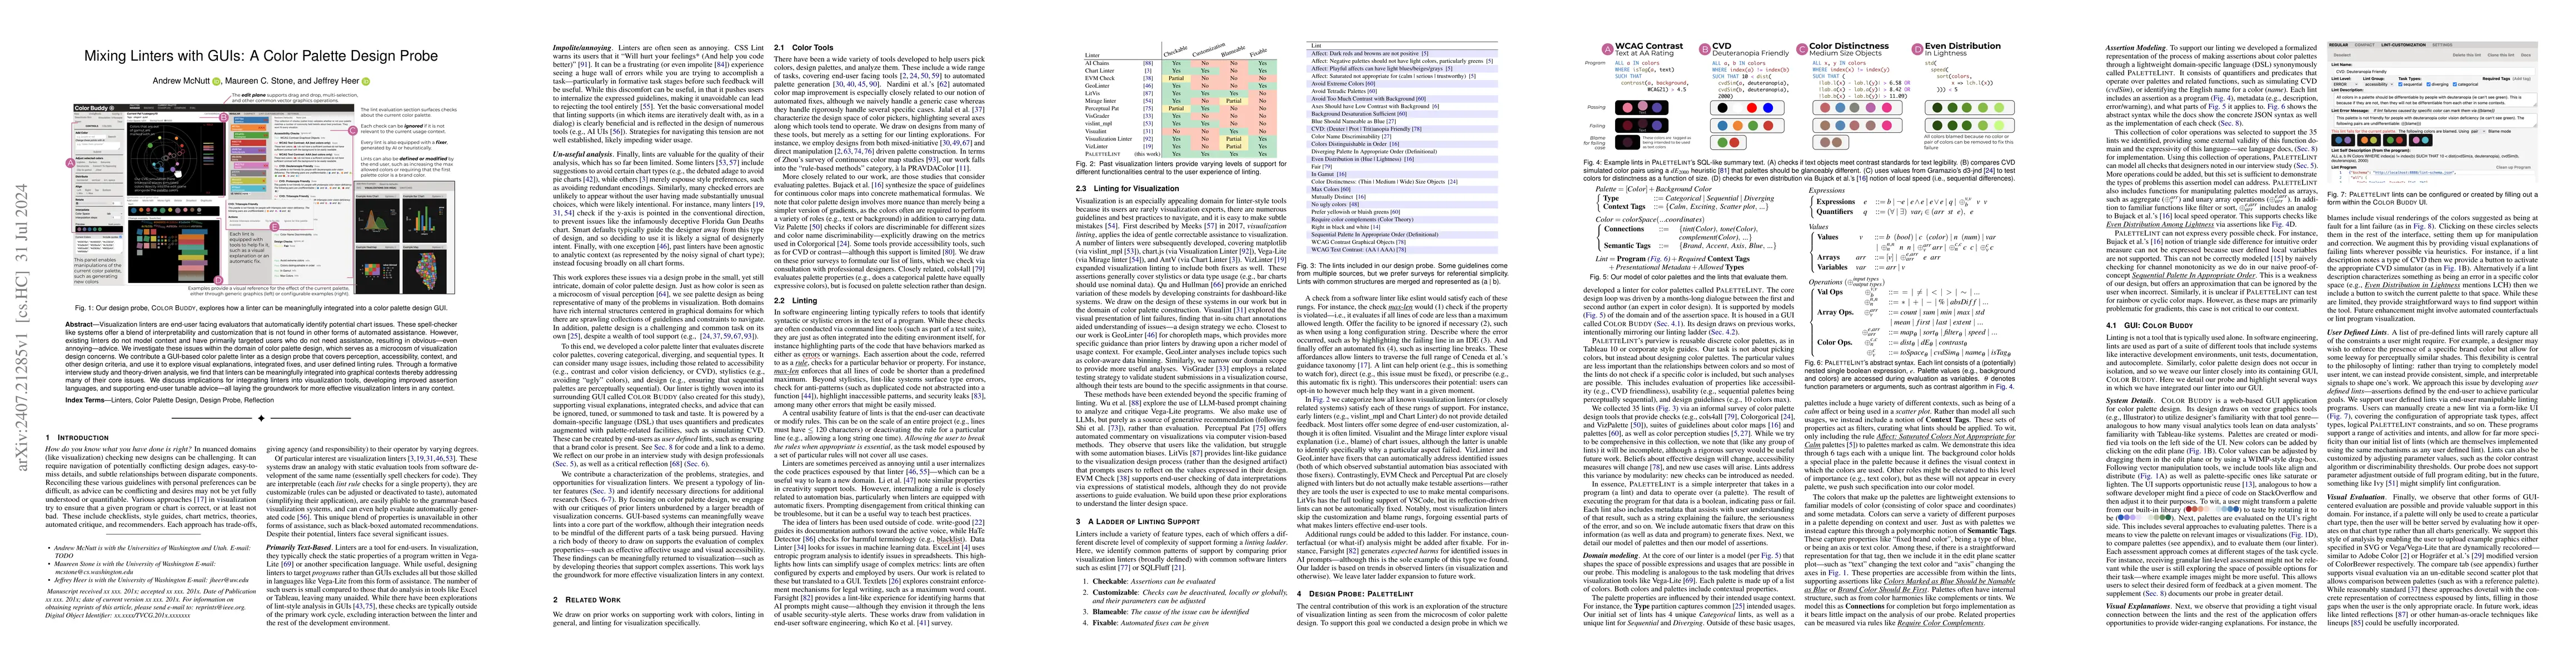
Visualization linters are end-user facing evaluators that automatically identify potential chart issues. These spell-checker like systems offer a blend of interpretability and customization that is no...
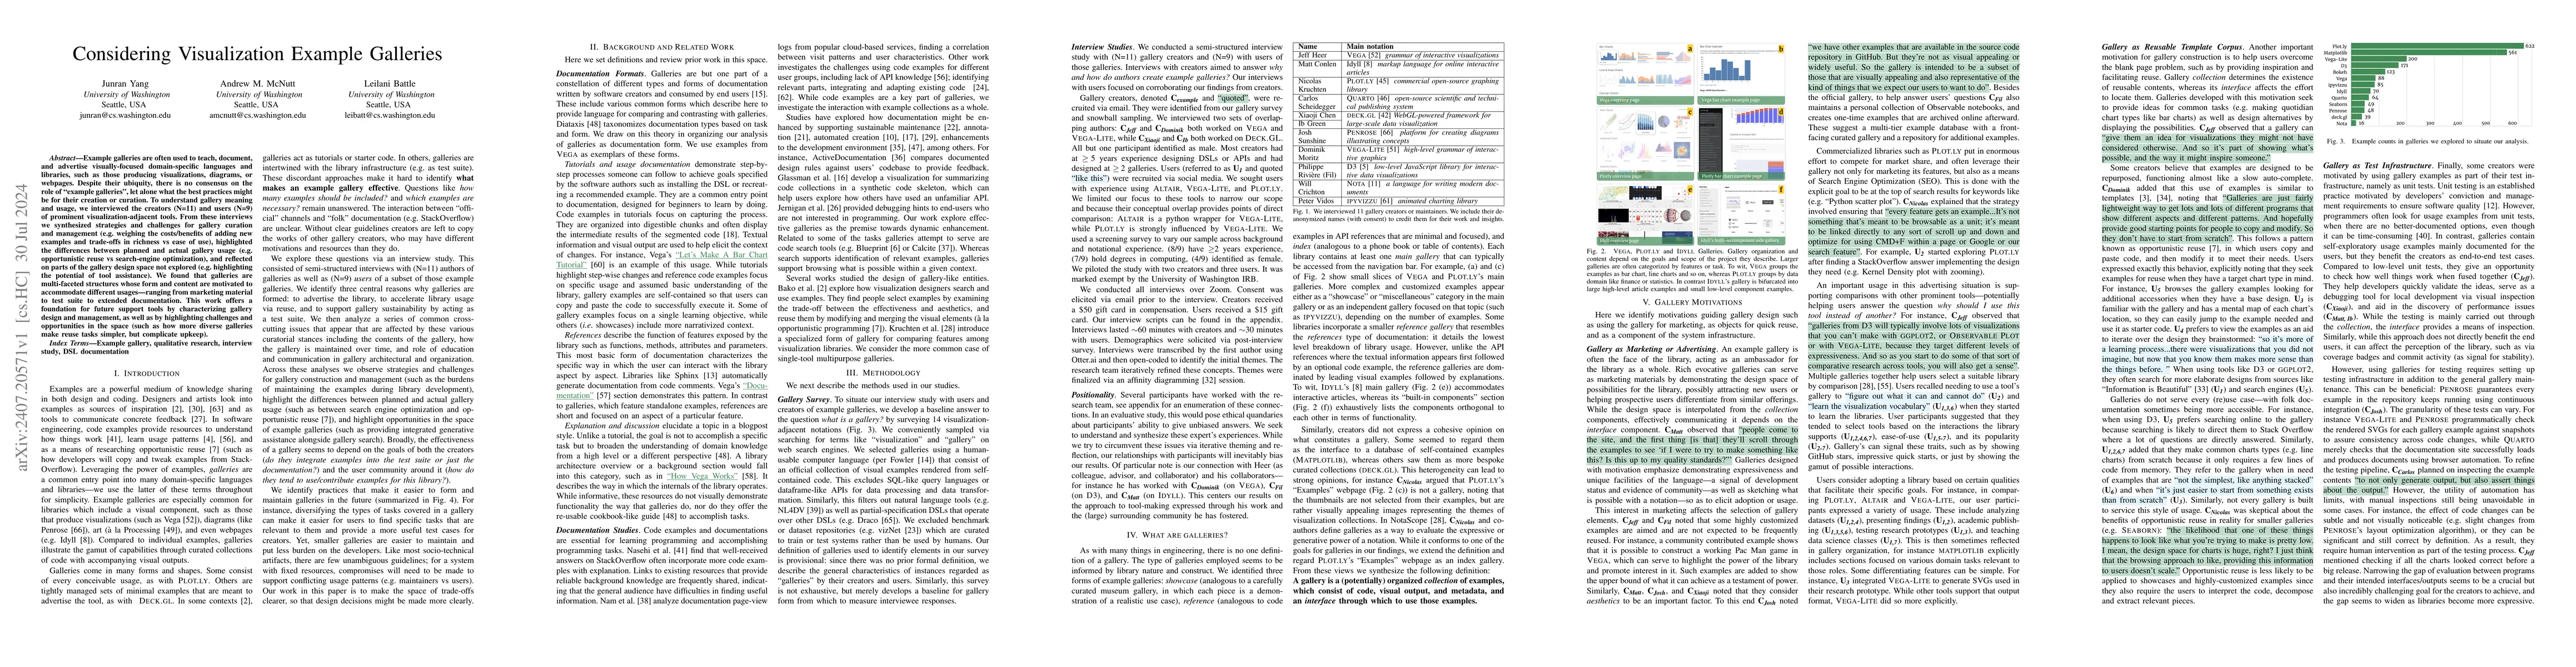
Example galleries are often used to teach, document, and advertise visually-focused domain-specific languages and libraries, such as those producing visualizations, diagrams, or webpages. Despite thei...
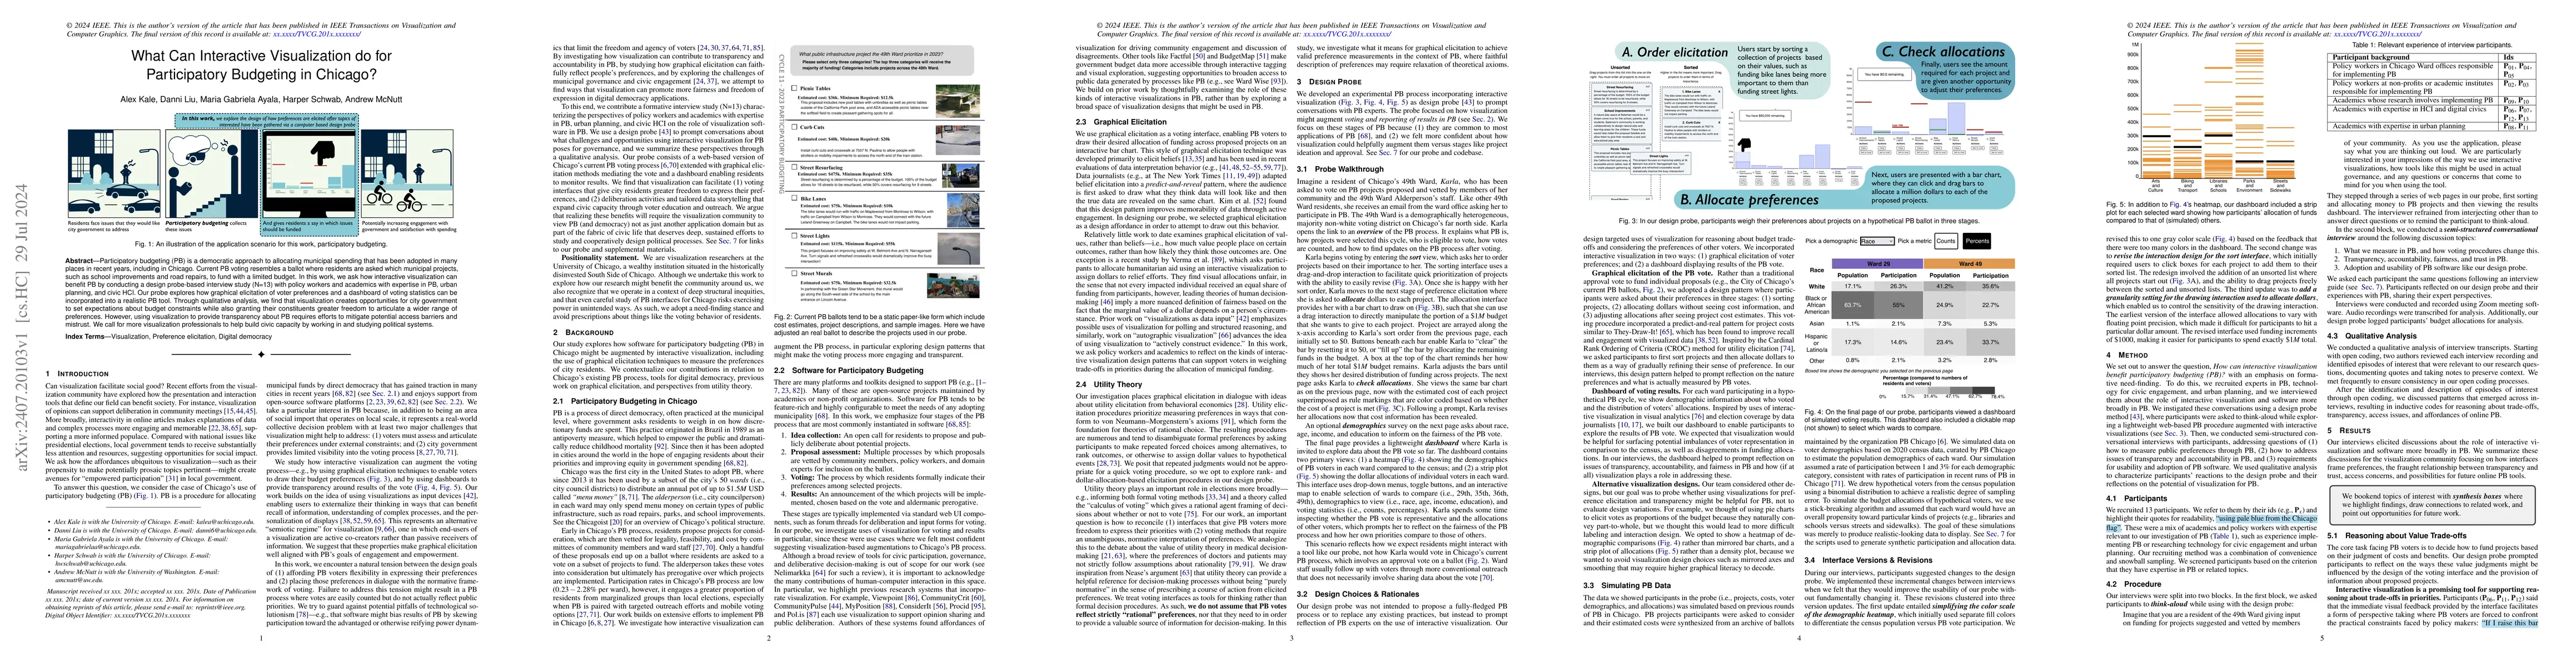
Participatory budgeting (PB) is a democratic approach to allocating municipal spending that has been adopted in many places in recent years, including in Chicago. Current PB voting resembles a ballot ...
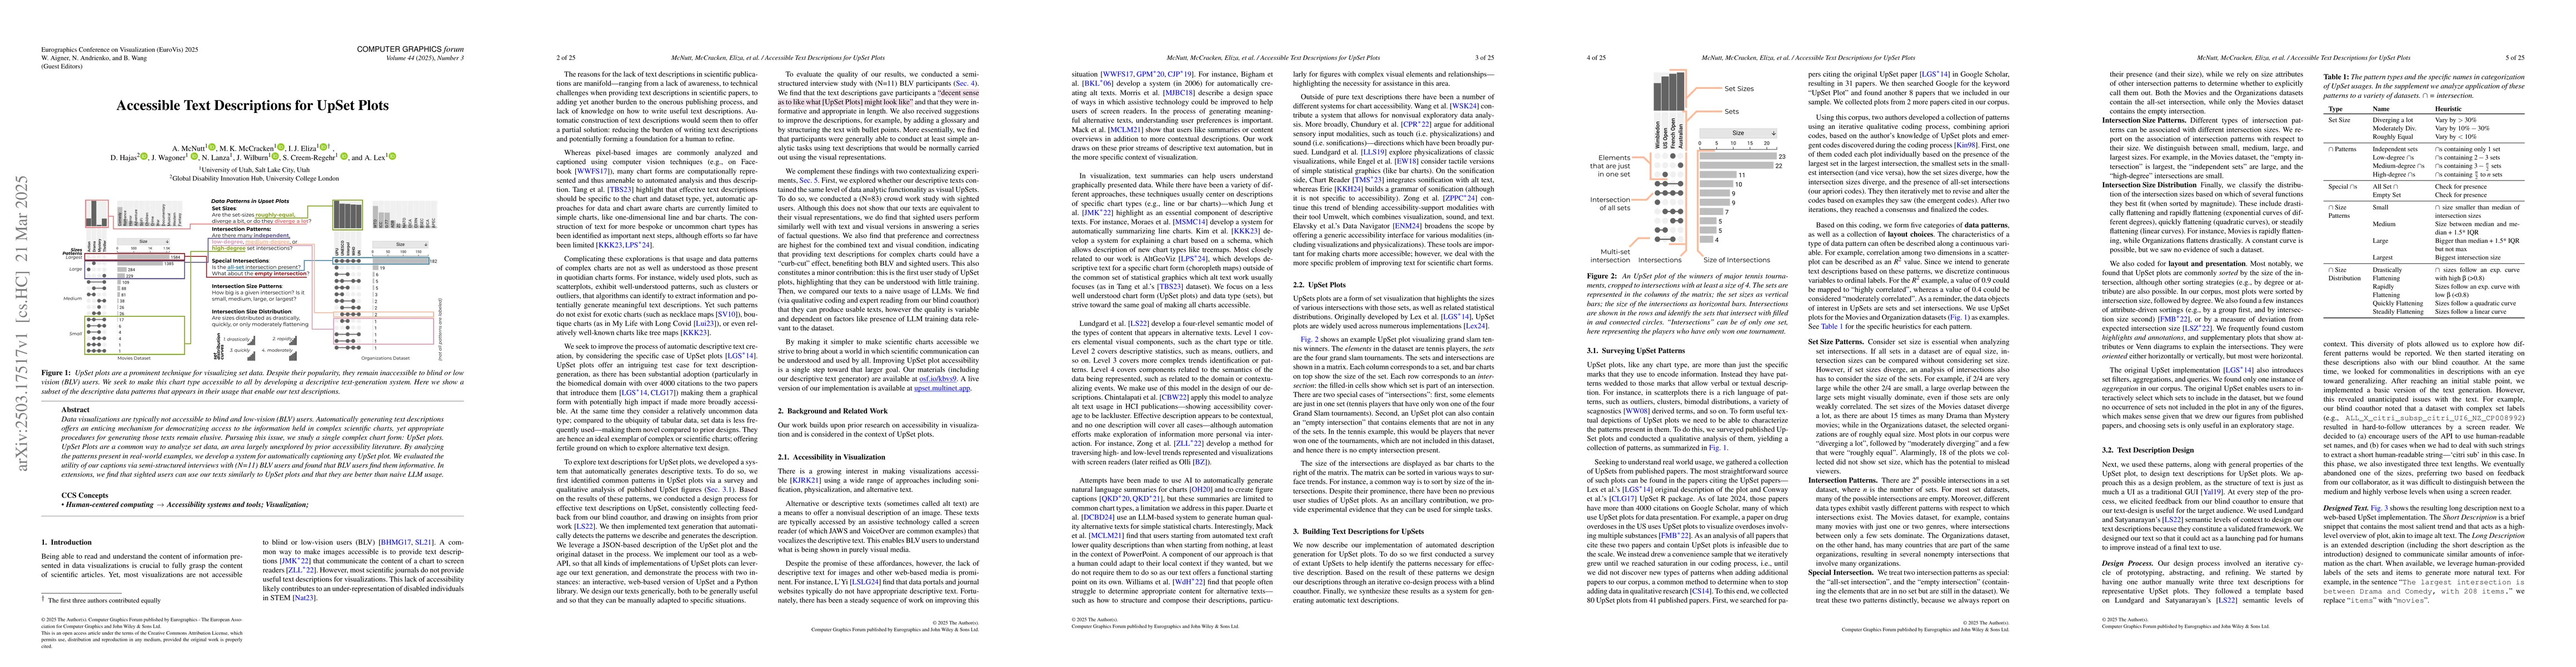
Data visualizations are typically not accessible to blind and low-vision (BLV) users. Automatically generating text descriptions offers an enticing mechanism for democratizing access to the informatio...
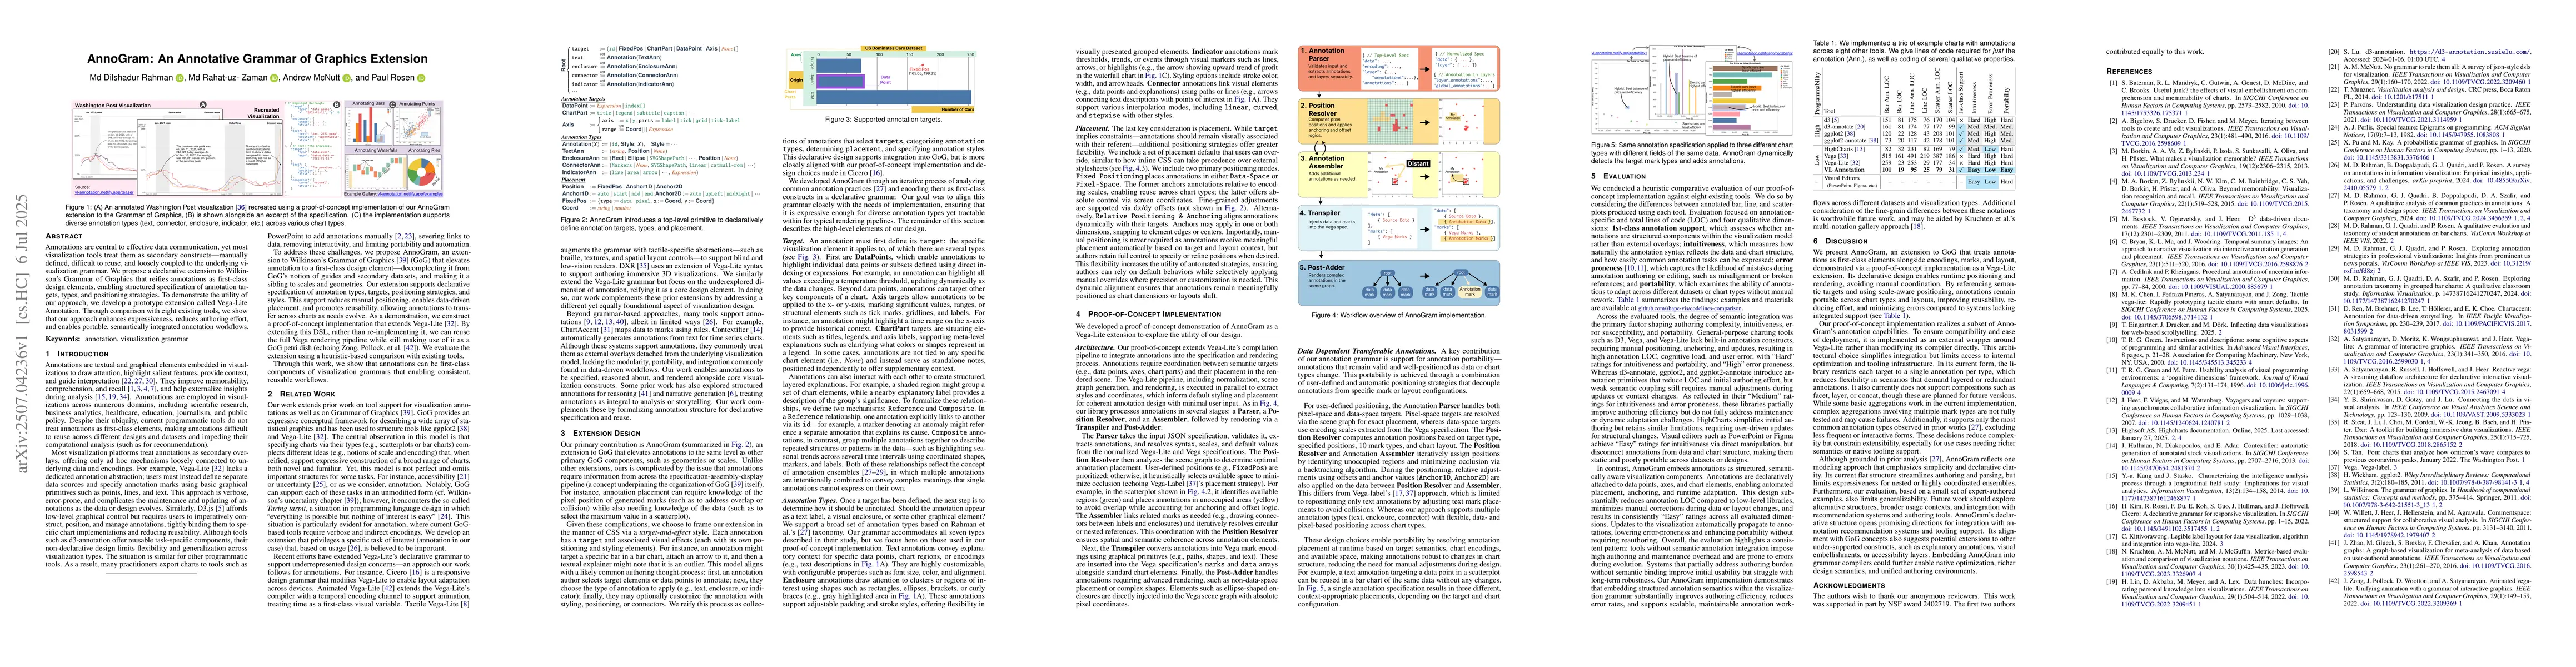
Annotations are central to effective data communication, yet most visualization tools treat them as secondary constructs -- manually defined, difficult to reuse, and loosely coupled to the underlying ...
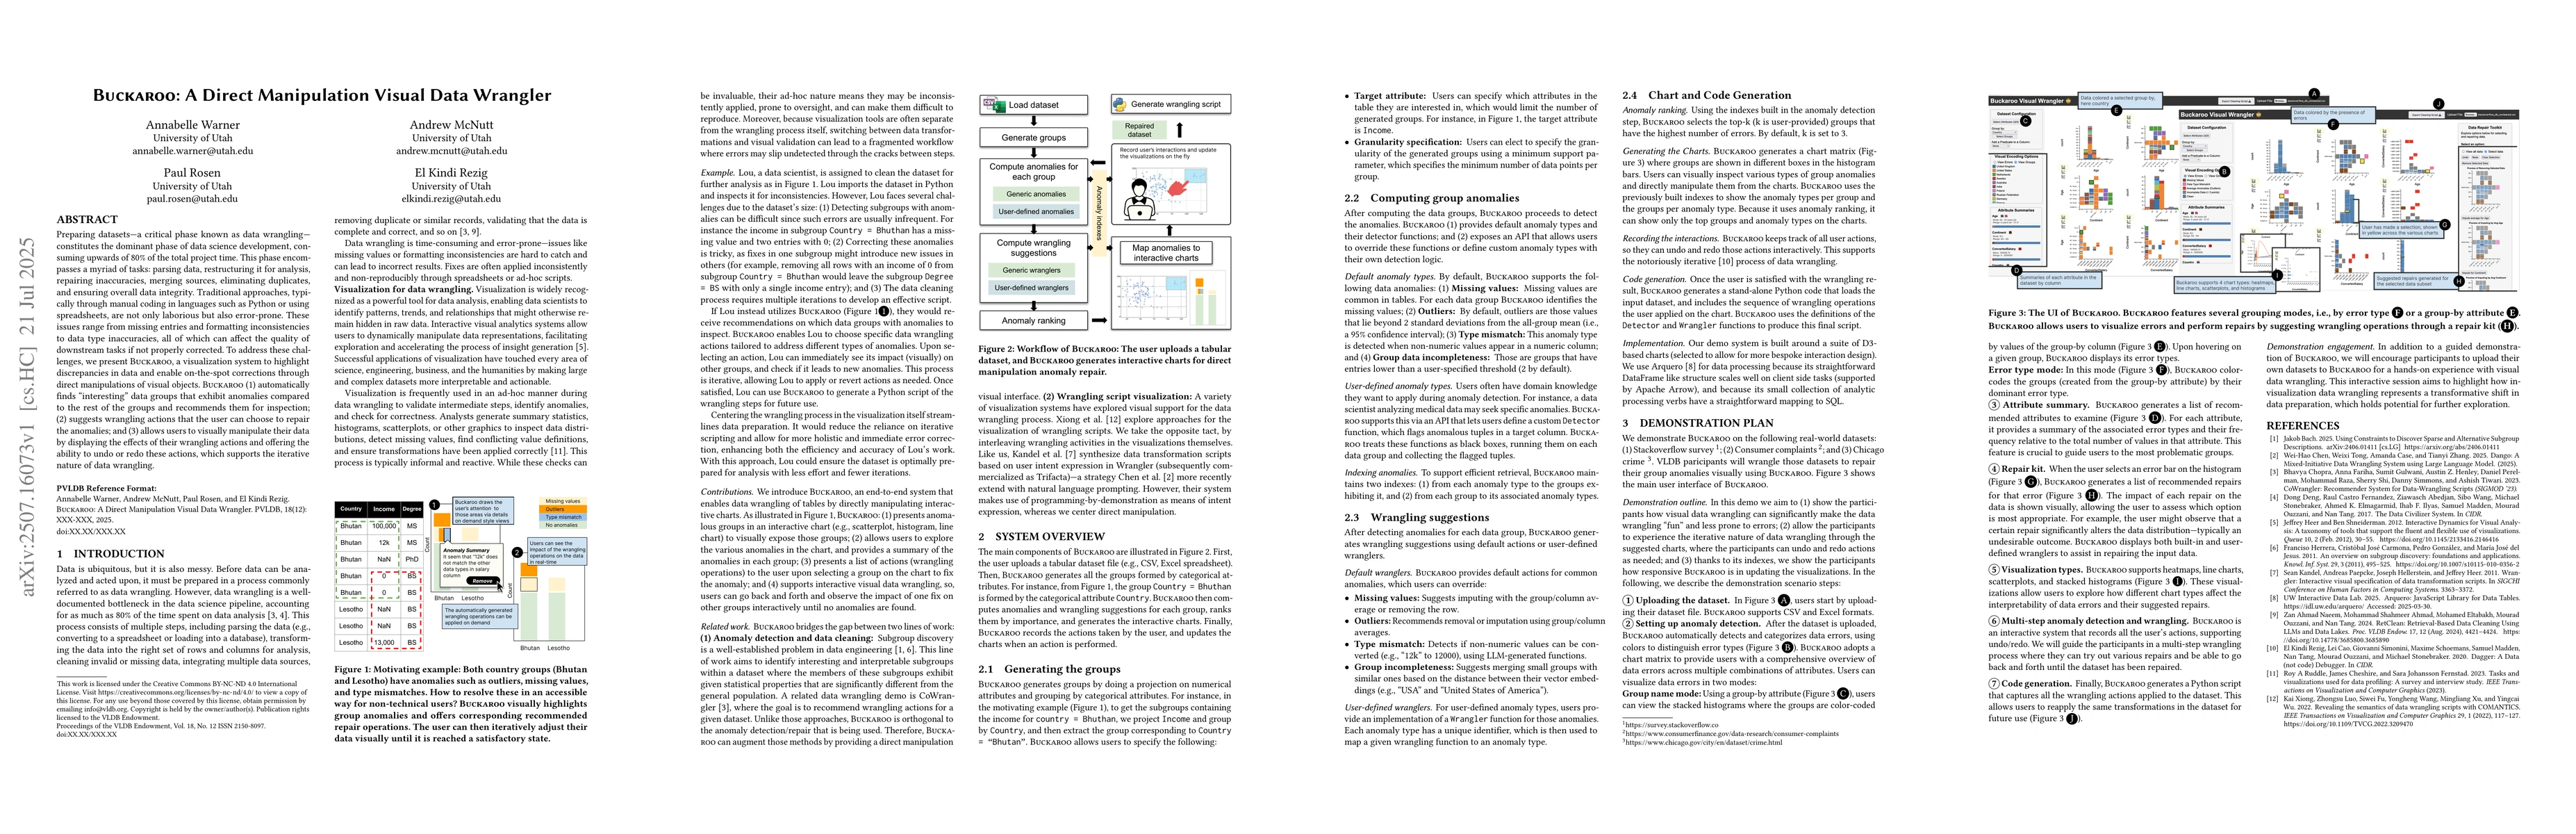
Preparing datasets -- a critical phase known as data wrangling -- constitutes the dominant phase of data science development, consuming upwards of 80% of the total project time. This phase encompasses...
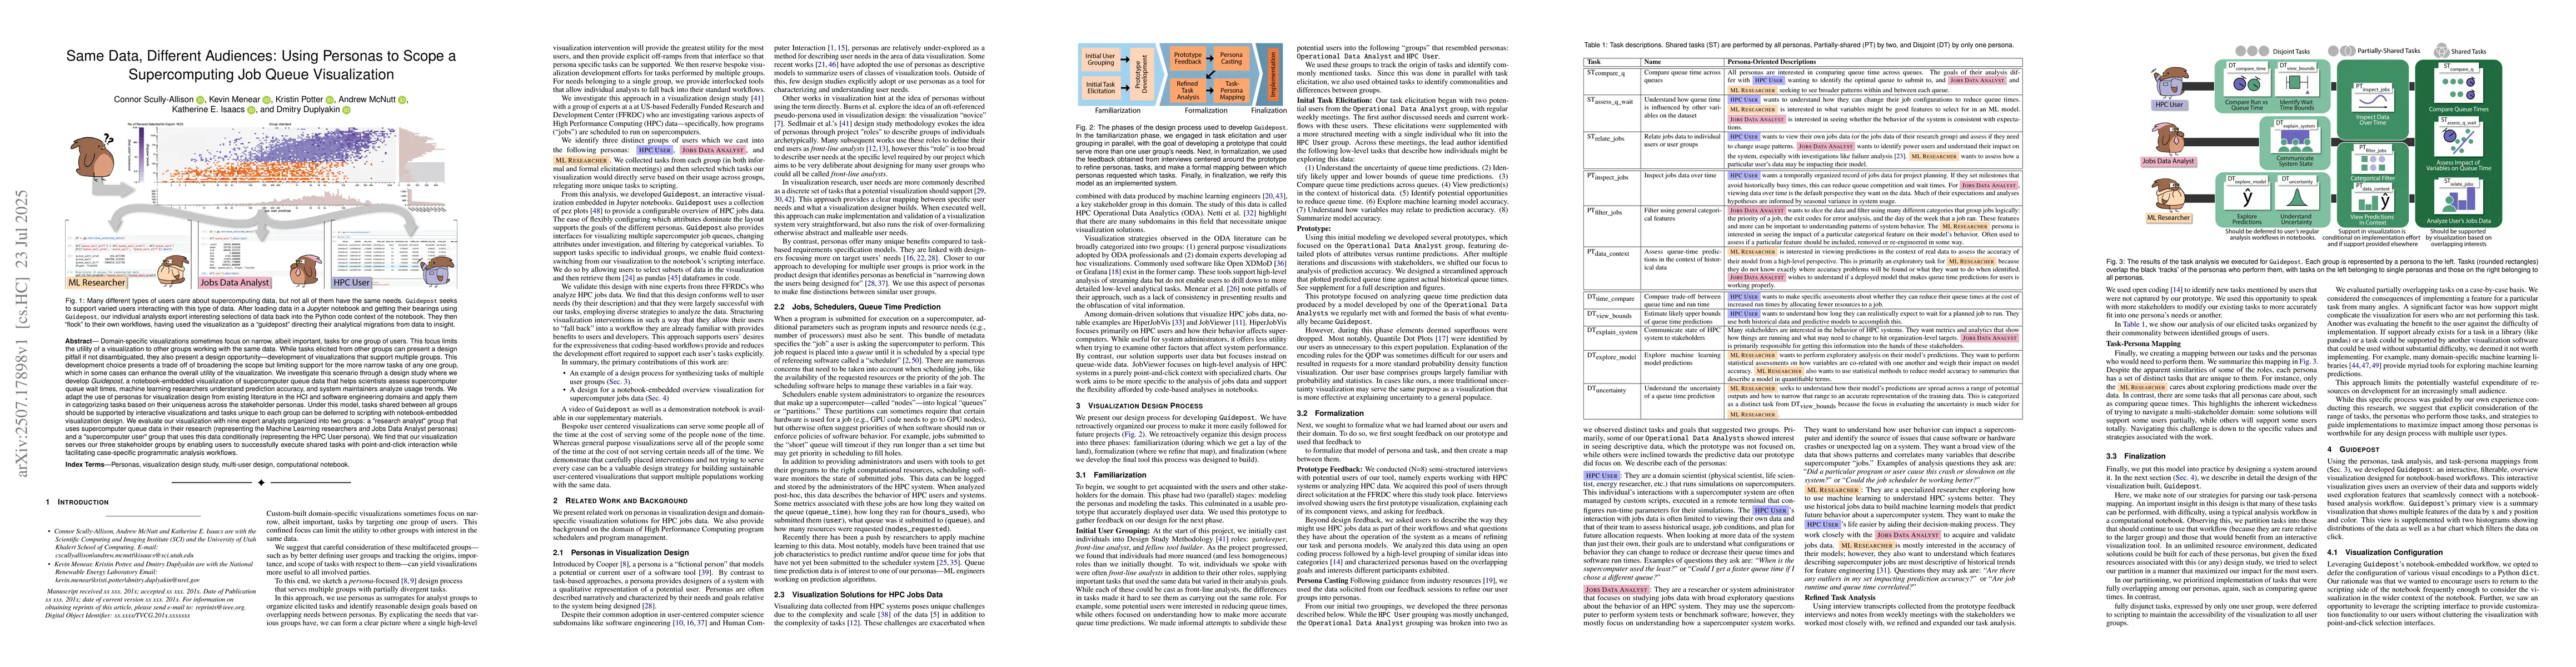
Domain-specific visualizations sometimes focus on narrow, albeit important, tasks for one group of users. This focus limits the utility of a visualization to other groups working with the same data. W...
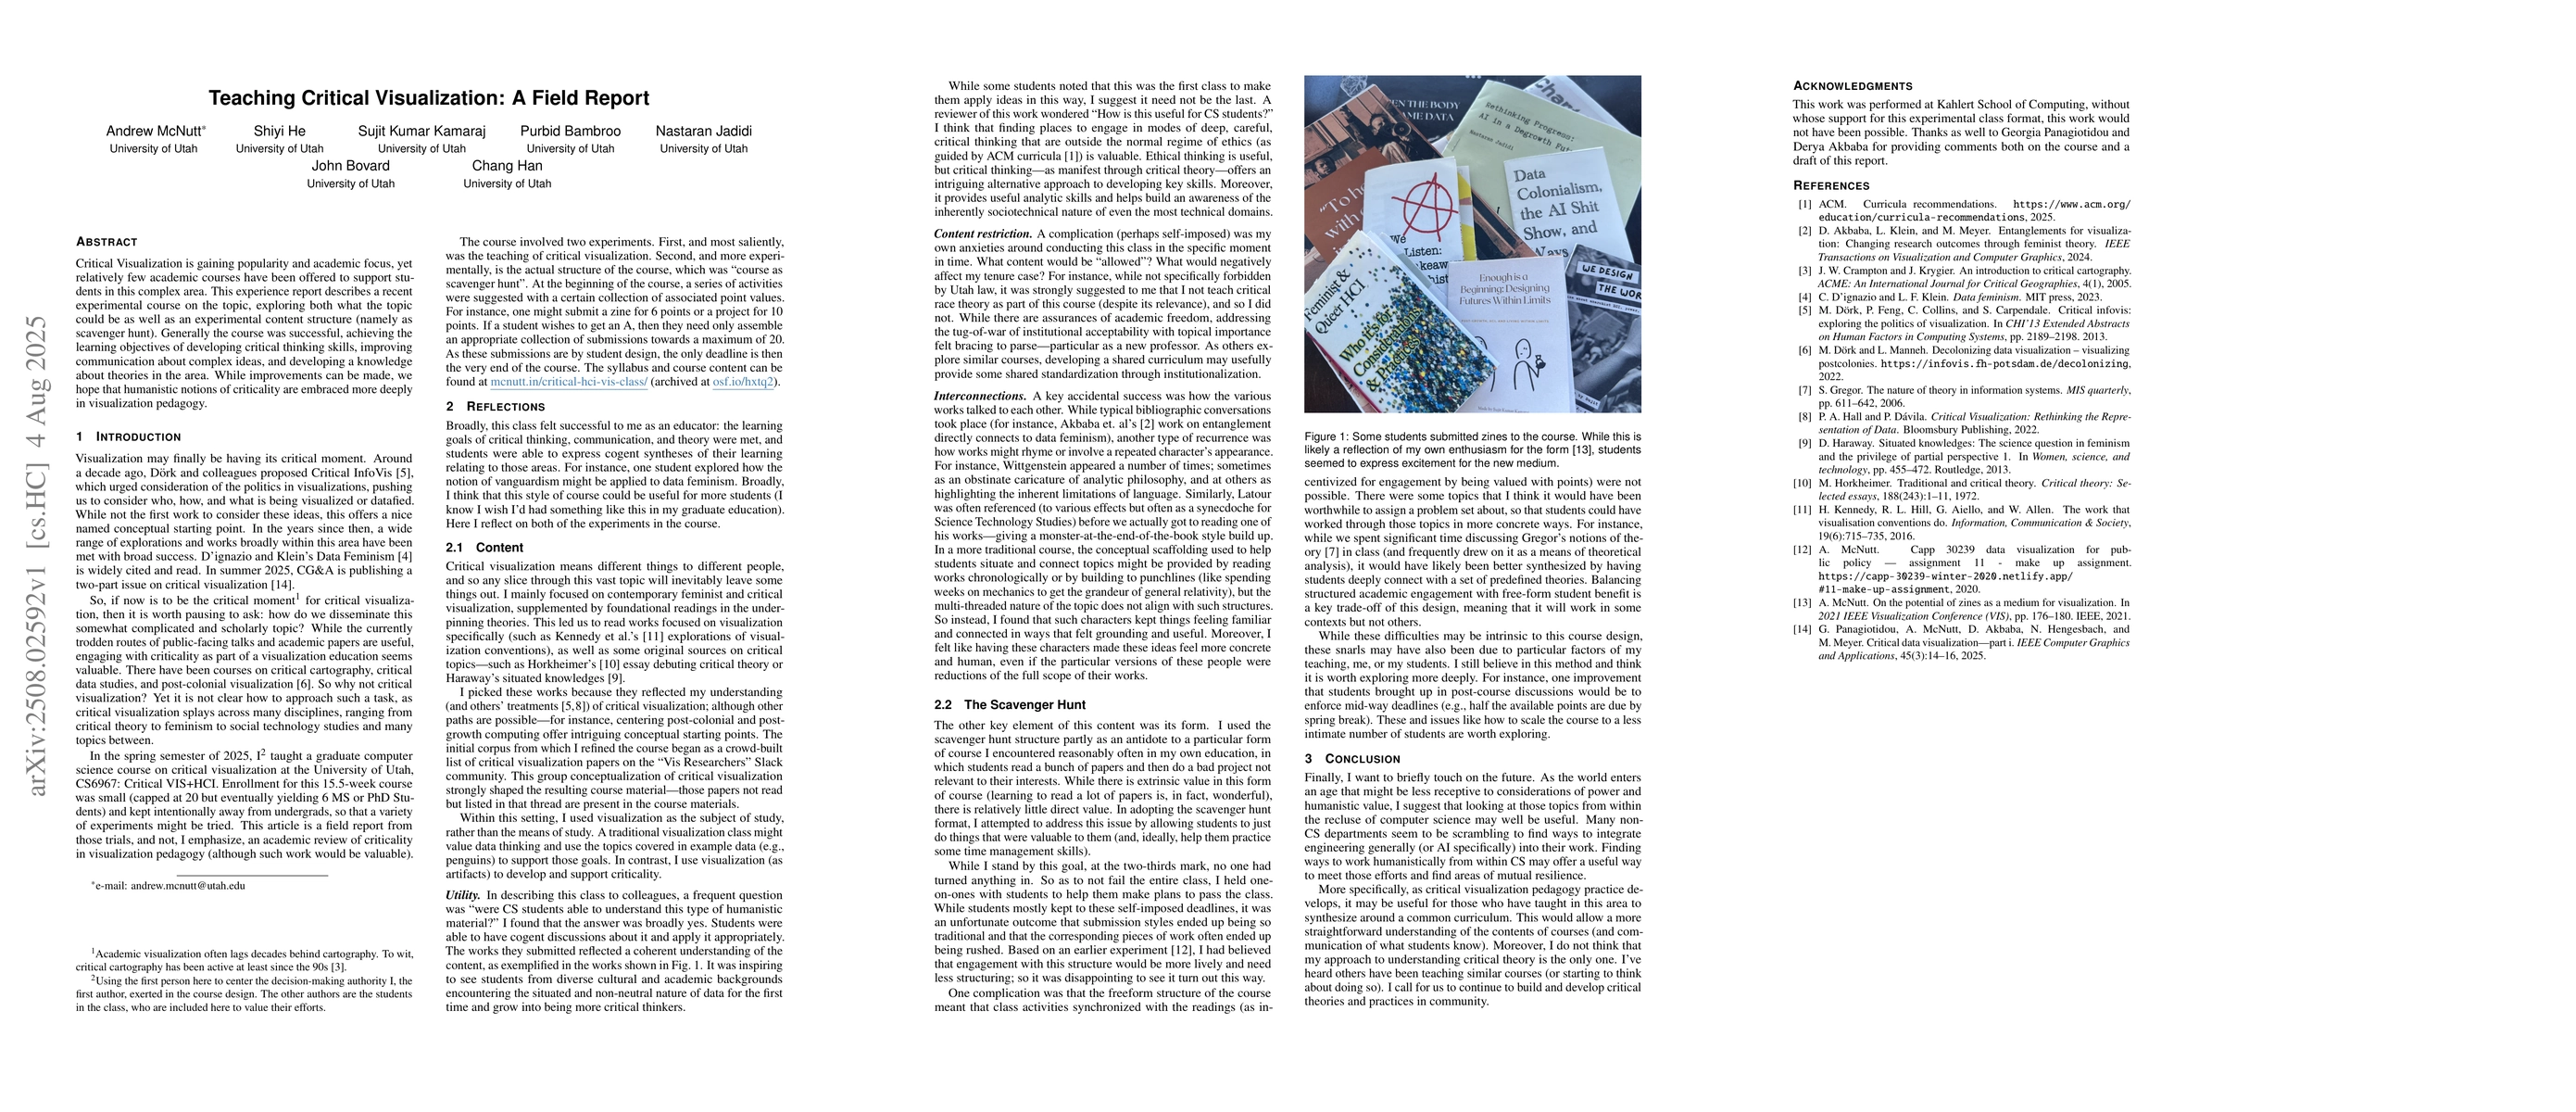
Critical Visualization is gaining popularity and academic focus, yet relatively few academic courses have been offered to support students in this complex area. This experience report describes a rece...
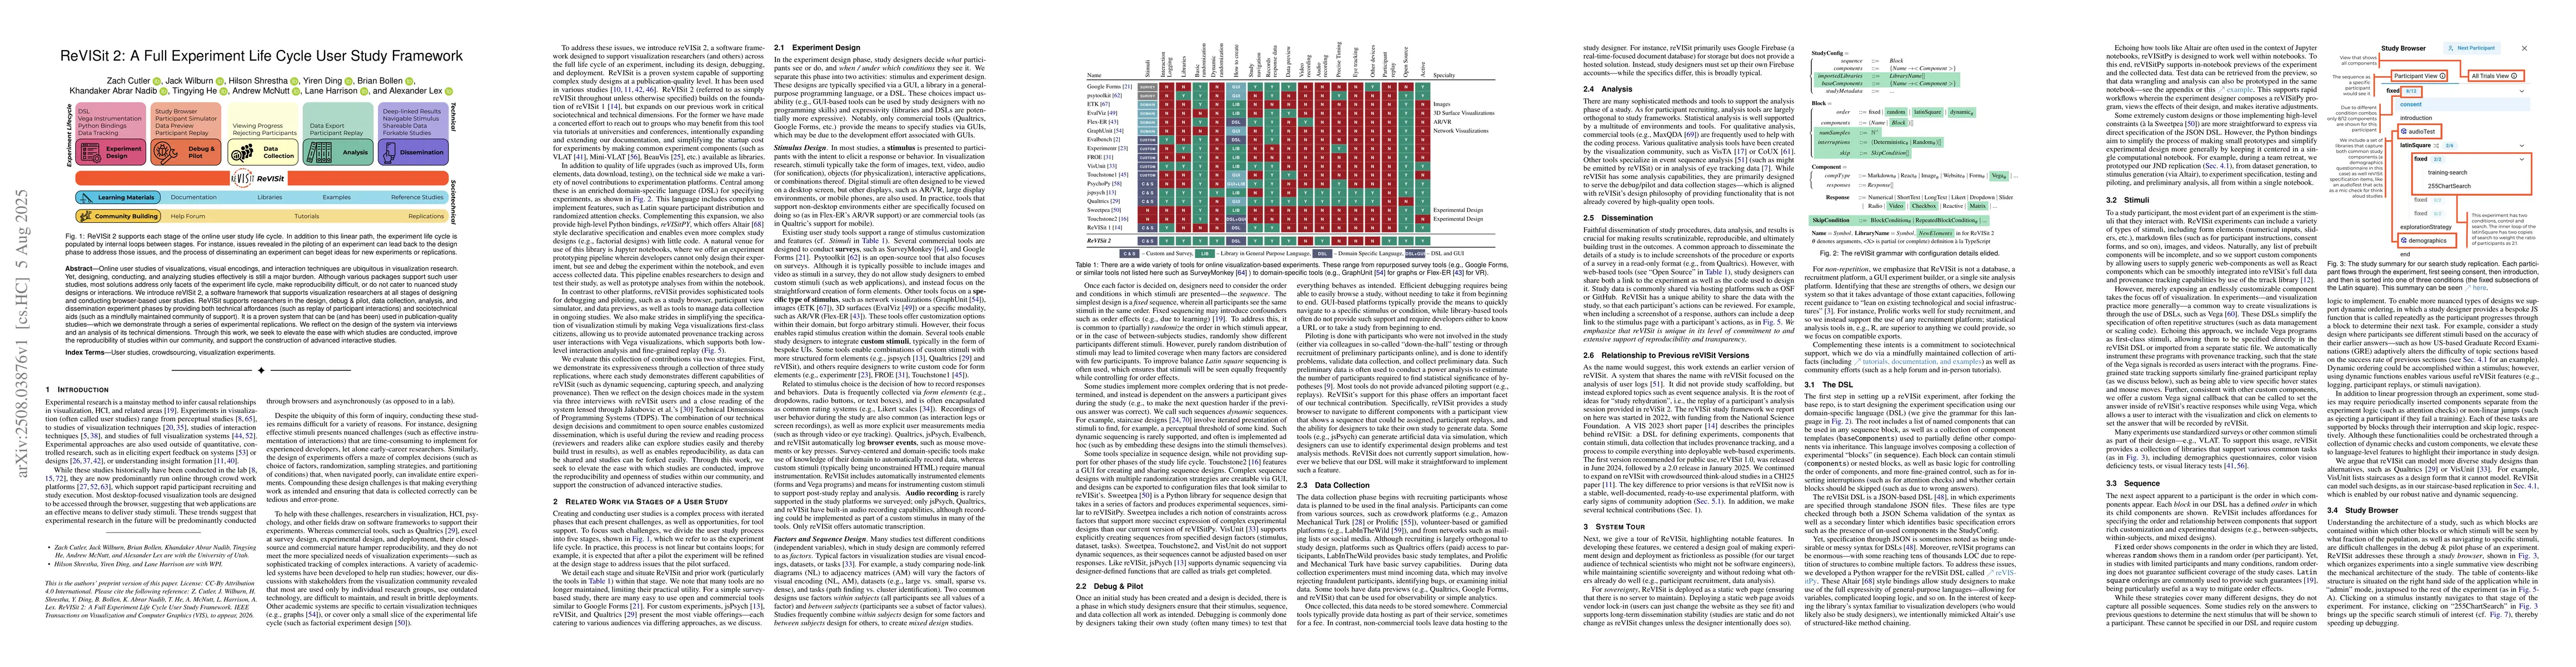
Online user studies of visualizations, visual encodings, and interaction techniques are ubiquitous in visualization research. Yet, designing, conducting, and analyzing studies effectively is still a m...
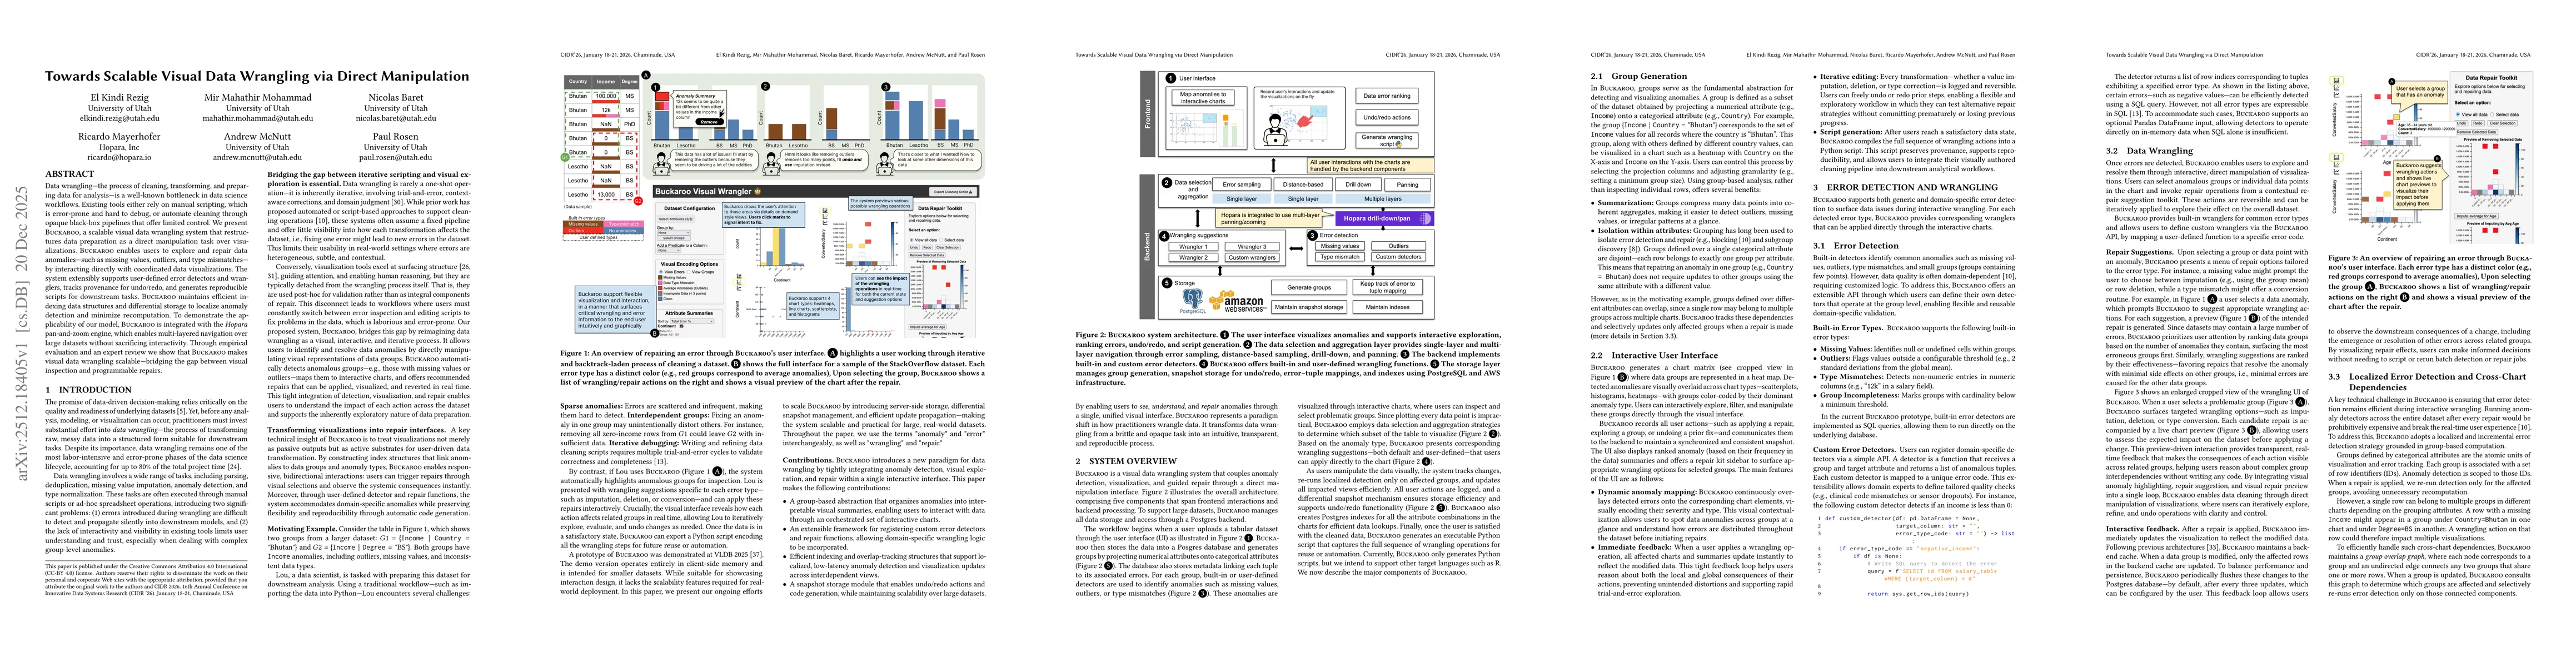
Data wrangling - the process of cleaning, transforming, and preparing data for analysis - is a well-known bottleneck in data science workflows. Existing tools either rely on manual scripting, which is...
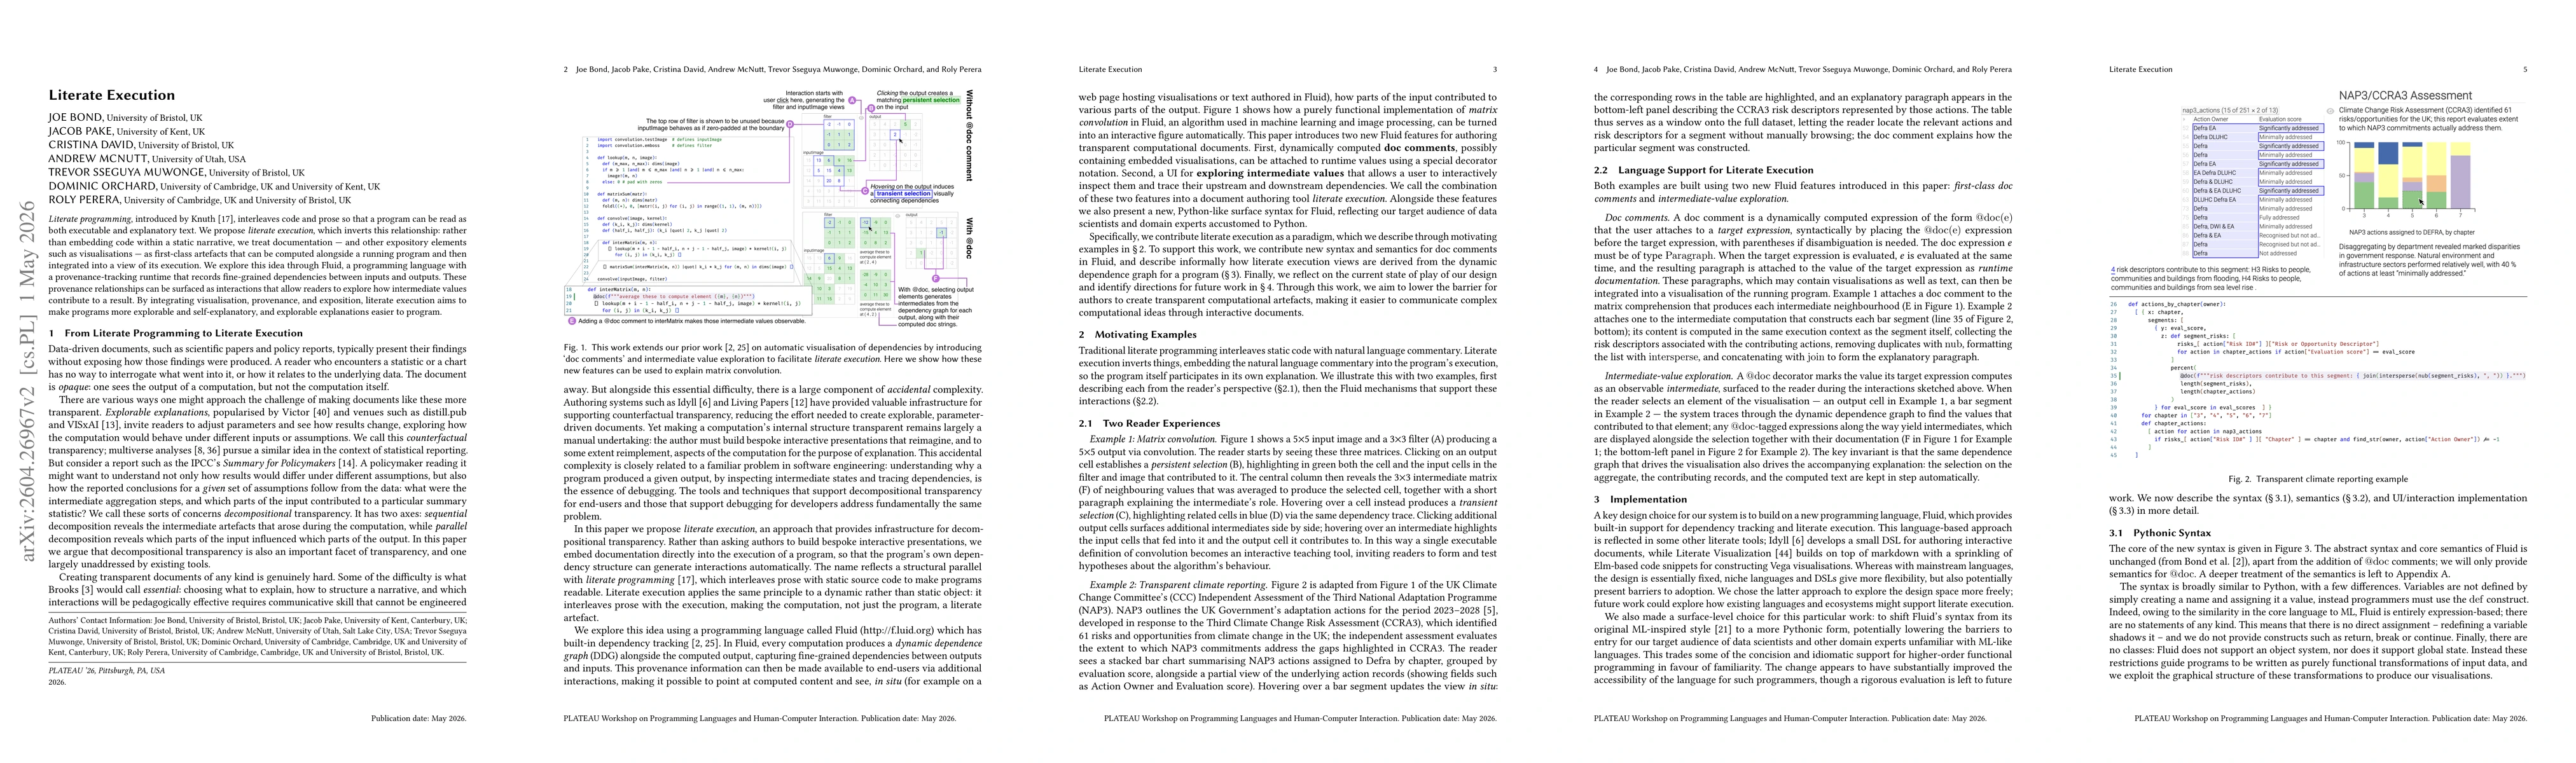
\emph{Literate programming}, introduced by Knurth, interleaves code and prose so that a program can be read as both executable and explanatory text. We propose \emph{literate execution}, which inverts...