Cody Dunne

13 papers on arXiv

Academic Profile

Name: C. Dunne
Total Papers: 36

Statistics

arXiv Papers 13
Total Publications 36

Papers on arXiv

Thumbnail for Predicting UAV Type: An Exploration of Sampling and Data Augmentation
  for Time Series Classification

Predicting UAV Type: An Exploration of Sampling and Data Augmentation for Time Series Classification

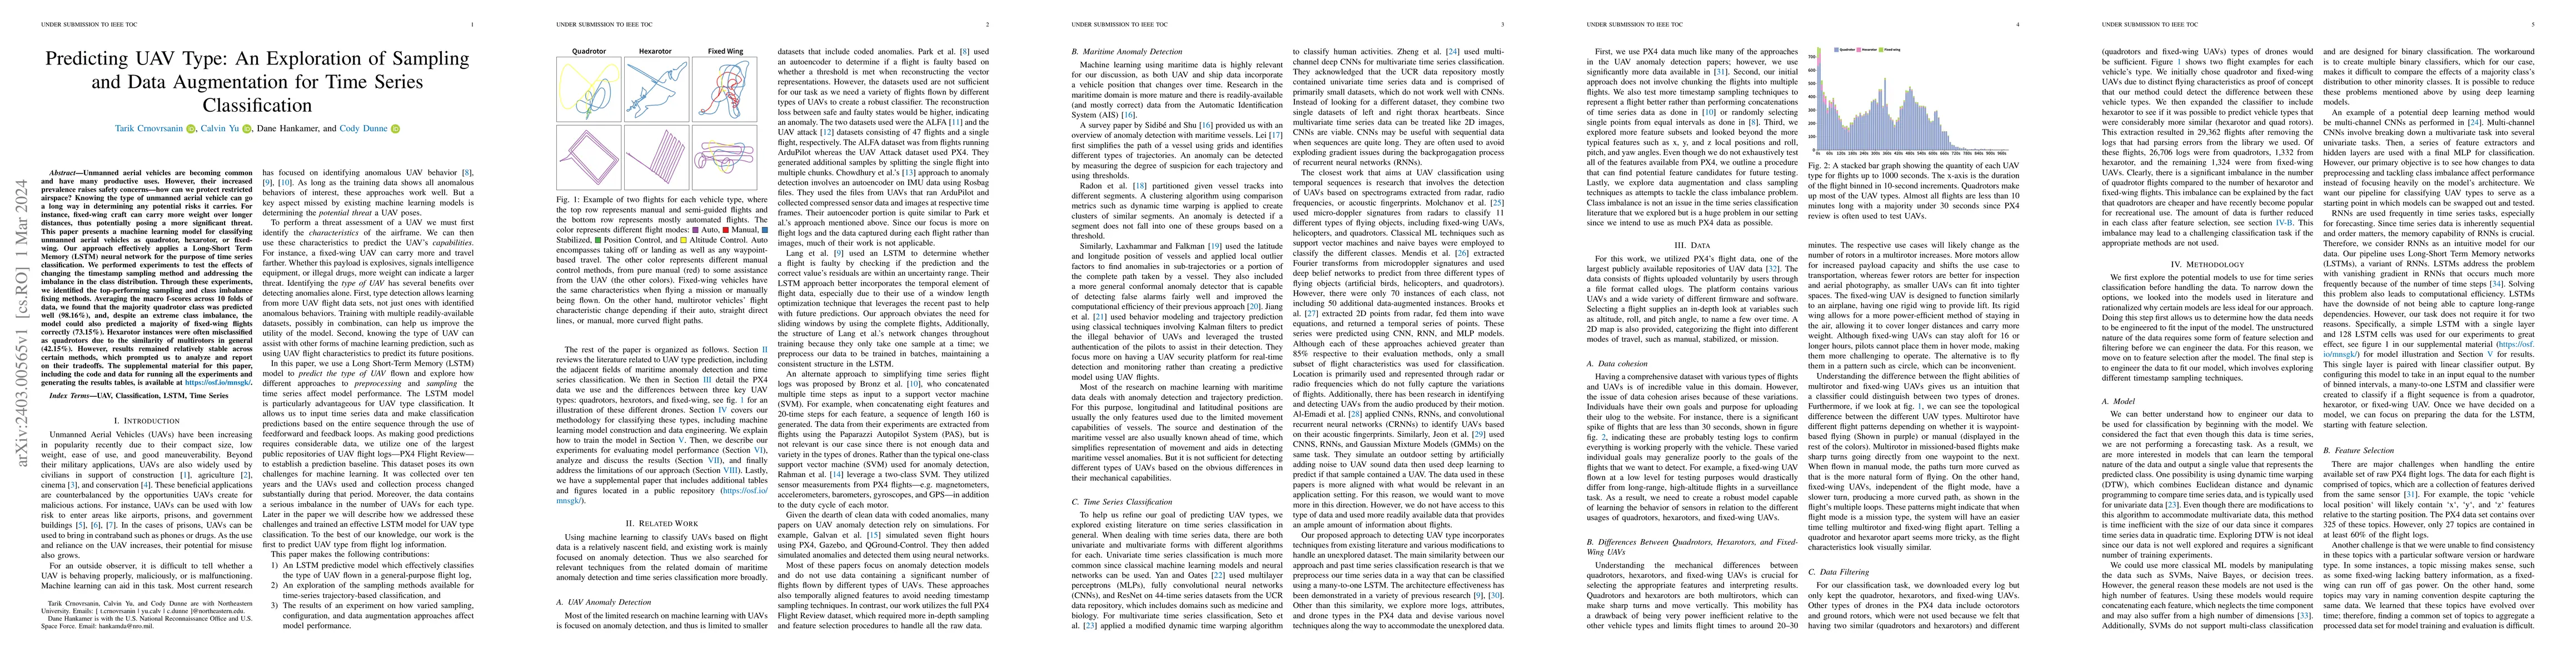
Unmanned aerial vehicles are becoming common and have many productive uses. However, their increased prevalence raises safety concerns -- how can we protect restricted airspace? Knowing the type of ...

Thumbnail for On The Reasonable Effectiveness of Relational Diagrams: Explaining
  Relational Query Patterns and the Pattern Expressiveness of Relational
  Languages

On The Reasonable Effectiveness of Relational Diagrams: Explaining Relational Query Patterns and the Pattern Expressiveness of Relational Languages

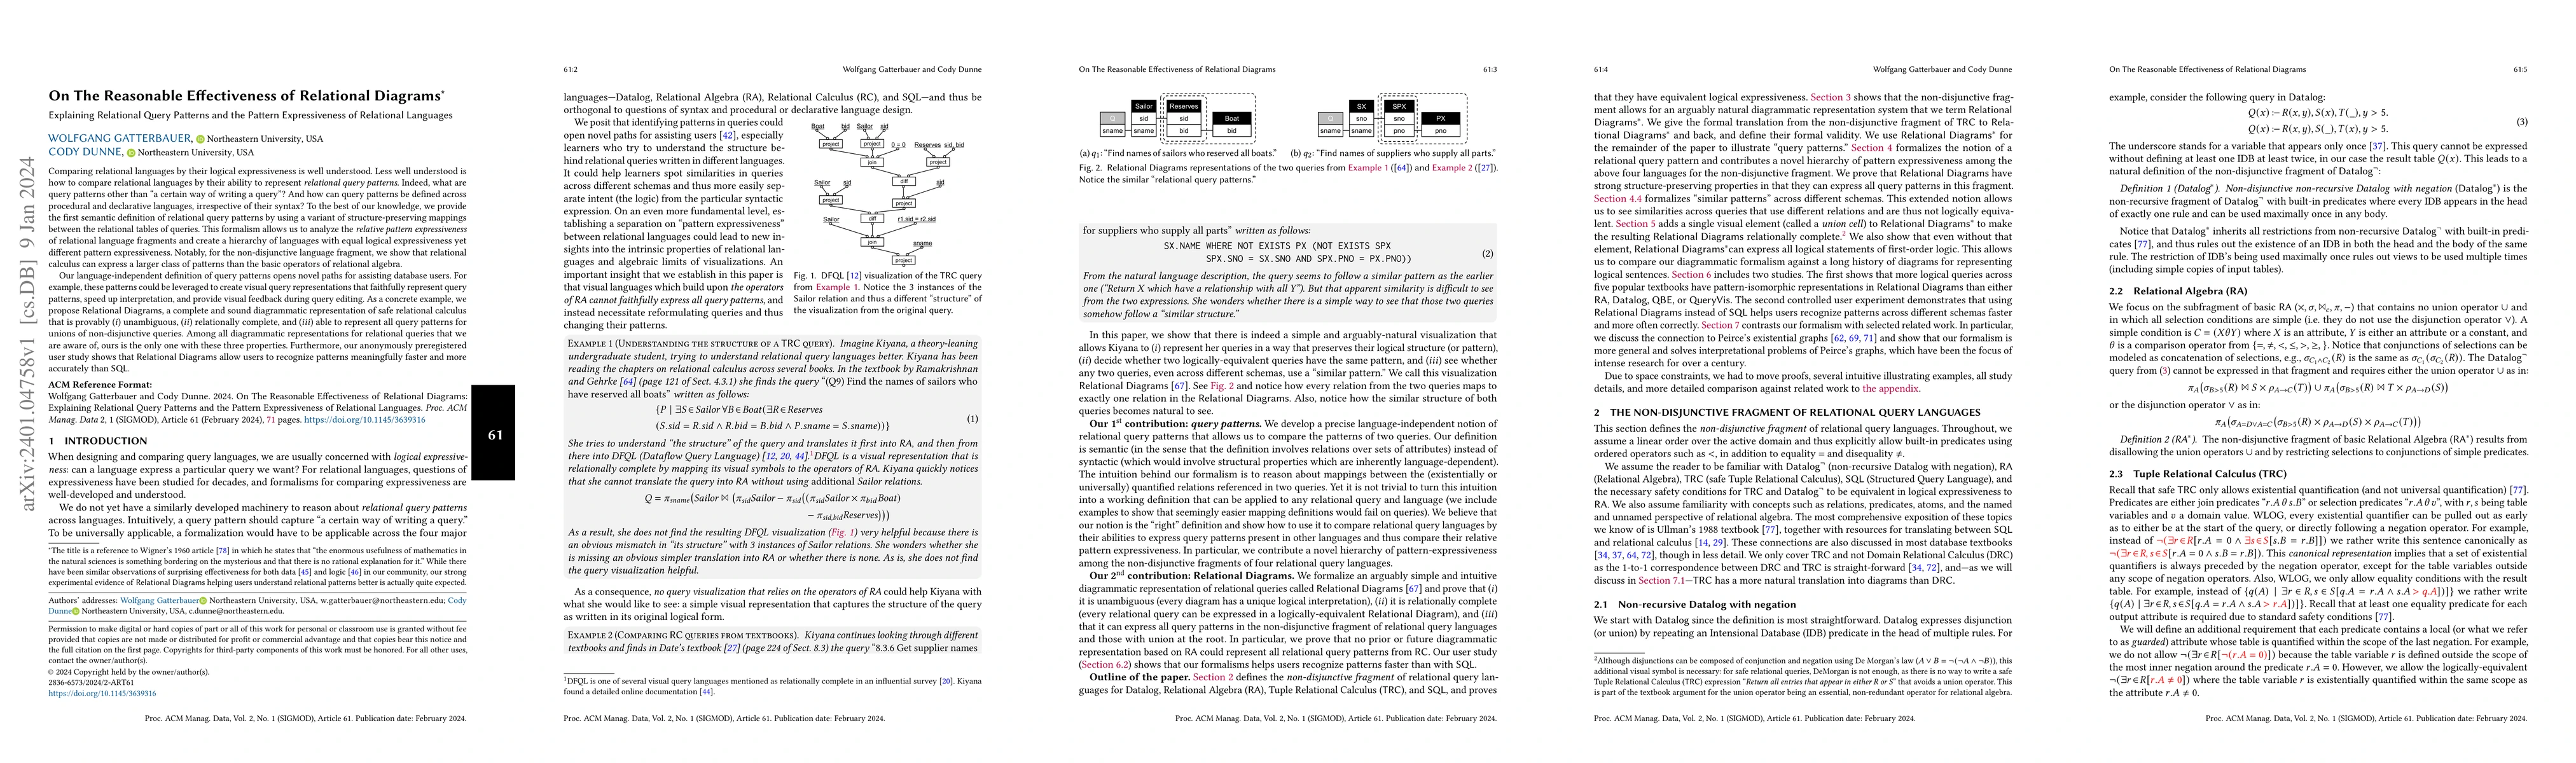
Comparing relational languages by their logical expressiveness is well understood. Less well understood is how to compare relational languages by their ability to represent relational query patterns...

Thumbnail for Space Partitioning Schemes and Algorithms for Generating Regular and
  Spiral Treemaps

Space Partitioning Schemes and Algorithms for Generating Regular and Spiral Treemaps

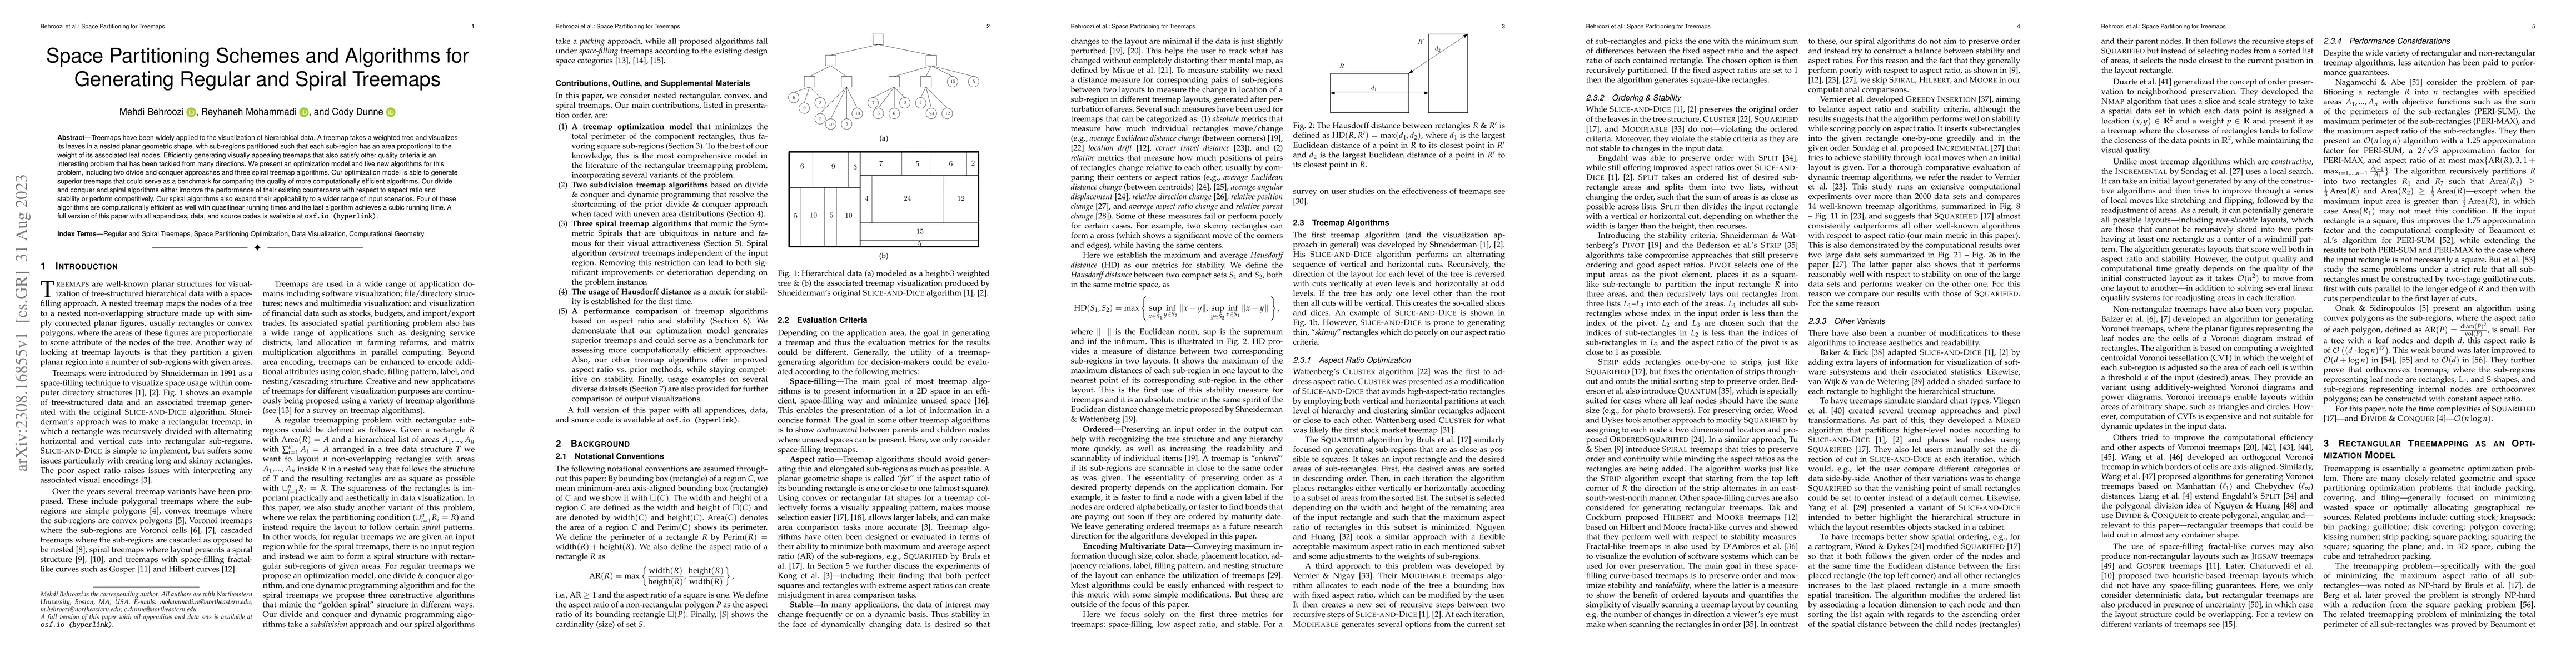
Treemaps have been widely applied to the visualization of hierarchical data. A treemap takes a weighted tree and visualizes its leaves in a nested planar geometric shape, with sub-regions partitione...

Thumbnail for Ask and You Shall Receive (a Graph Drawing): Testing ChatGPT's Potential
  to Apply Graph Layout Algorithms

Ask and You Shall Receive (a Graph Drawing): Testing ChatGPT's Potential to Apply Graph Layout Algorithms

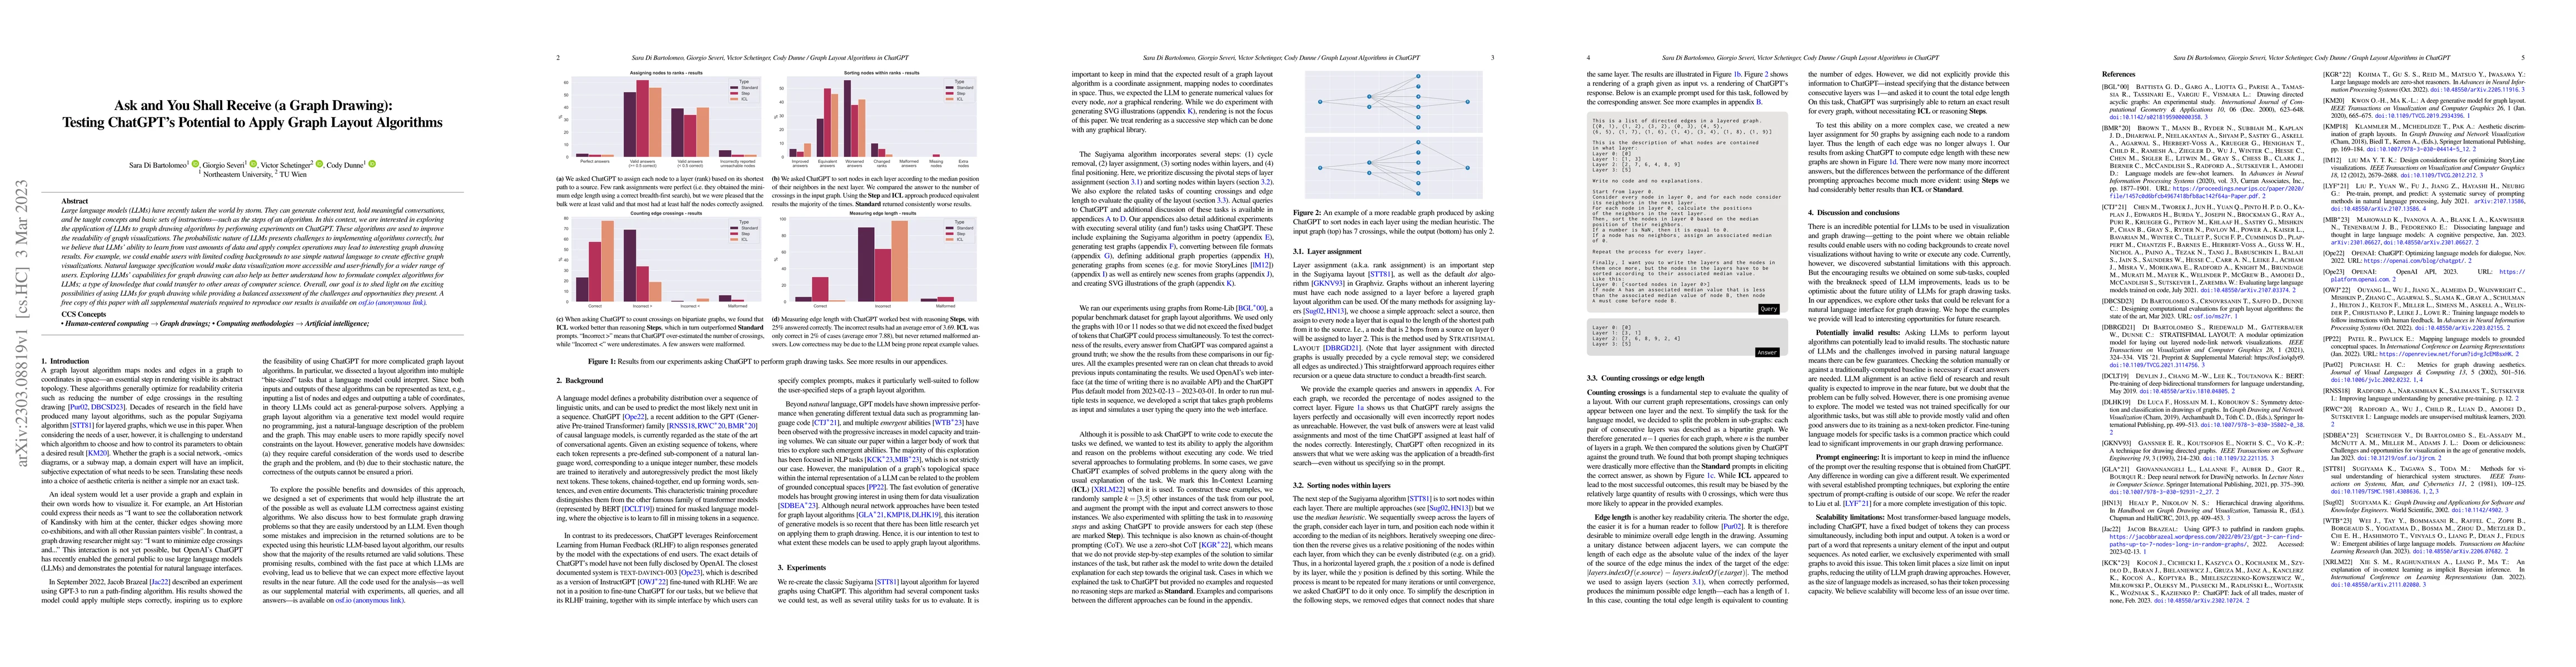
Large language models (LLMs) have recently taken the world by storm. They can generate coherent text, hold meaningful conversations, and be taught concepts and basic sets of instructions - such as t...

Thumbnail for Principles of Query Visualization

Principles of Query Visualization

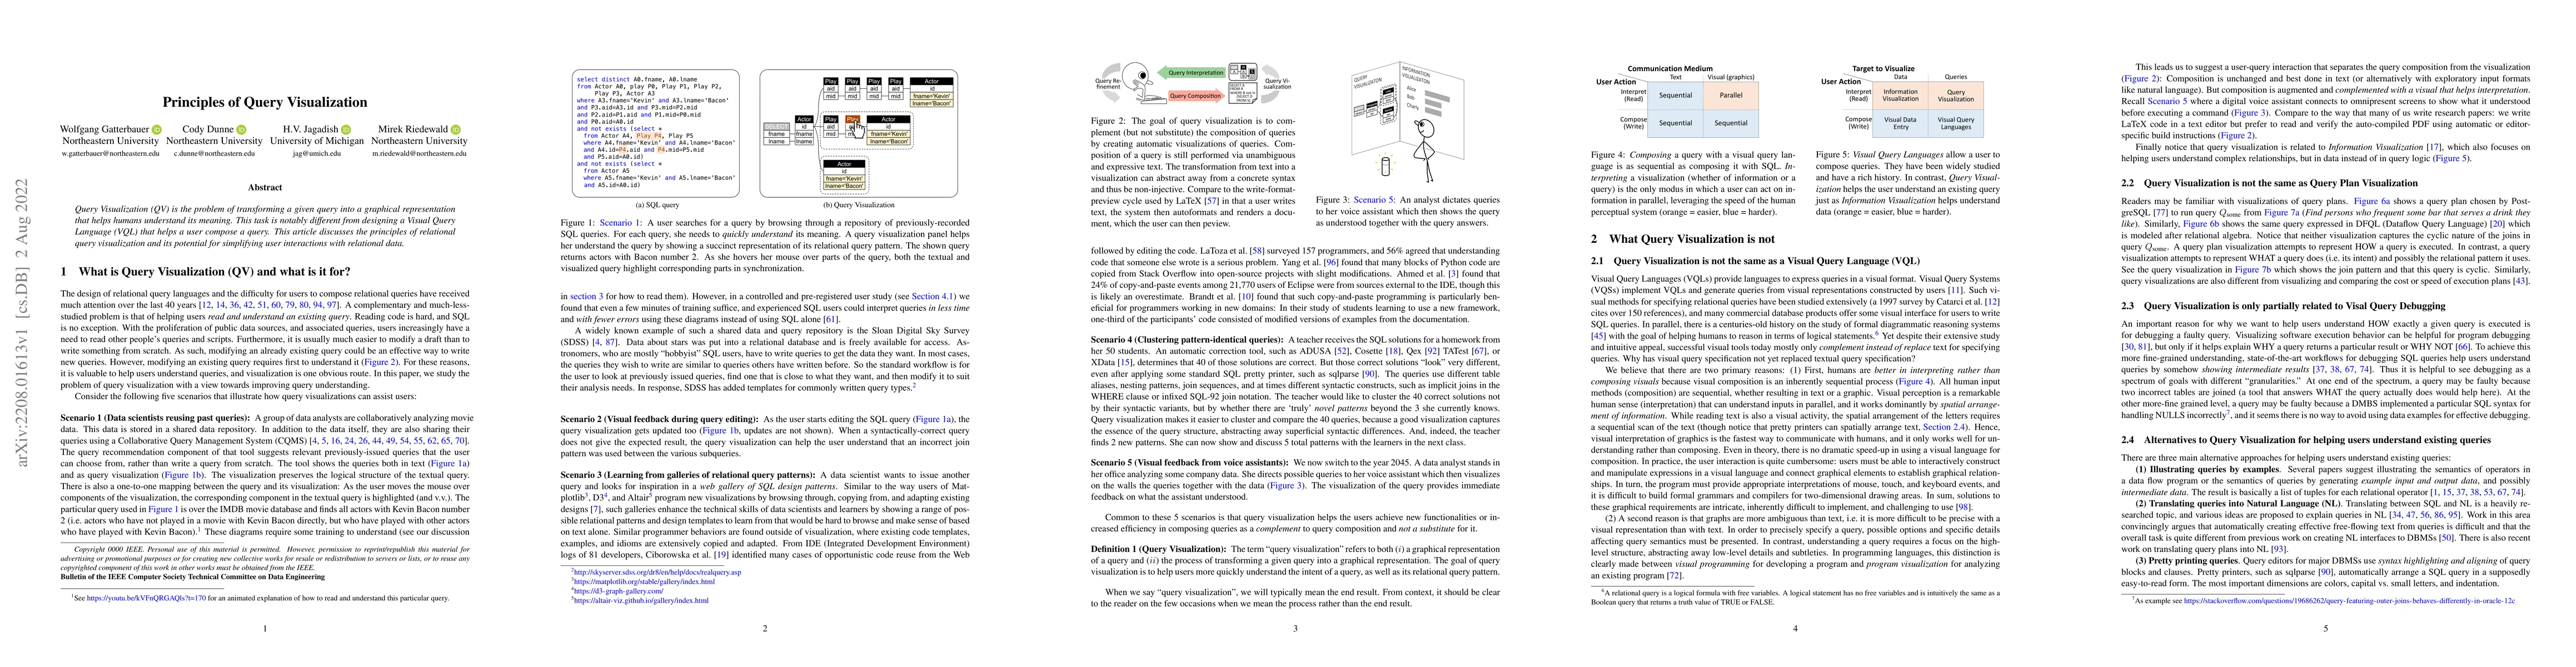
Query Visualization (QV) is the problem of transforming a given query into a graphical representation that helps humans understand its meaning. This task is notably different from designing a Visual...

Thumbnail for Relational Diagrams: a pattern-preserving diagrammatic representation of
  non-disjunctive Relational Queries

Relational Diagrams: a pattern-preserving diagrammatic representation of non-disjunctive Relational Queries

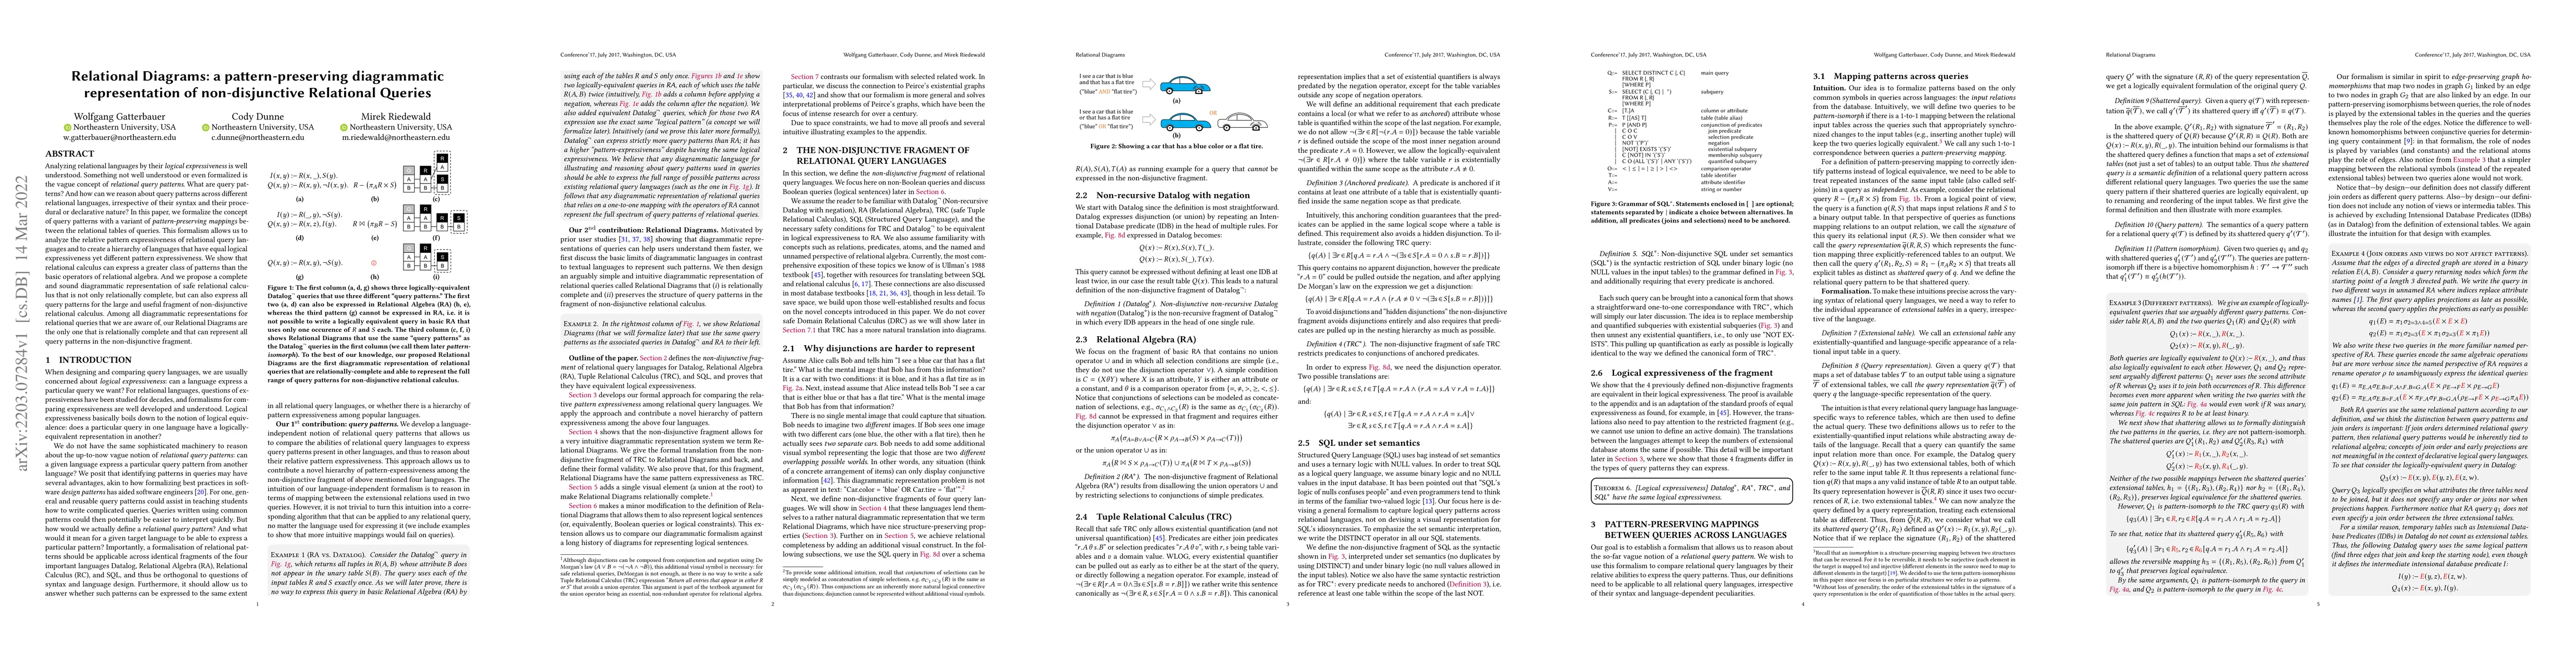
Analyzing relational languages by their logical expressiveness is well understood. Something not well understood or even formalized is the vague concept of relational query patterns. What are query ...

Thumbnail for Daisen: A Framework for Visualizing Detailed GPU Execution

Daisen: A Framework for Visualizing Detailed GPU Execution

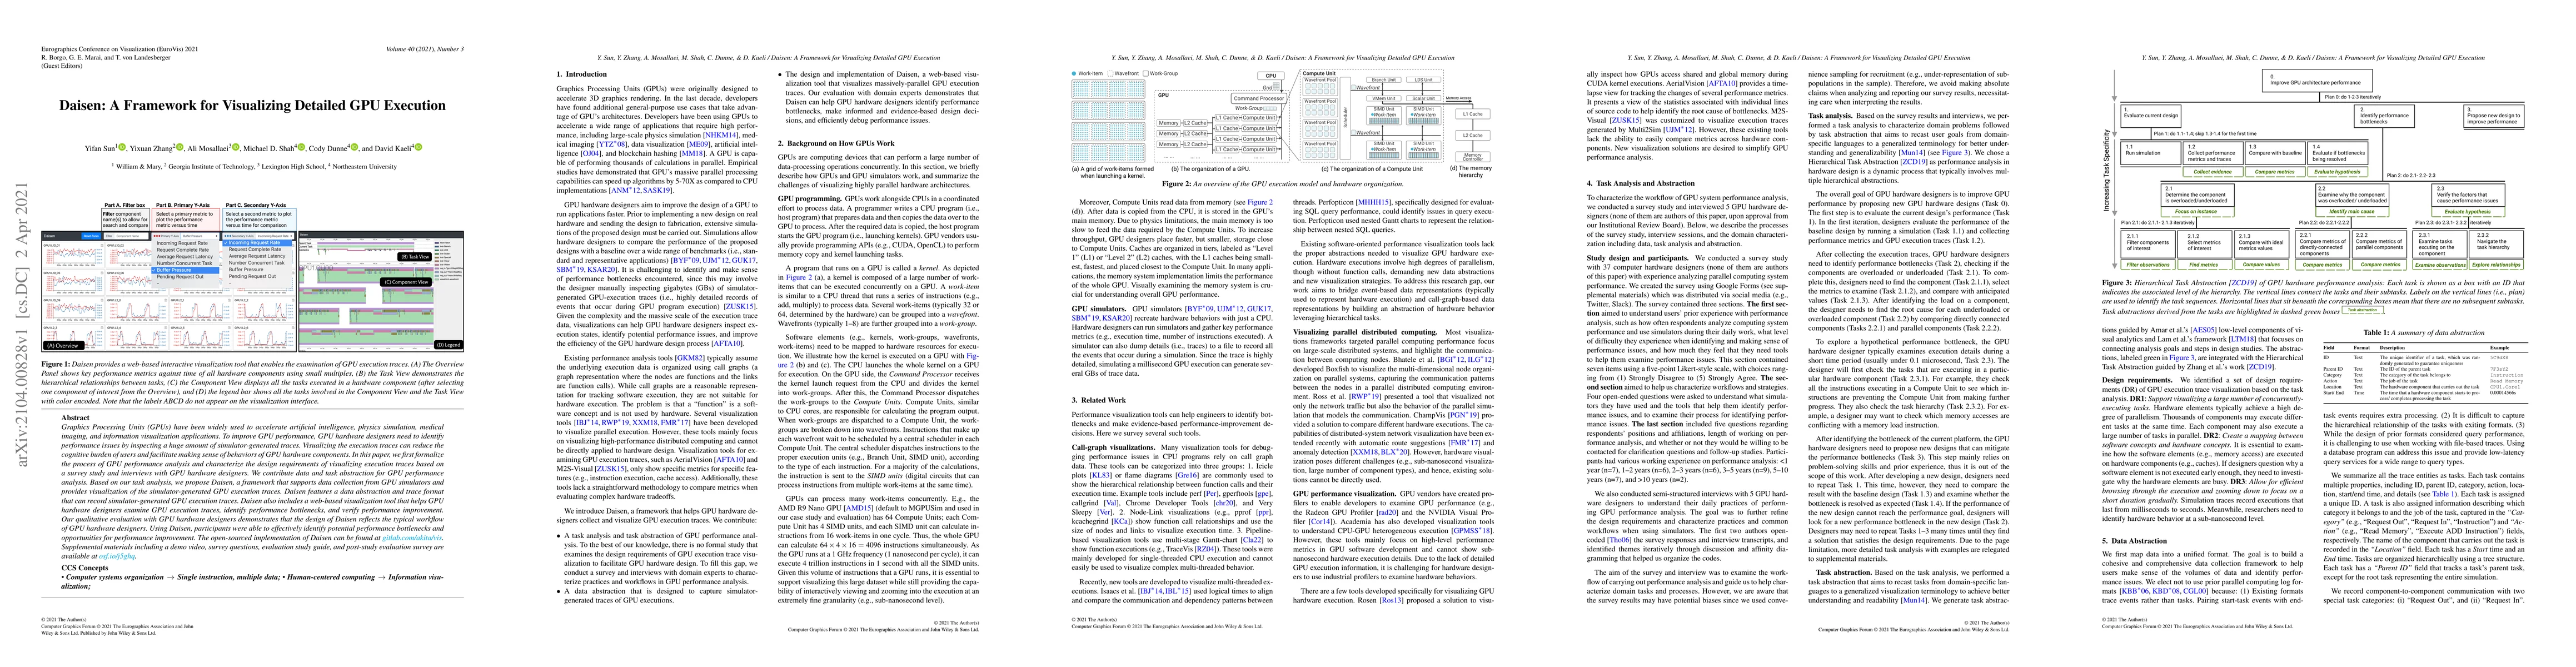
Graphics Processing Units (GPUs) have been widely used to accelerate artificial intelligence, physics simulation, medical imaging, and information visualization applications. To improve GPU performa...

Thumbnail for Evaluating the Effect of Timeline Shape on Visualization Task
  Performance

Evaluating the Effect of Timeline Shape on Visualization Task Performance

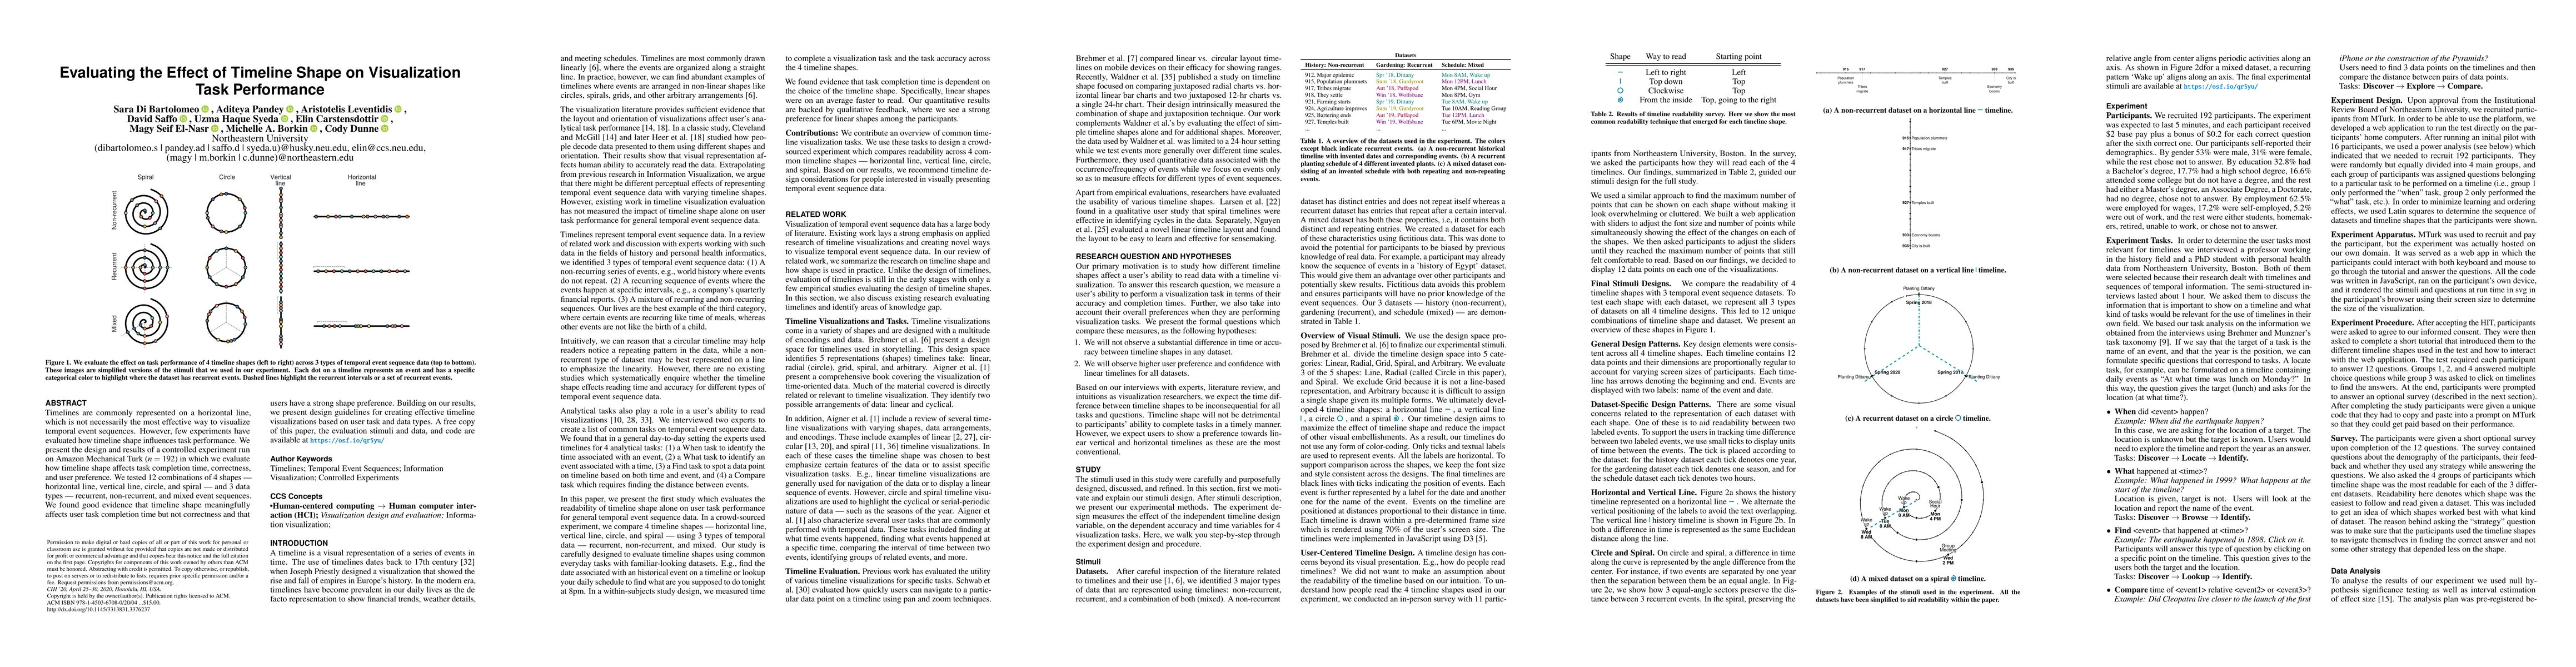
Timelines are commonly represented on a horizontal line, which is not necessarily the most effective way to visualize temporal event sequences. However, few experiments have evaluated how timeline s...

Thumbnail for Two Dimensions for Organizing Immersive Analytics: Toward a Taxonomy for
  Facet and Position

Two Dimensions for Organizing Immersive Analytics: Toward a Taxonomy for Facet and Position

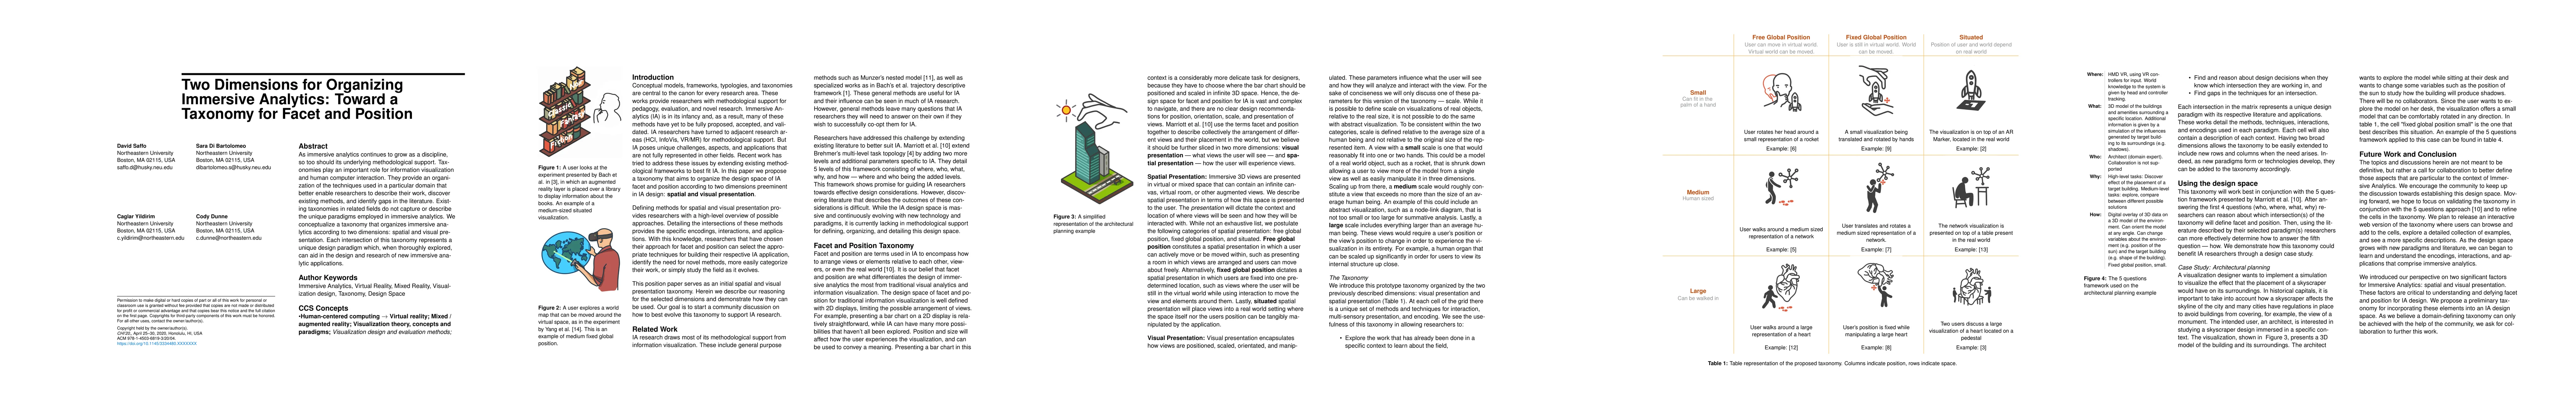
As immersive analytics continues to grow as a discipline, so too should its underlying methodological support. Taxonomies play an important role for information visualization and human computer inte...

Thumbnail for Data Comets: Designing a Visualization Tool for Analyzing Autonomous
  Aerial Vehicle Logs with Grounded Evaluation

Data Comets: Designing a Visualization Tool for Analyzing Autonomous Aerial Vehicle Logs with Grounded Evaluation

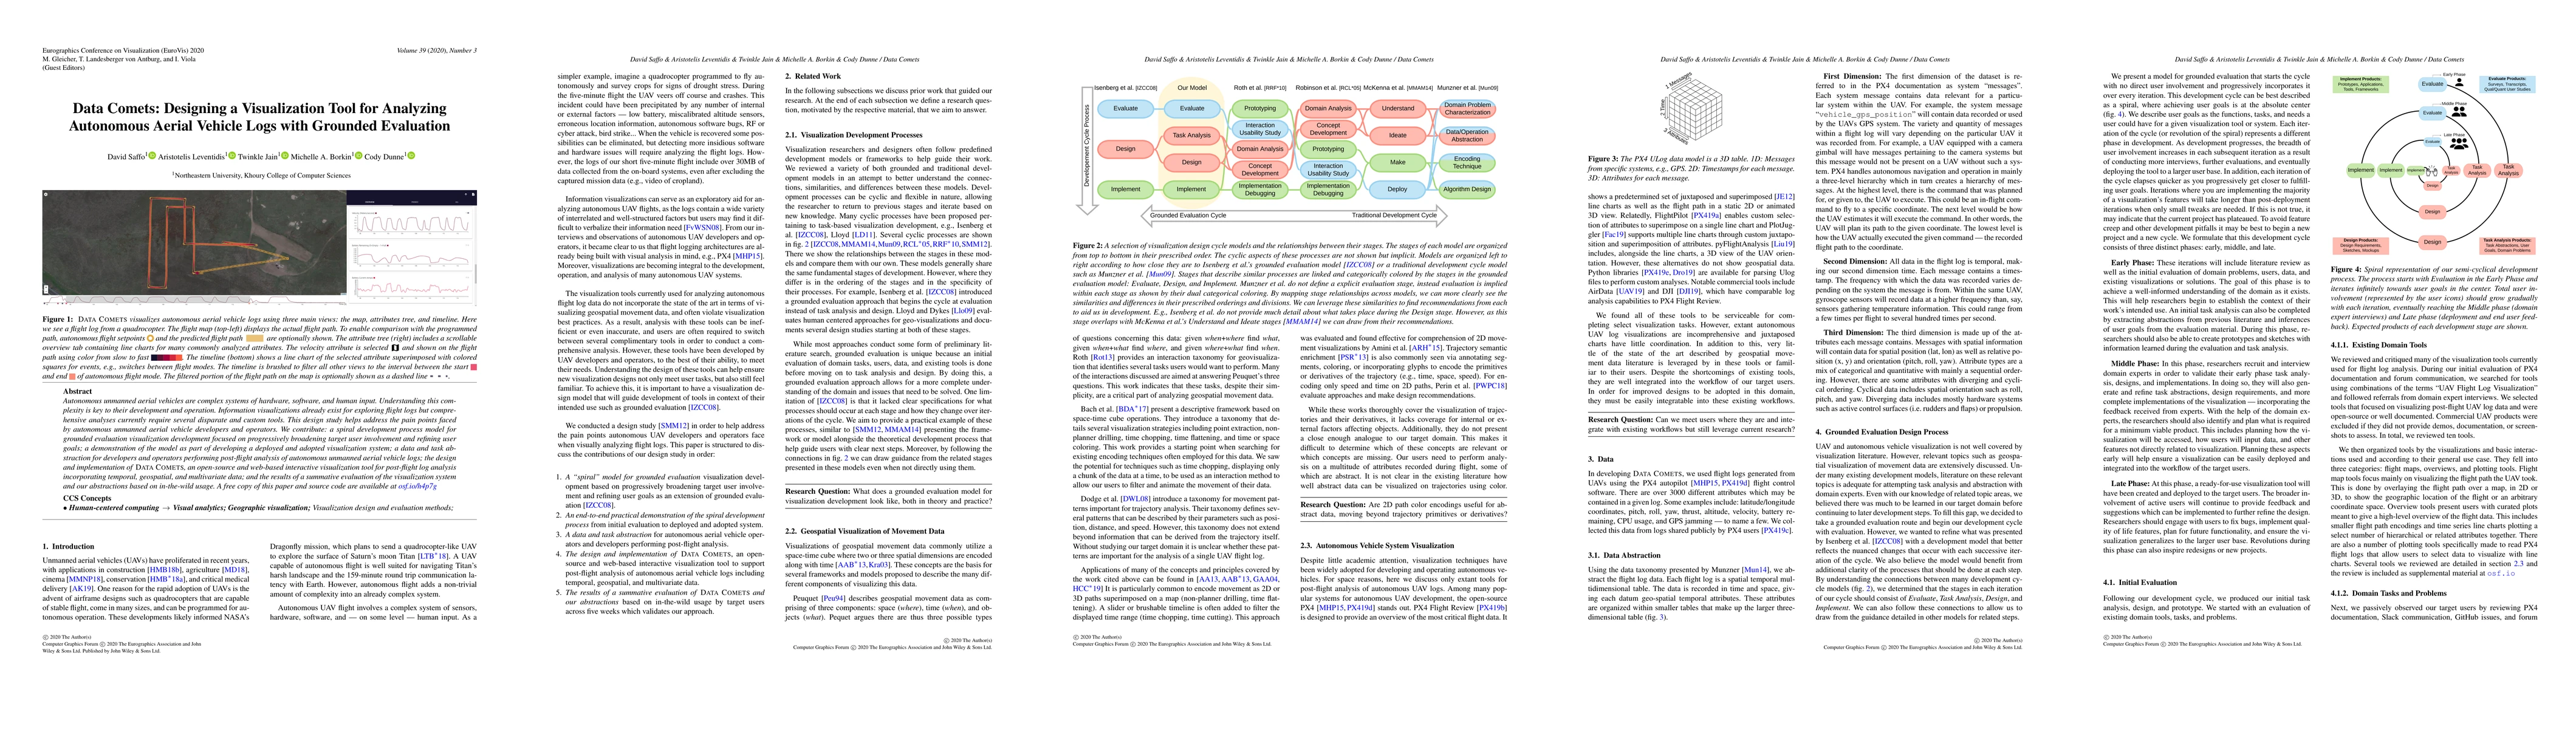
Autonomous unmanned aerial vehicles are complex systems of hardware, software, and human input. Understanding this complexity is key to their development and operation. Information visualizations al...

Thumbnail for QueryVis: Logic-based diagrams help users understand complicated SQL
  queries faster

QueryVis: Logic-based diagrams help users understand complicated SQL queries faster

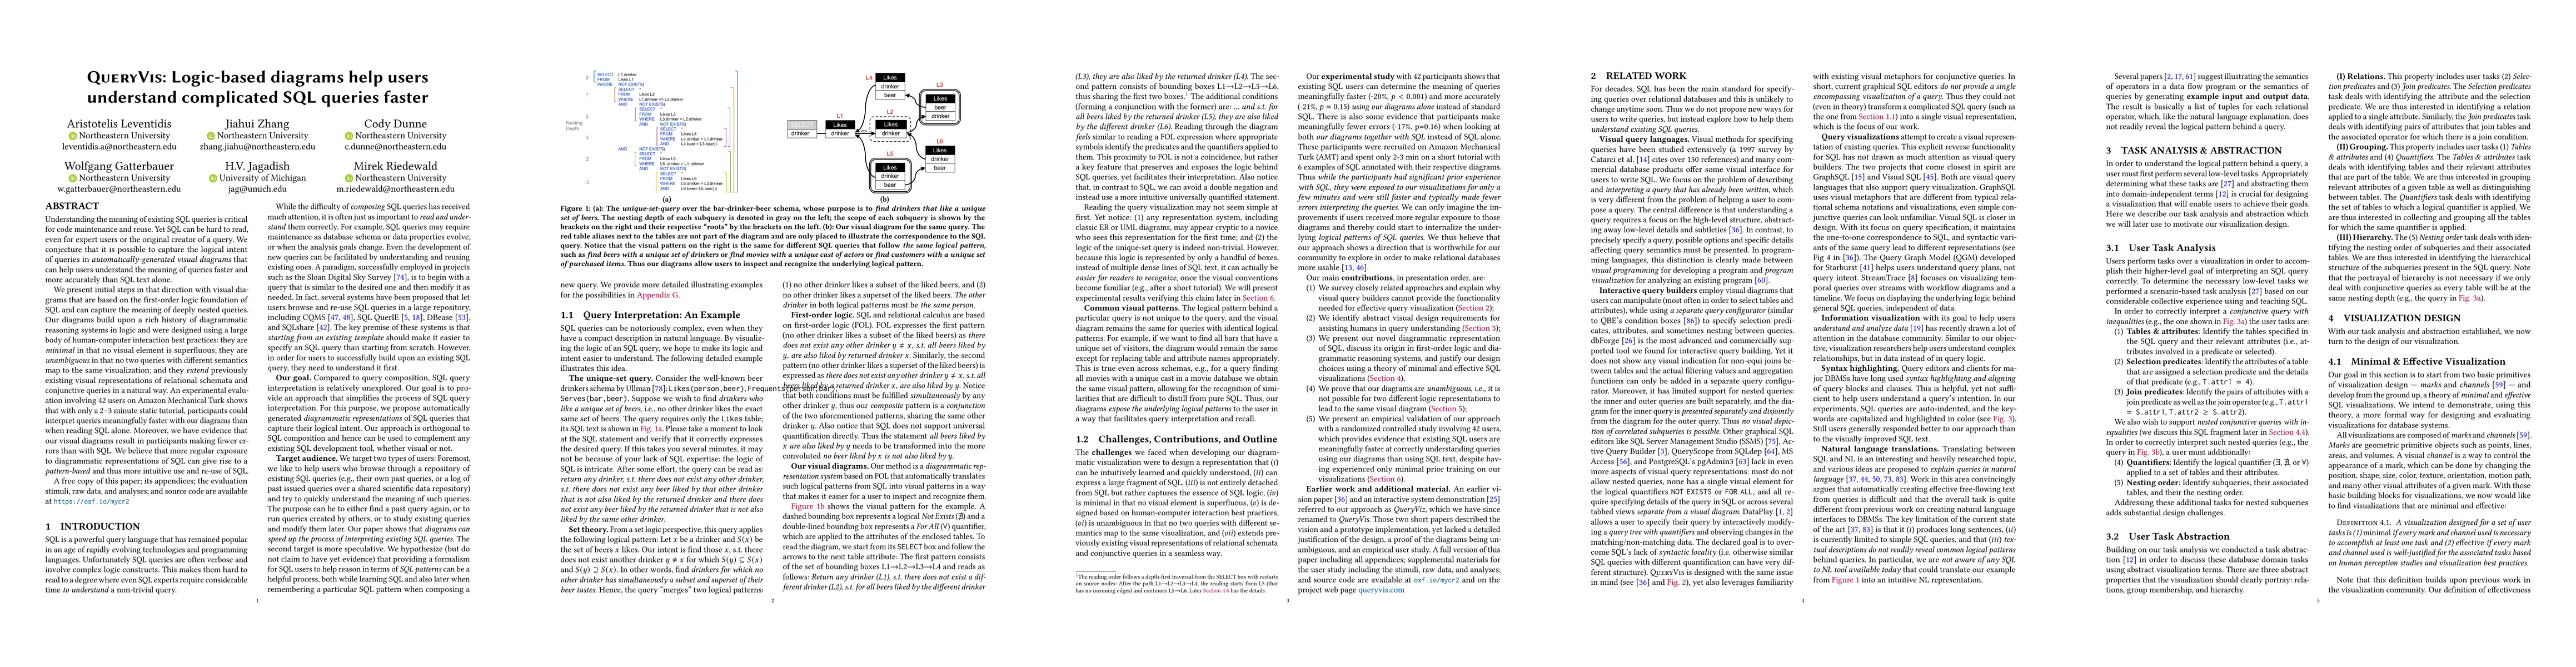
Understanding the meaning of existing SQL queries is critical for code maintenance and reuse. Yet SQL can be hard to read, even for expert users or the original creator of a query. We conjecture tha...

Thumbnail for Evaluating Alignment Approaches in Superimposed Time-Series and Temporal
  Event-Sequence Visualizations

Evaluating Alignment Approaches in Superimposed Time-Series and Temporal Event-Sequence Visualizations

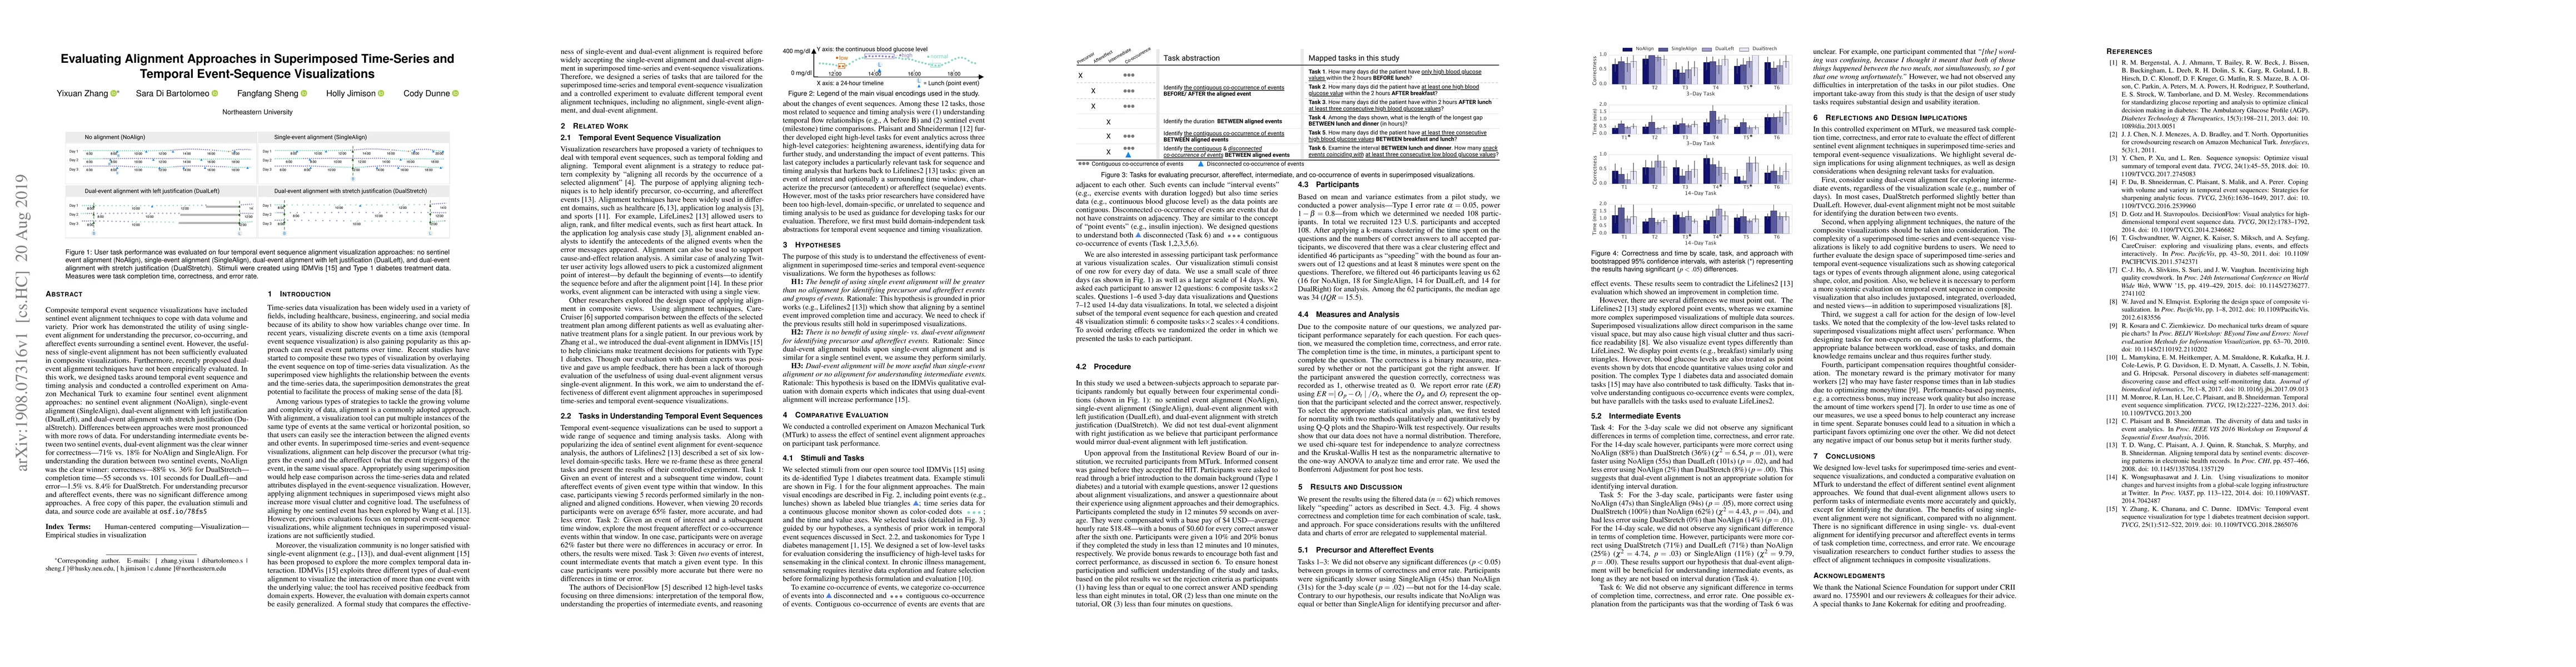
Composite temporal event sequence visualizations have included sentinel event alignment techniques to cope with data volume and variety. Prior work has demonstrated the utility of using single-event...

Thumbnail for Set Visualizations for Comparing and Evaluating Machine Learning Models

Set Visualizations for Comparing and Evaluating Machine Learning Models

Machine learning practitioners often need to compare multiple models to select the best one for their application. However, current methods of comparing models fall short because they rely on aggregat...

This website uses cookies to ensure you get the best experience. Learn more