Academic Profile
Statistics
Similar Authors
Papers on arXiv
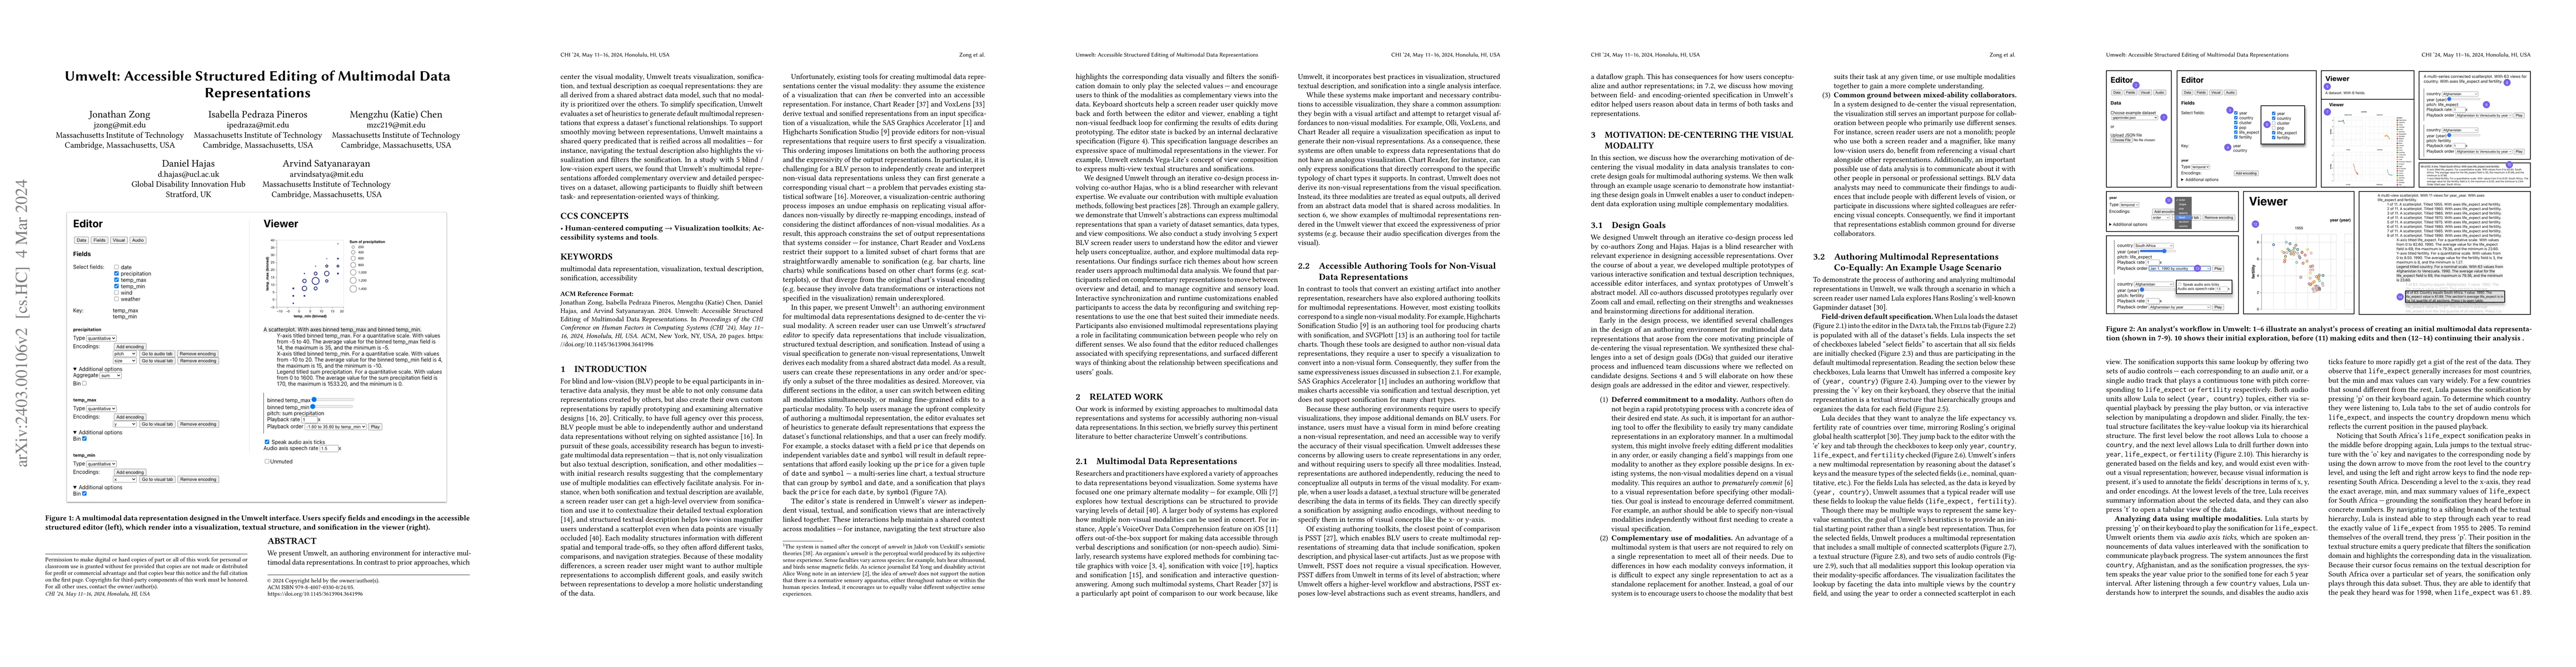
We present Umwelt, an authoring environment for interactive multimodal data representations. In contrast to prior approaches, which center the visual modality, Umwelt treats visualization, sonificat...
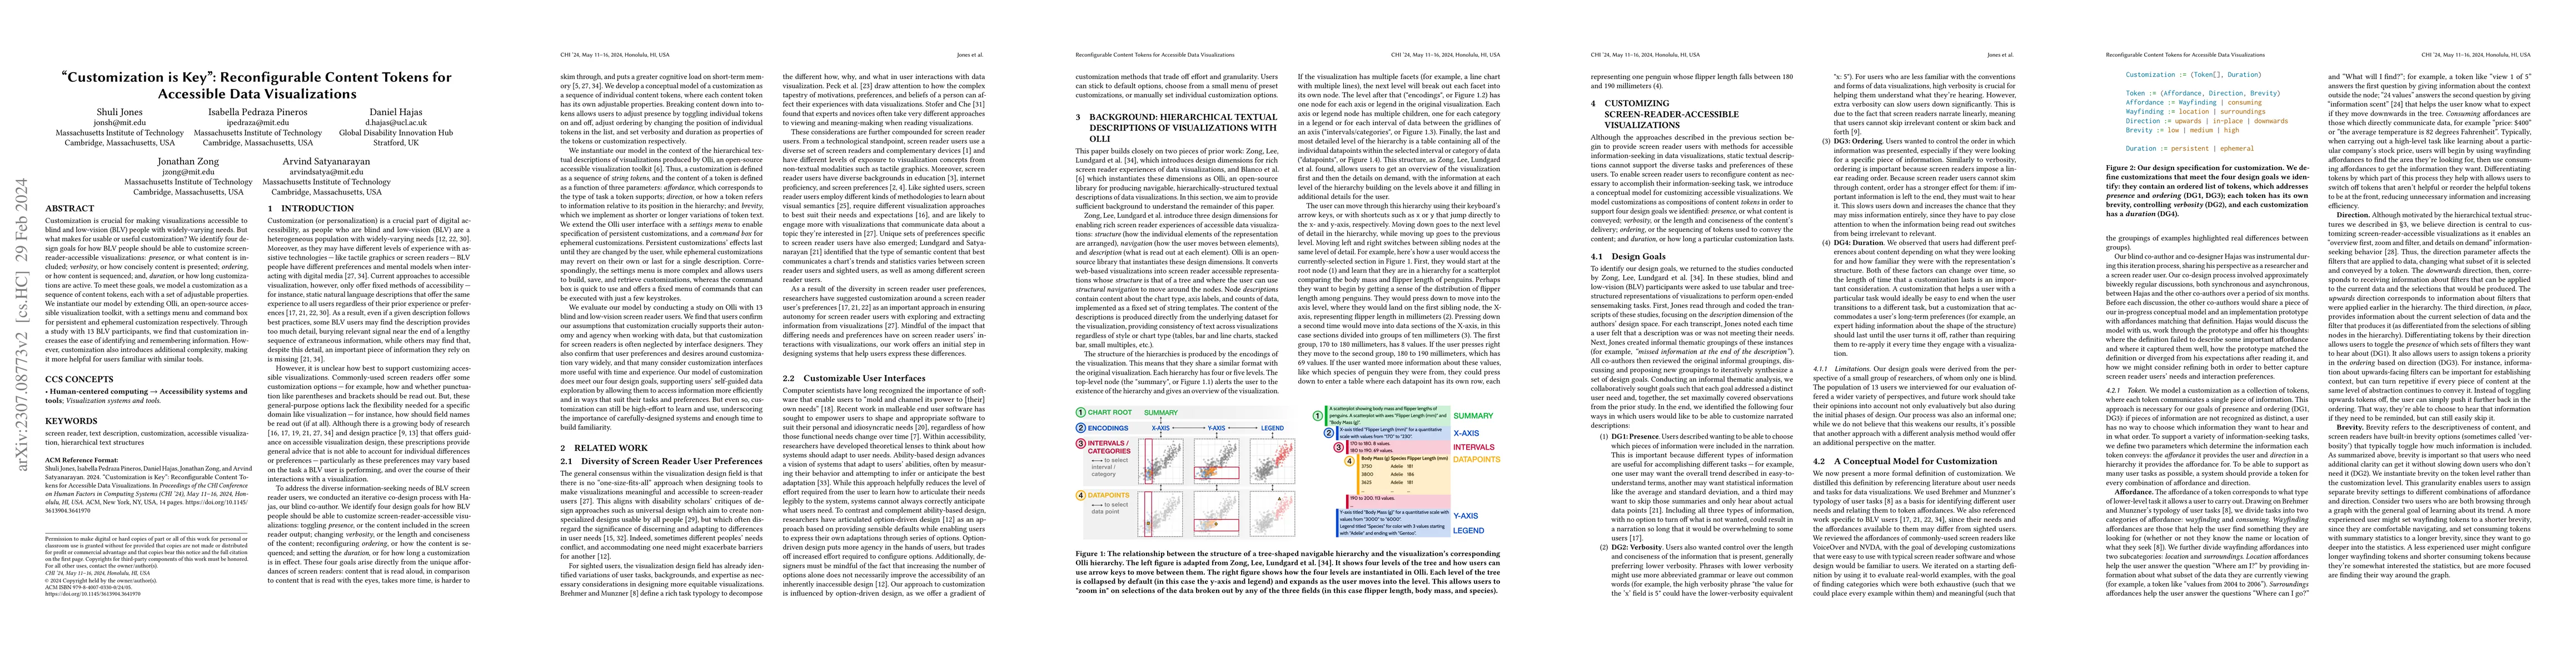
Customization is crucial for making visualizations accessible to blind and low-vision (BLV) people with widely-varying needs. But what makes for usable or useful customization? We identify four desi...
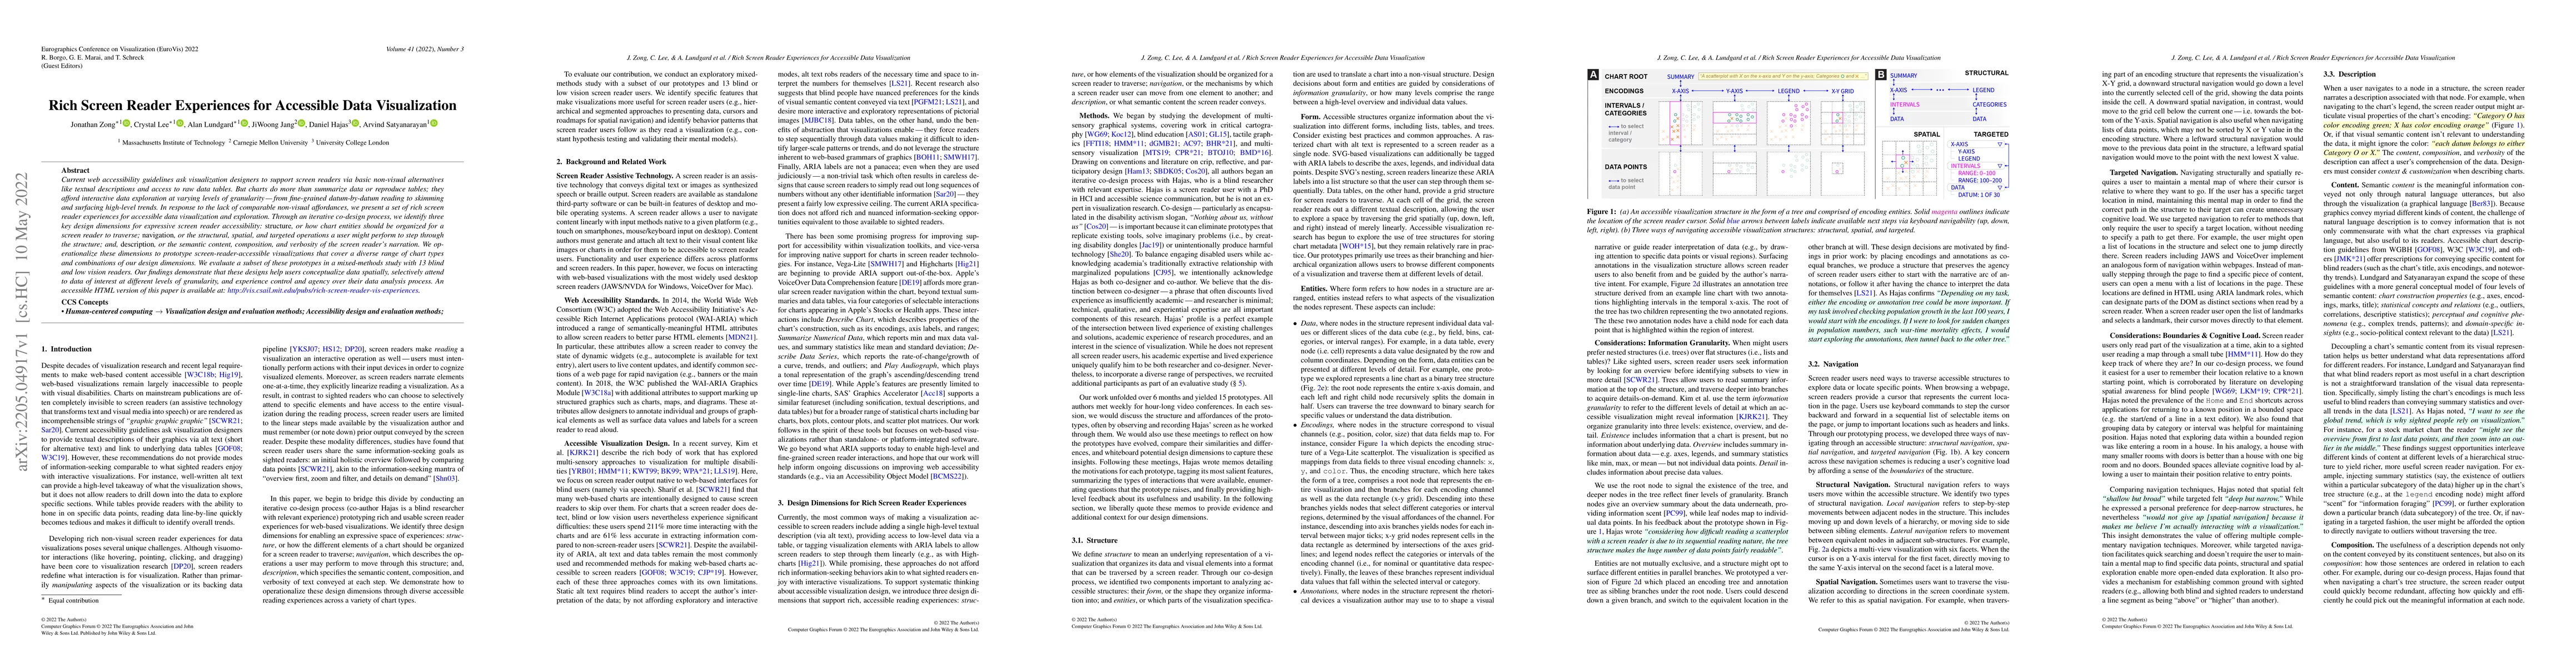
Current web accessibility guidelines ask visualization designers to support screen readers via basic non-visual alternatives like textual descriptions and access to raw data tables. But charts do mo...
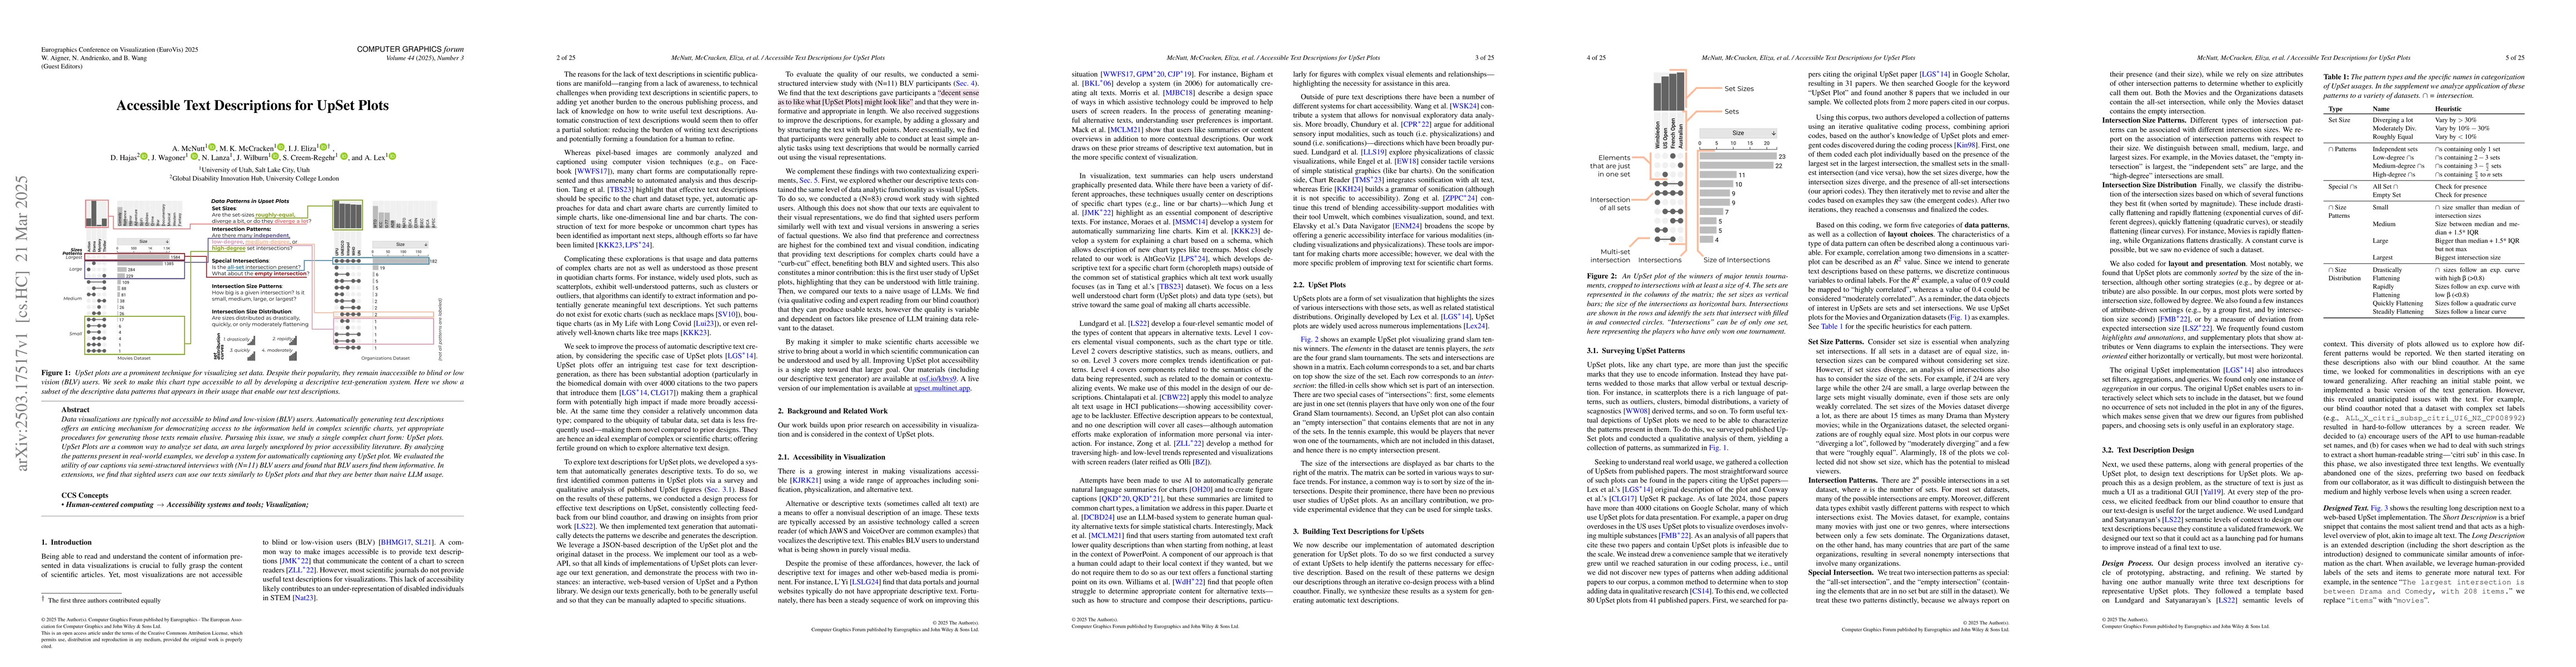
Data visualizations are typically not accessible to blind and low-vision (BLV) users. Automatically generating text descriptions offers an enticing mechanism for democratizing access to the informatio...
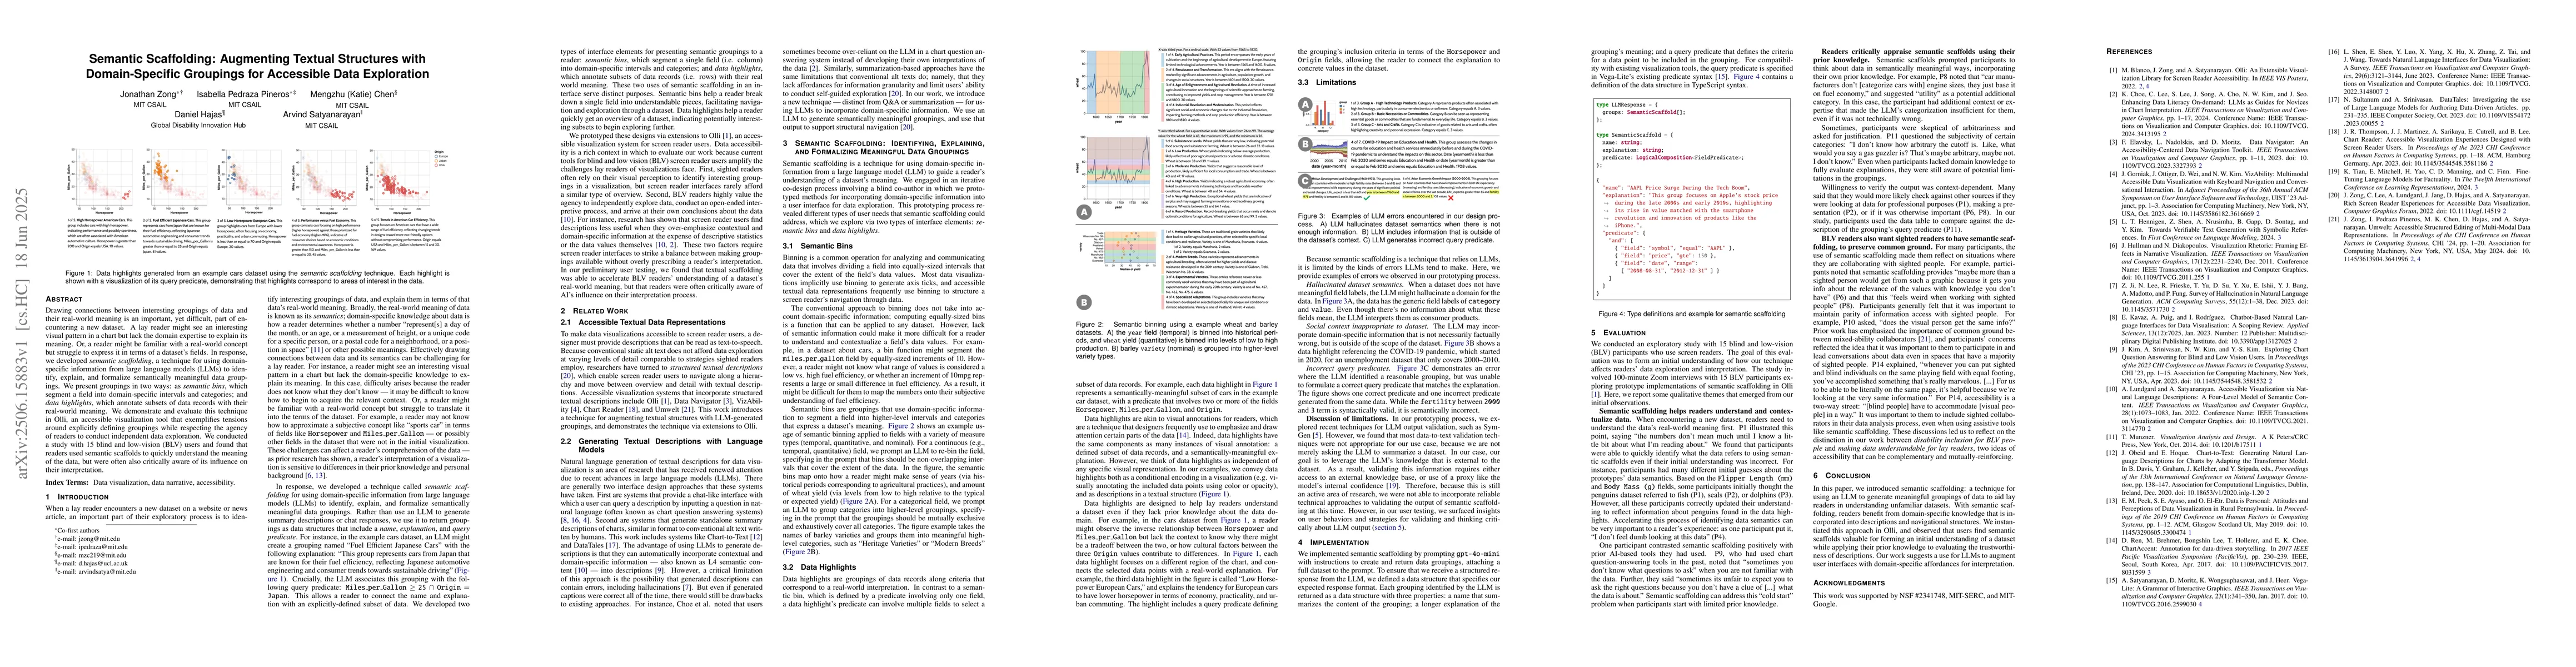
Drawing connections between interesting groupings of data and their real-world meaning is an important, yet difficult, part of encountering a new dataset. A lay reader might see an interesting visual ...
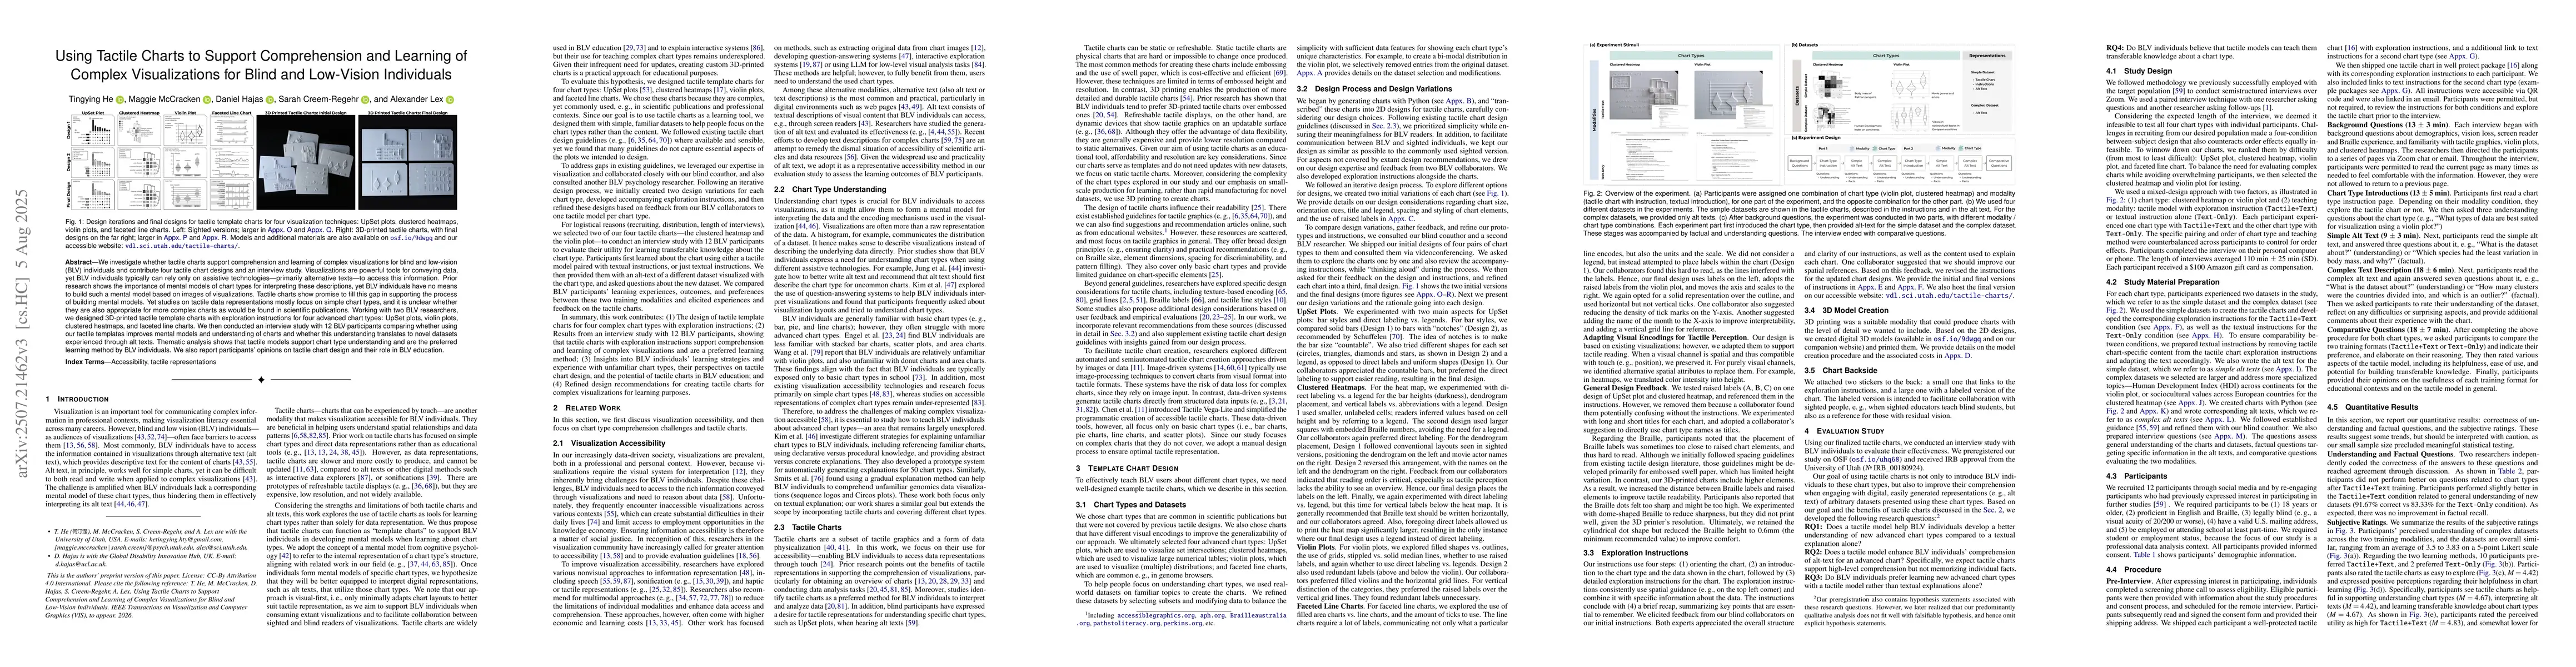
We investigate whether tactile charts support comprehension and learning of complex visualizations for blind and low-vision (BLV) individuals and contribute four tactile chart designs and an interview...