Academic Profile
Statistics
Similar Authors
Papers on arXiv
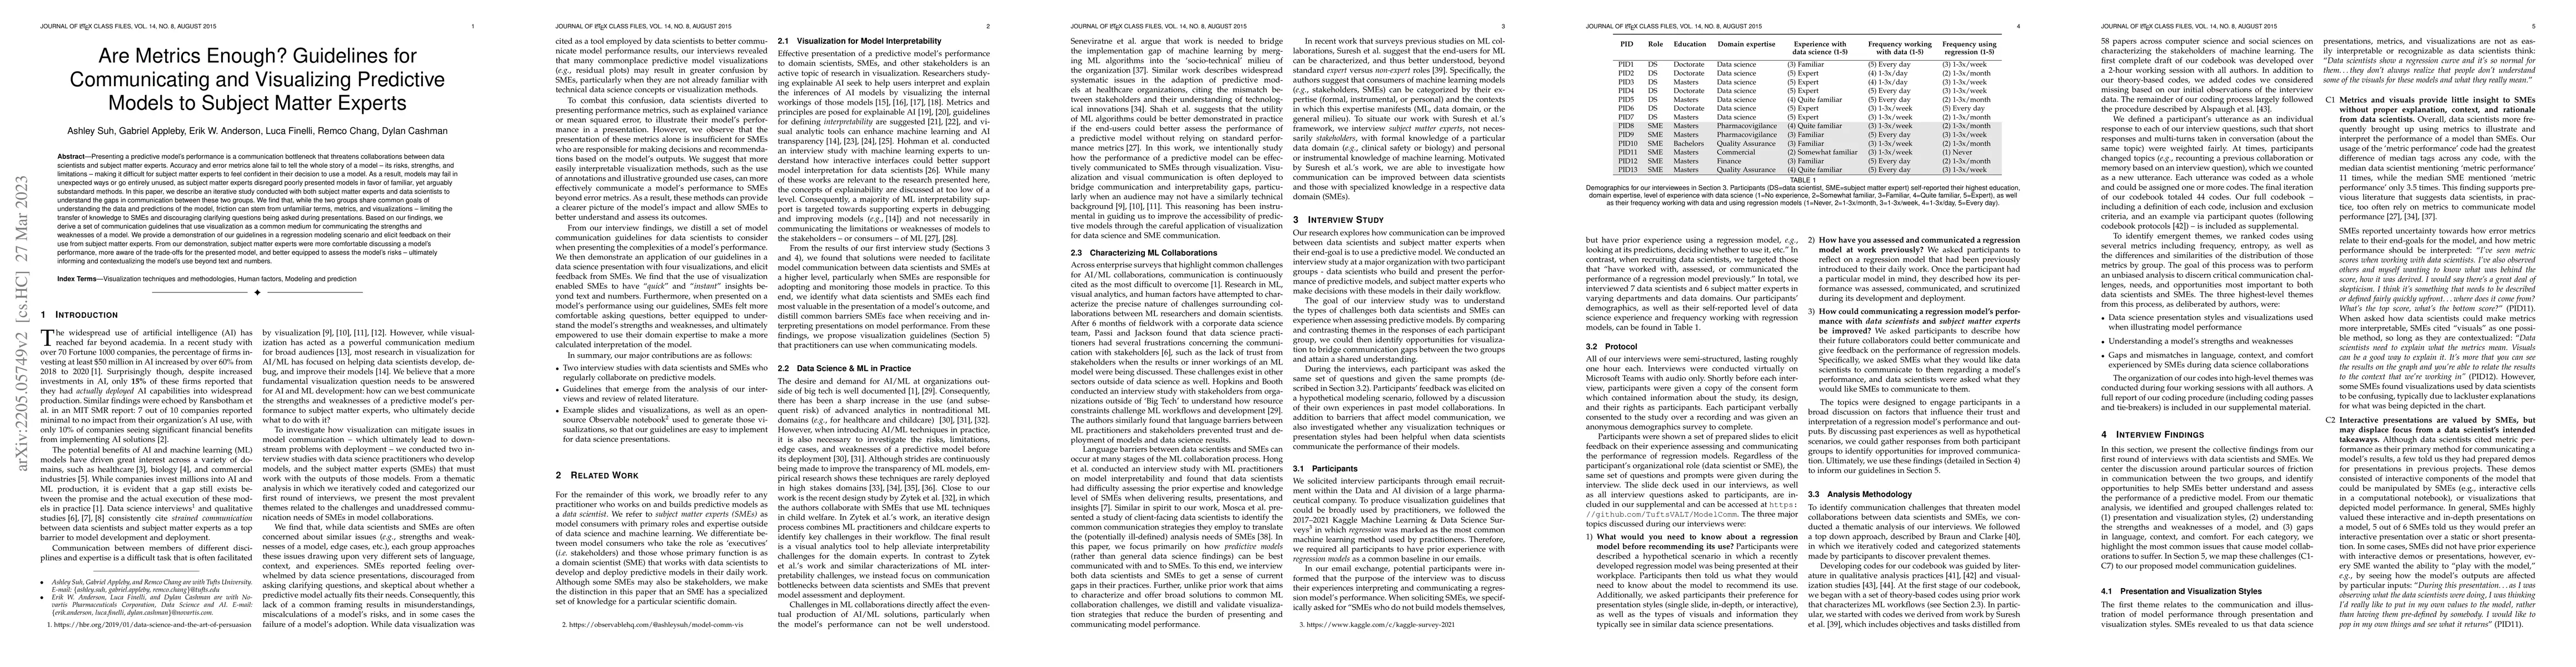
Presenting a predictive model's performance is a communication bottleneck that threatens collaborations between data scientists and subject matter experts. Accuracy and error metrics alone fail to t...
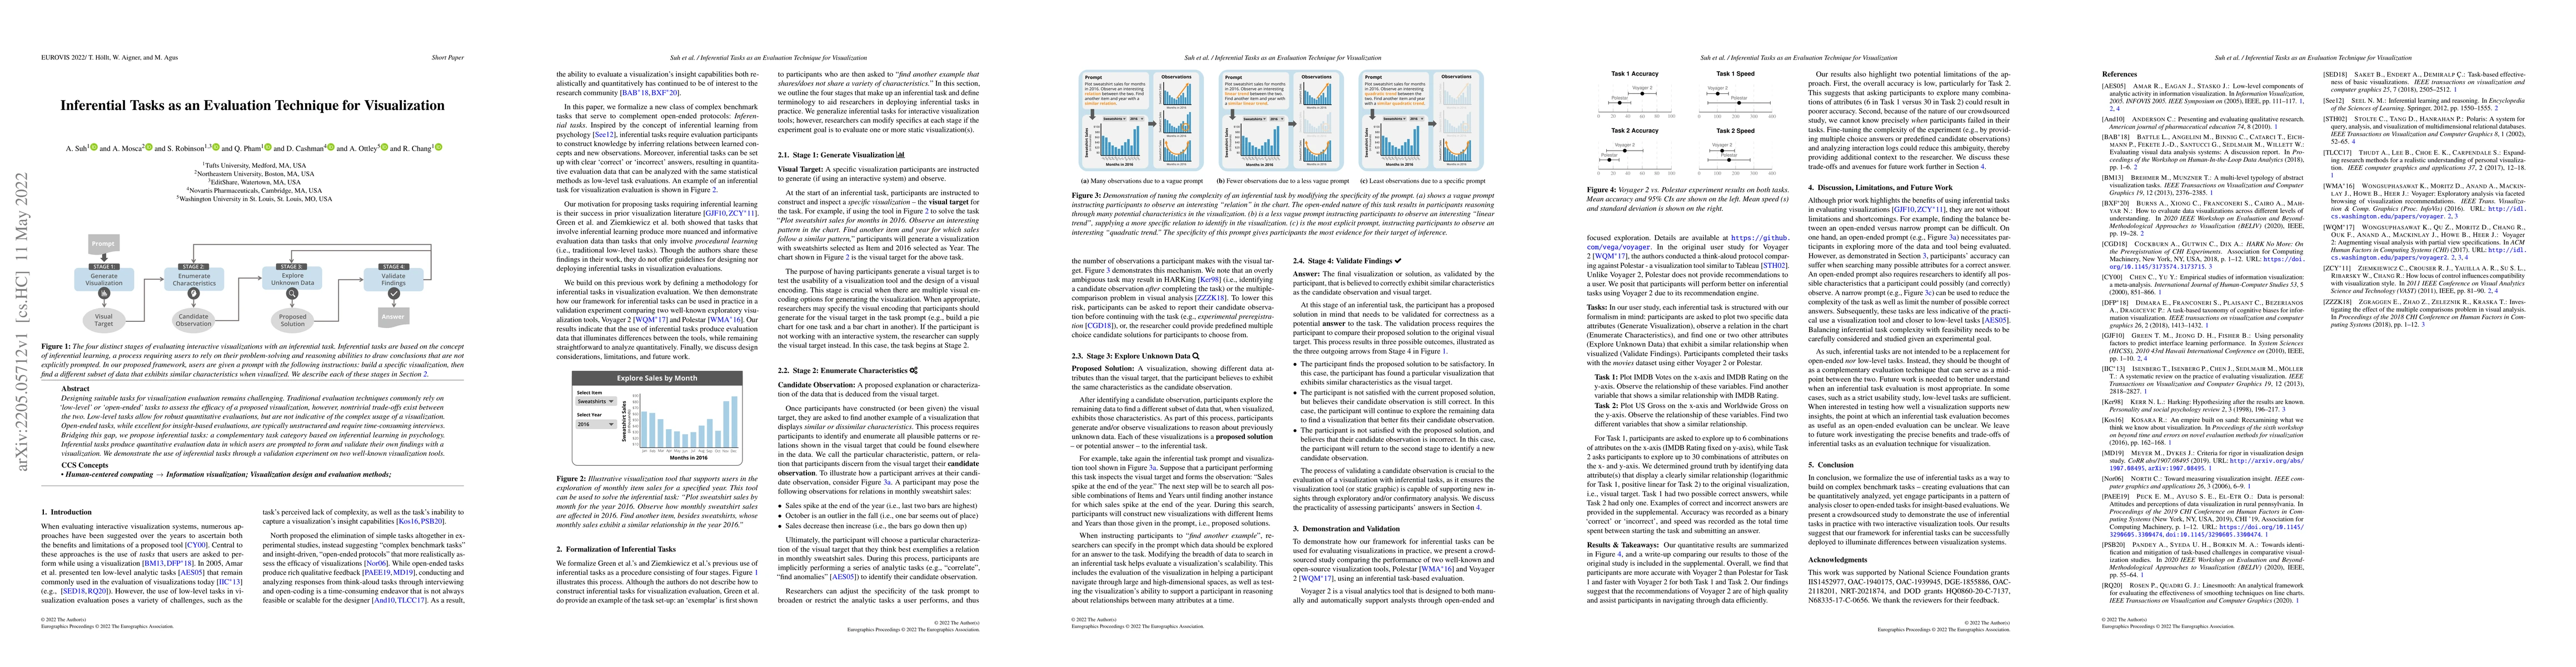
Designing suitable tasks for visualization evaluation remains challenging. Traditional evaluation techniques commonly rely on 'low-level' or 'open-ended' tasks to assess the efficacy of a proposed v...
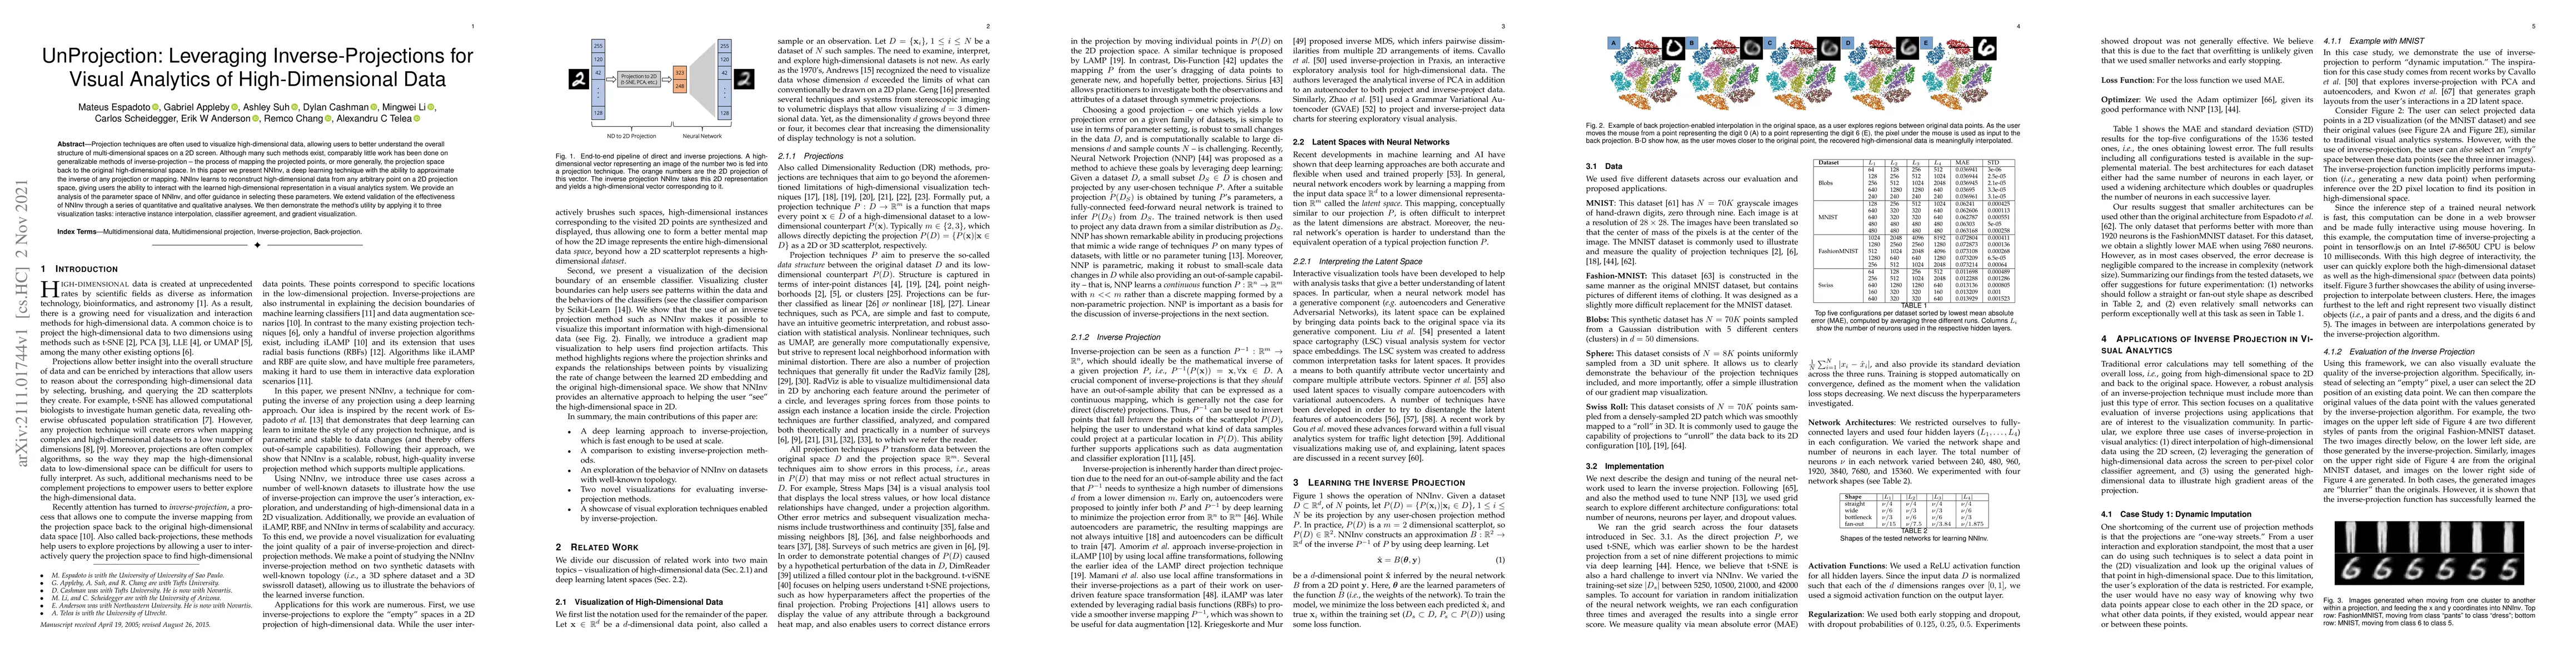
Projection techniques are often used to visualize high-dimensional data, allowing users to better understand the overall structure of multi-dimensional spaces on a 2D screen. Although many such meth...
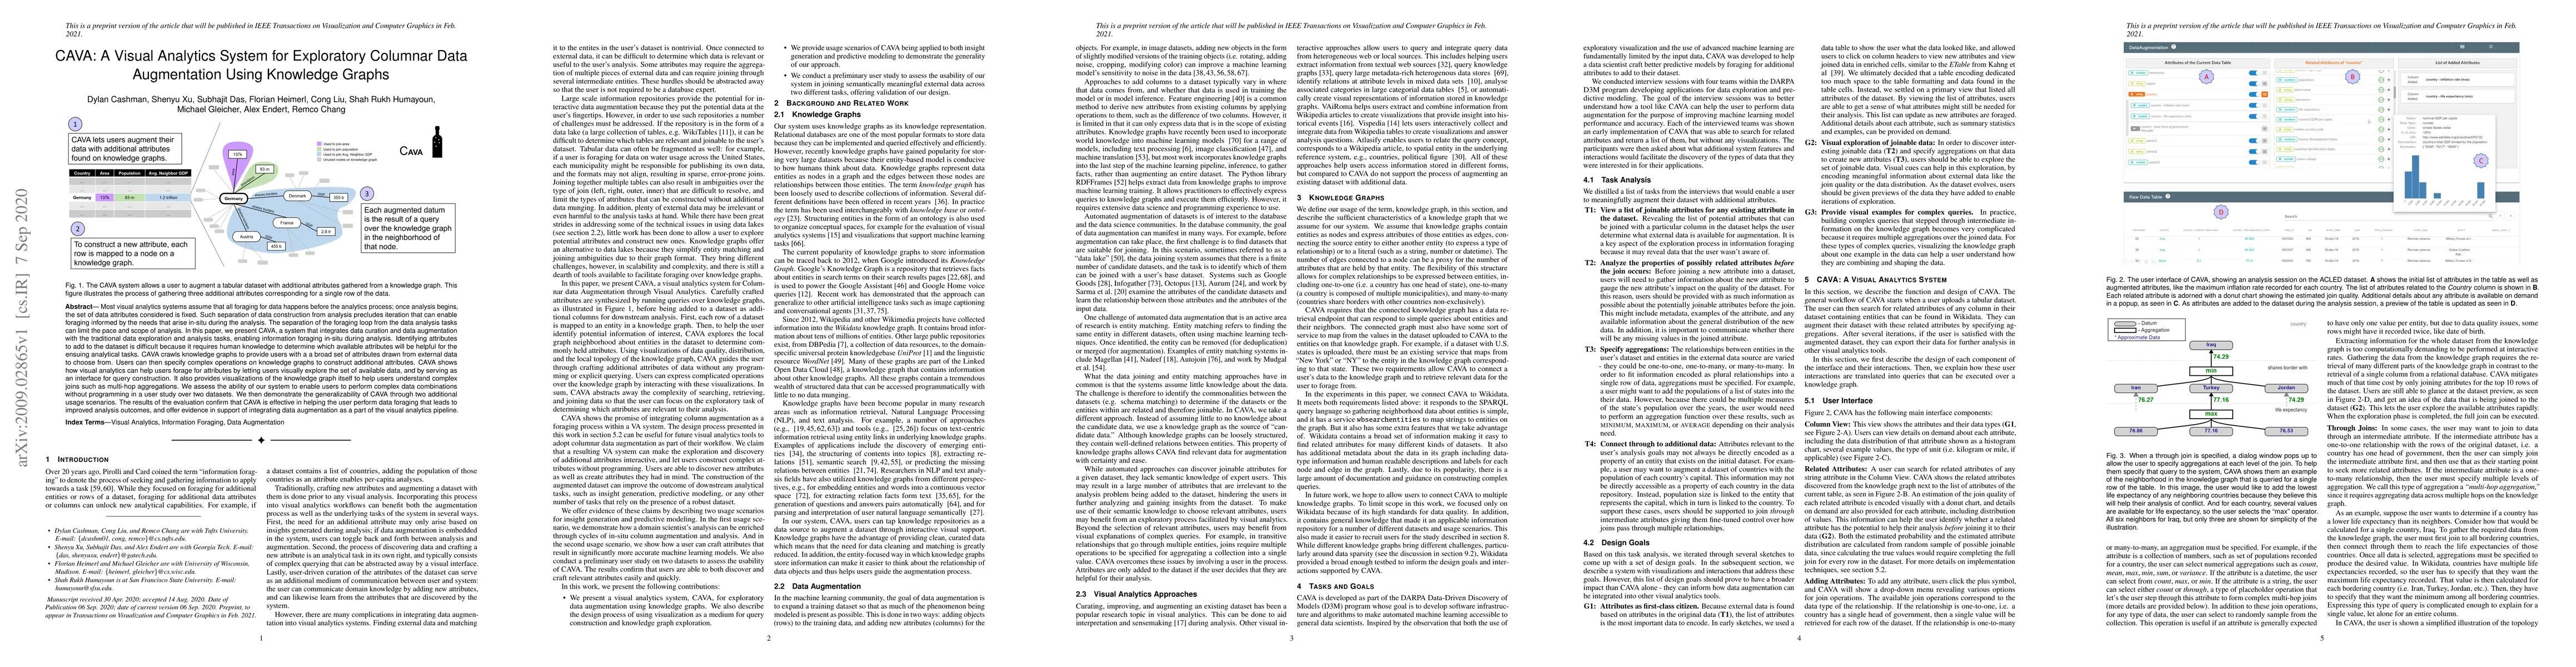
Most visual analytics systems assume that all foraging for data happens before the analytics process; once analysis begins, the set of data attributes considered is fixed. Such separation of data co...
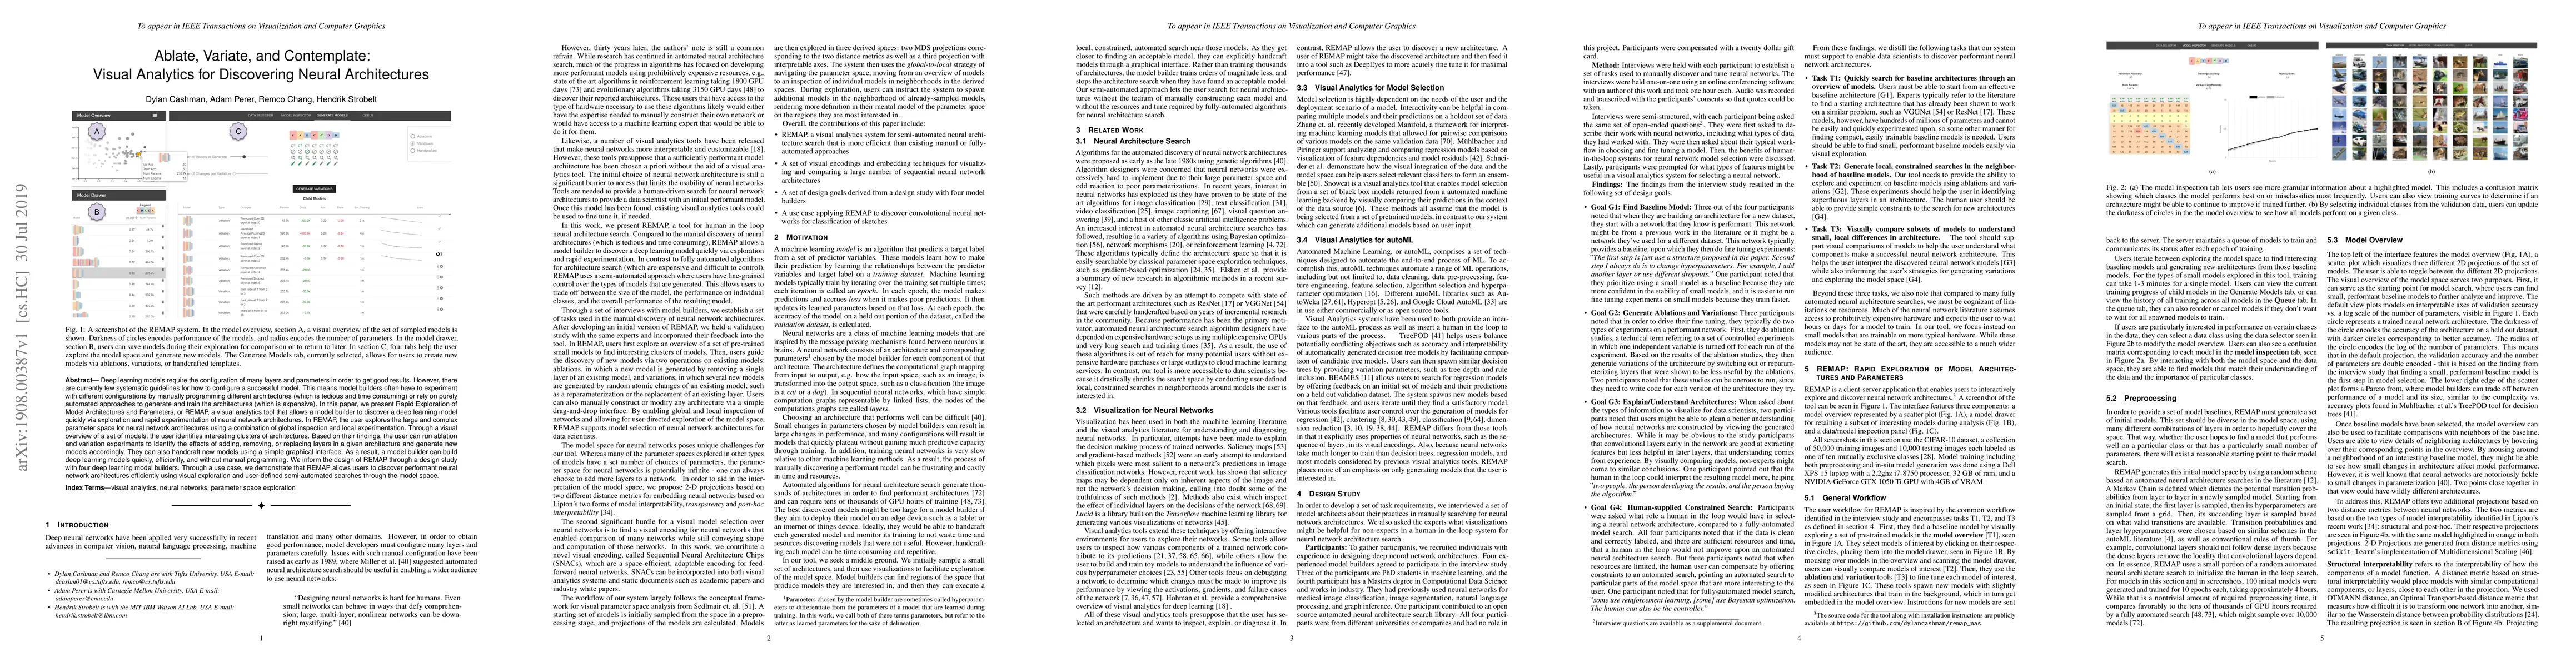
Deep learning models require the configuration of many layers and parameters in order to get good results. However, there are currently few systematic guidelines for how to configure a successful mo...
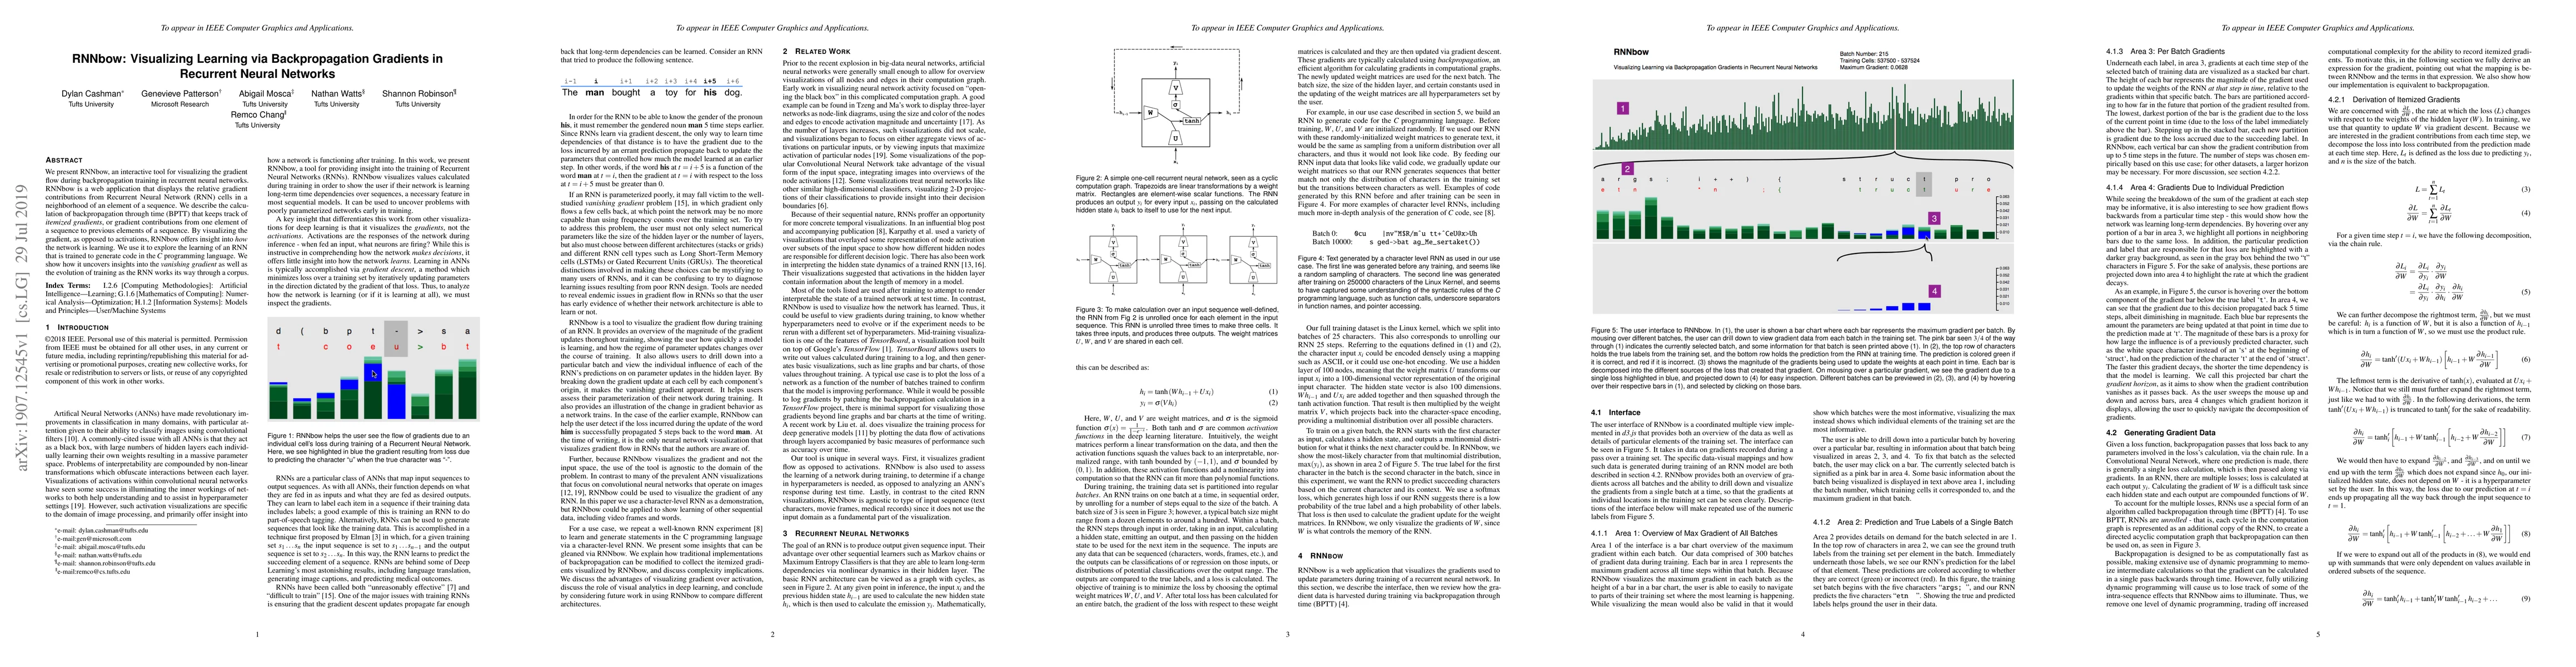
We present RNNbow, an interactive tool for visualizing the gradient flow during backpropagation training in recurrent neural networks. RNNbow is a web application that displays the relative gradient...
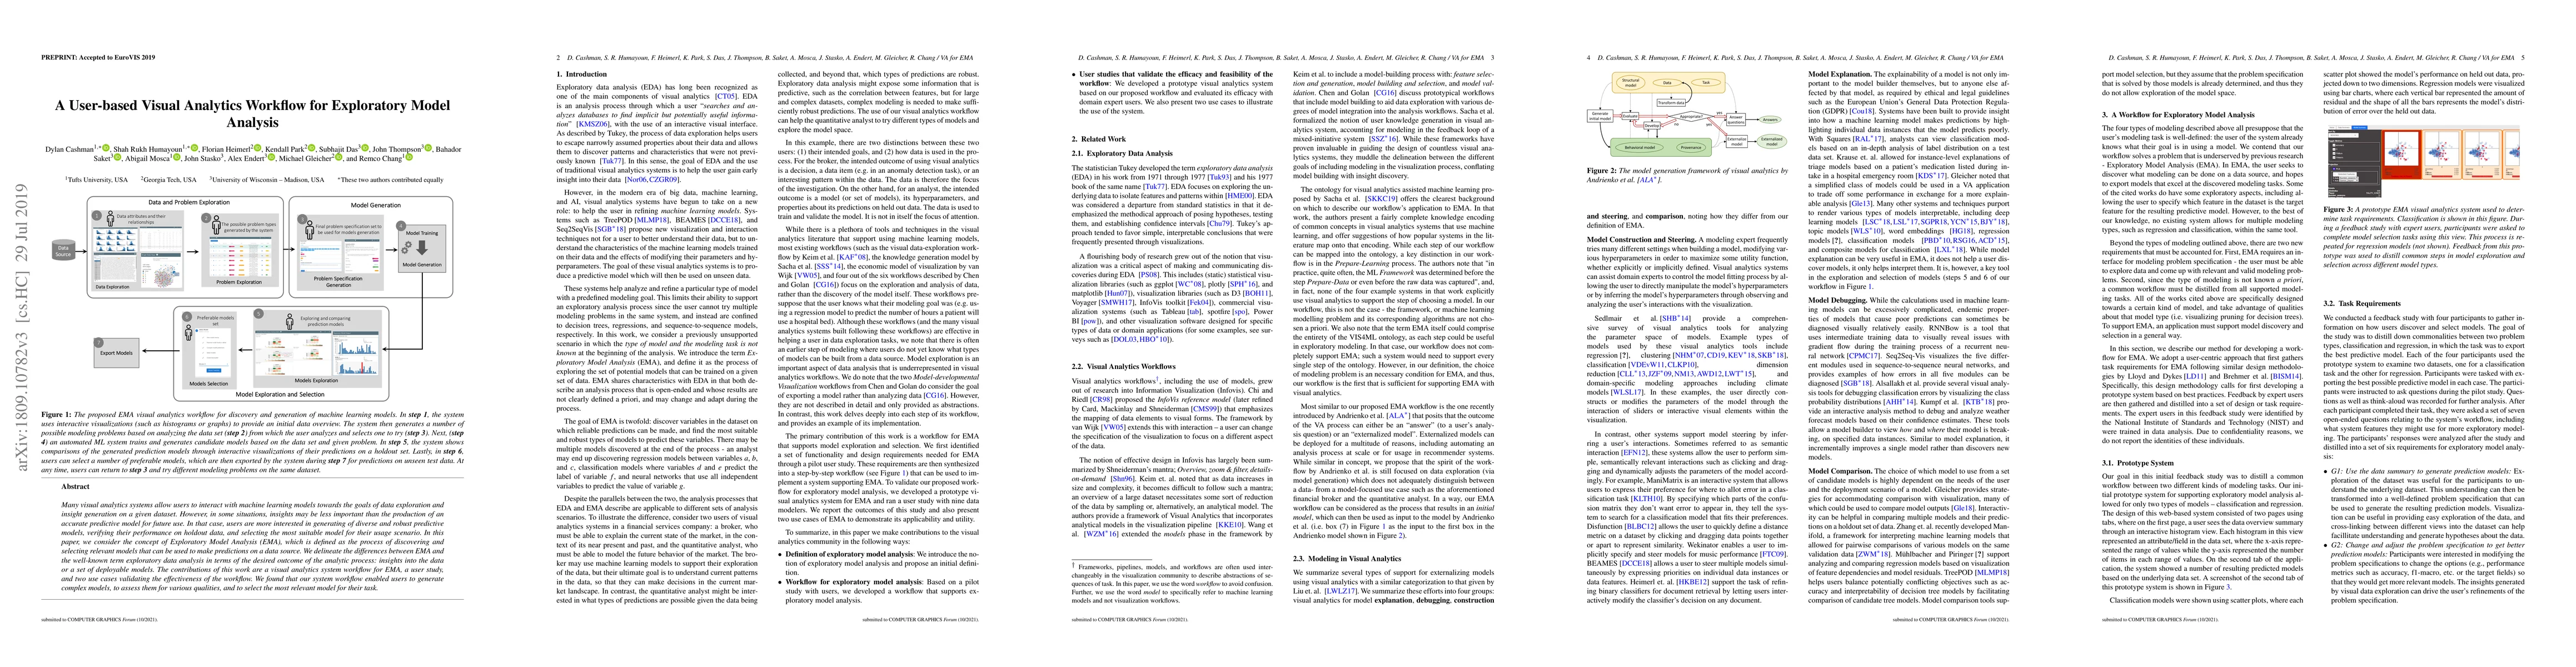
Many visual analytics systems allow users to interact with machine learning models towards the goals of data exploration and insight generation on a given dataset. However, in some situations, insig...
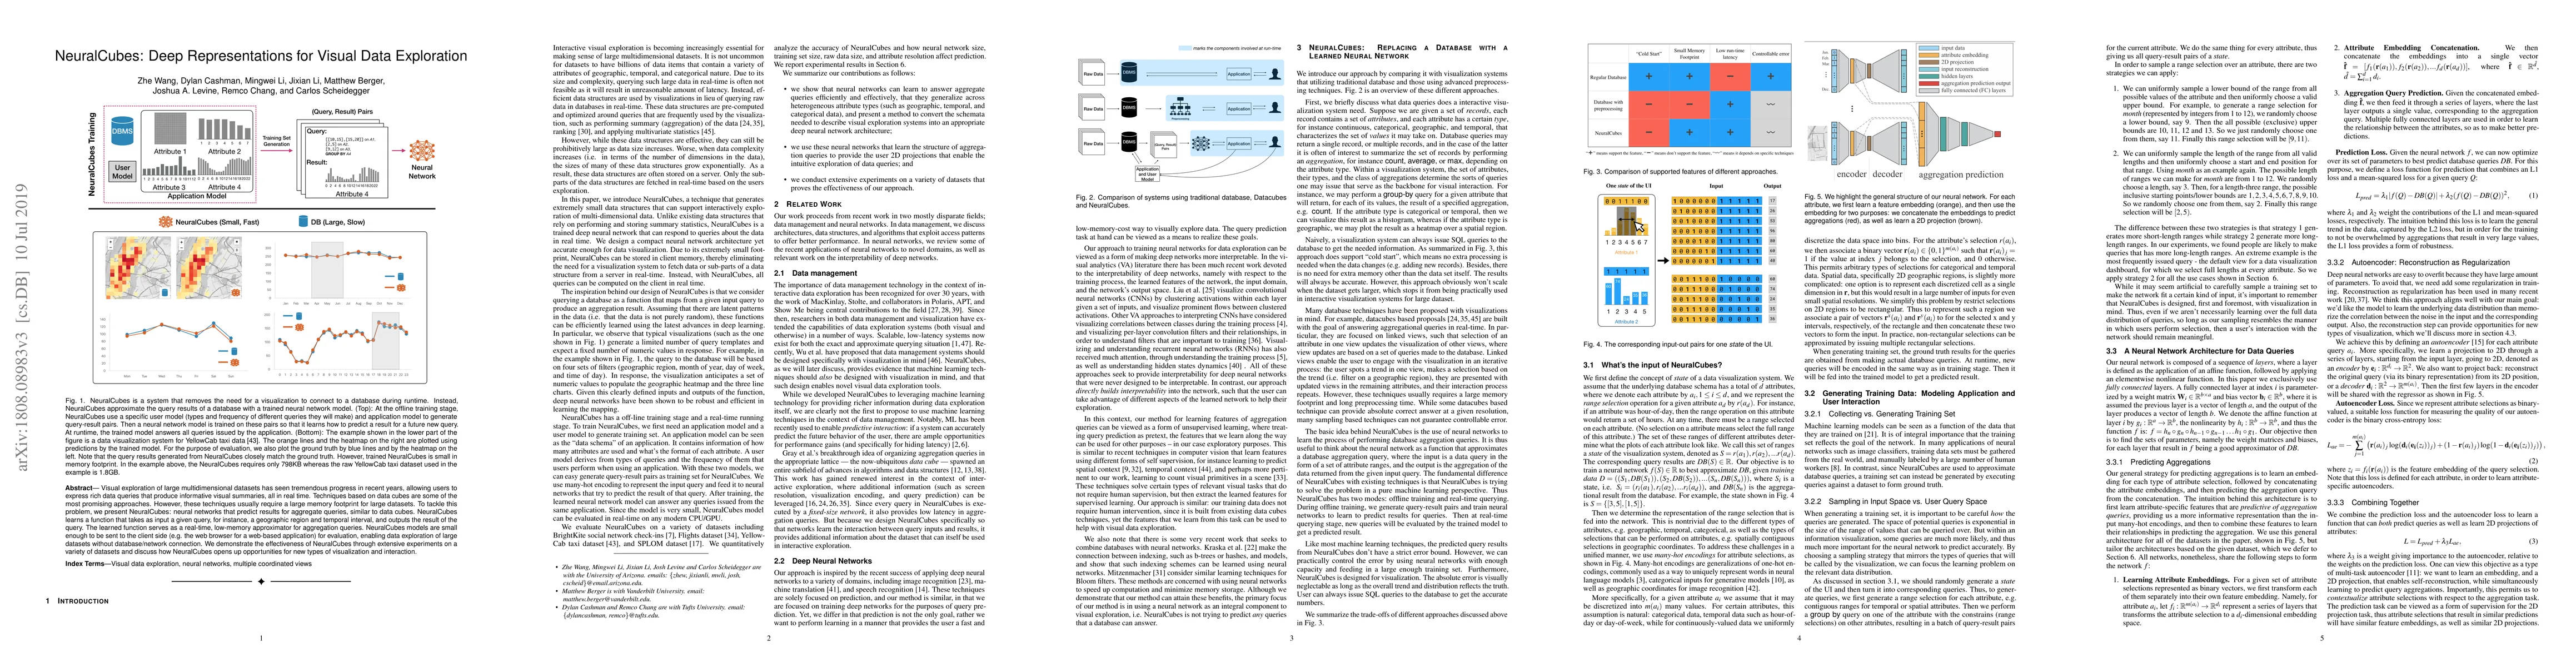
Visual exploration of large multidimensional datasets has seen tremendous progress in recent years, allowing users to express rich data queries that produce informative visual summaries, all in real...
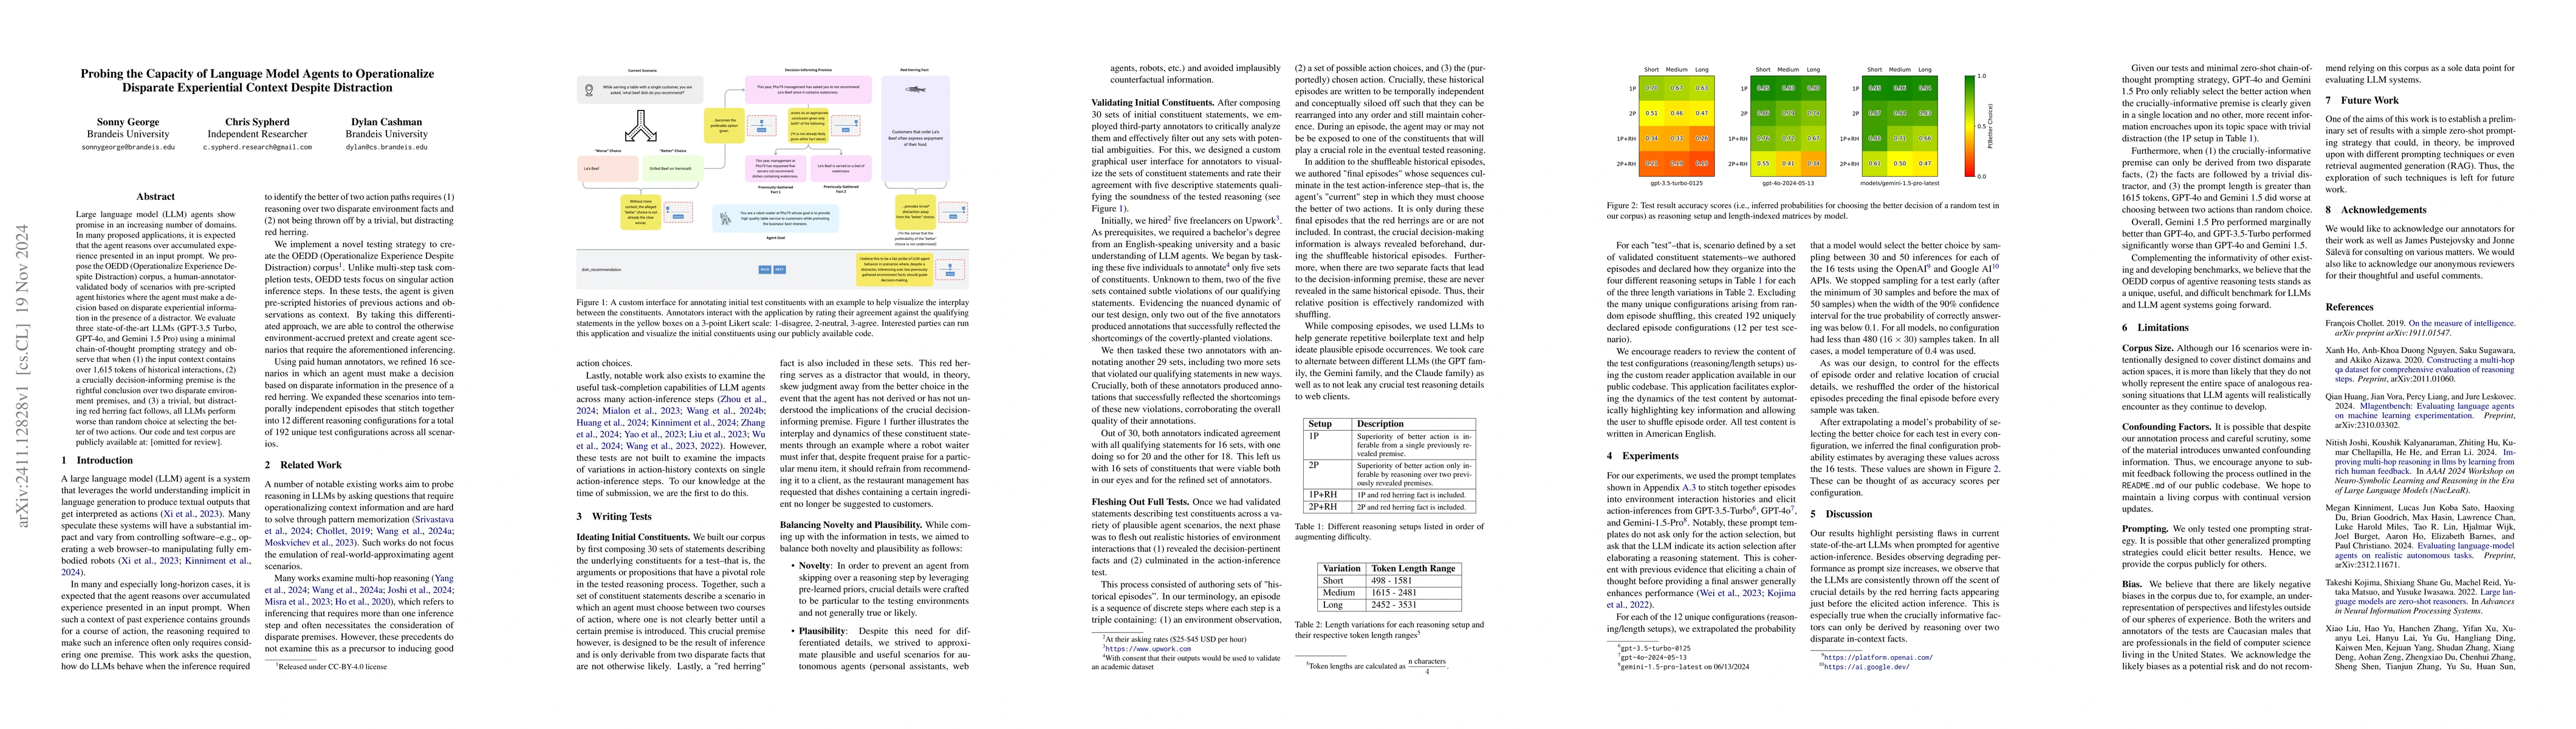
Large language model (LLM) agents show promise in an increasing number of domains. In many proposed applications, it is expected that the agent reasons over accumulated experience presented in an inpu...
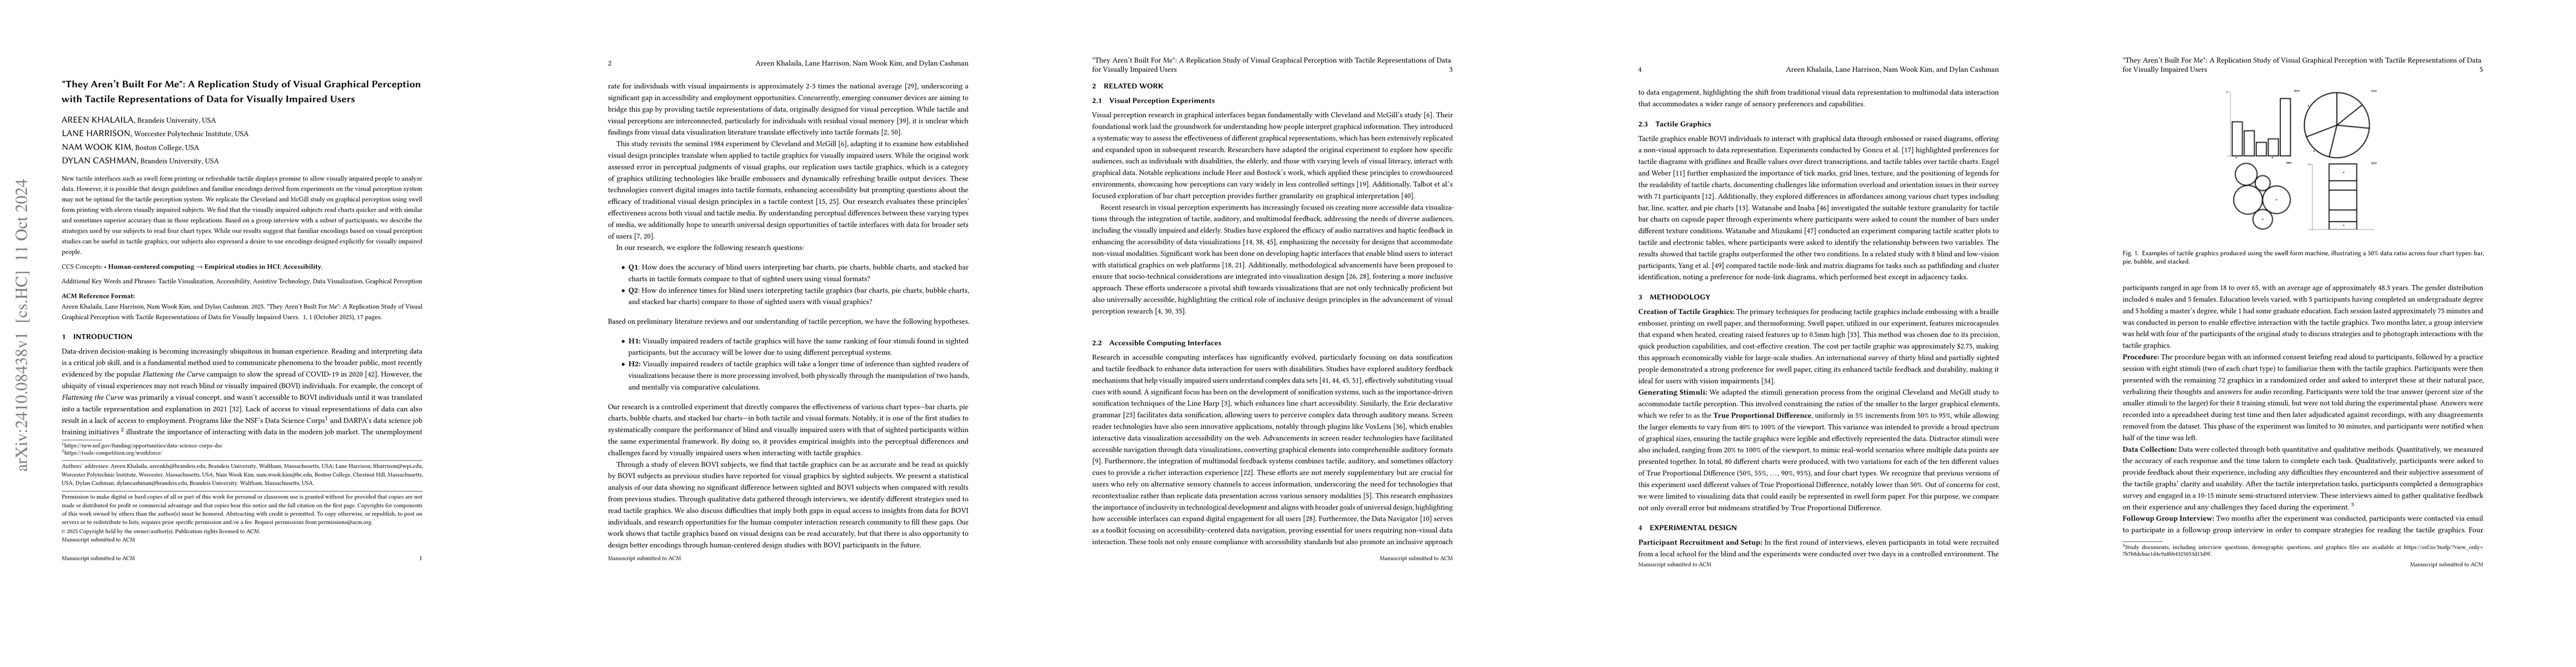
New tactile interfaces such as swell form printing or refreshable tactile displays promise to allow visually impaired people to analyze data. However, it is possible that design guidelines and familia...
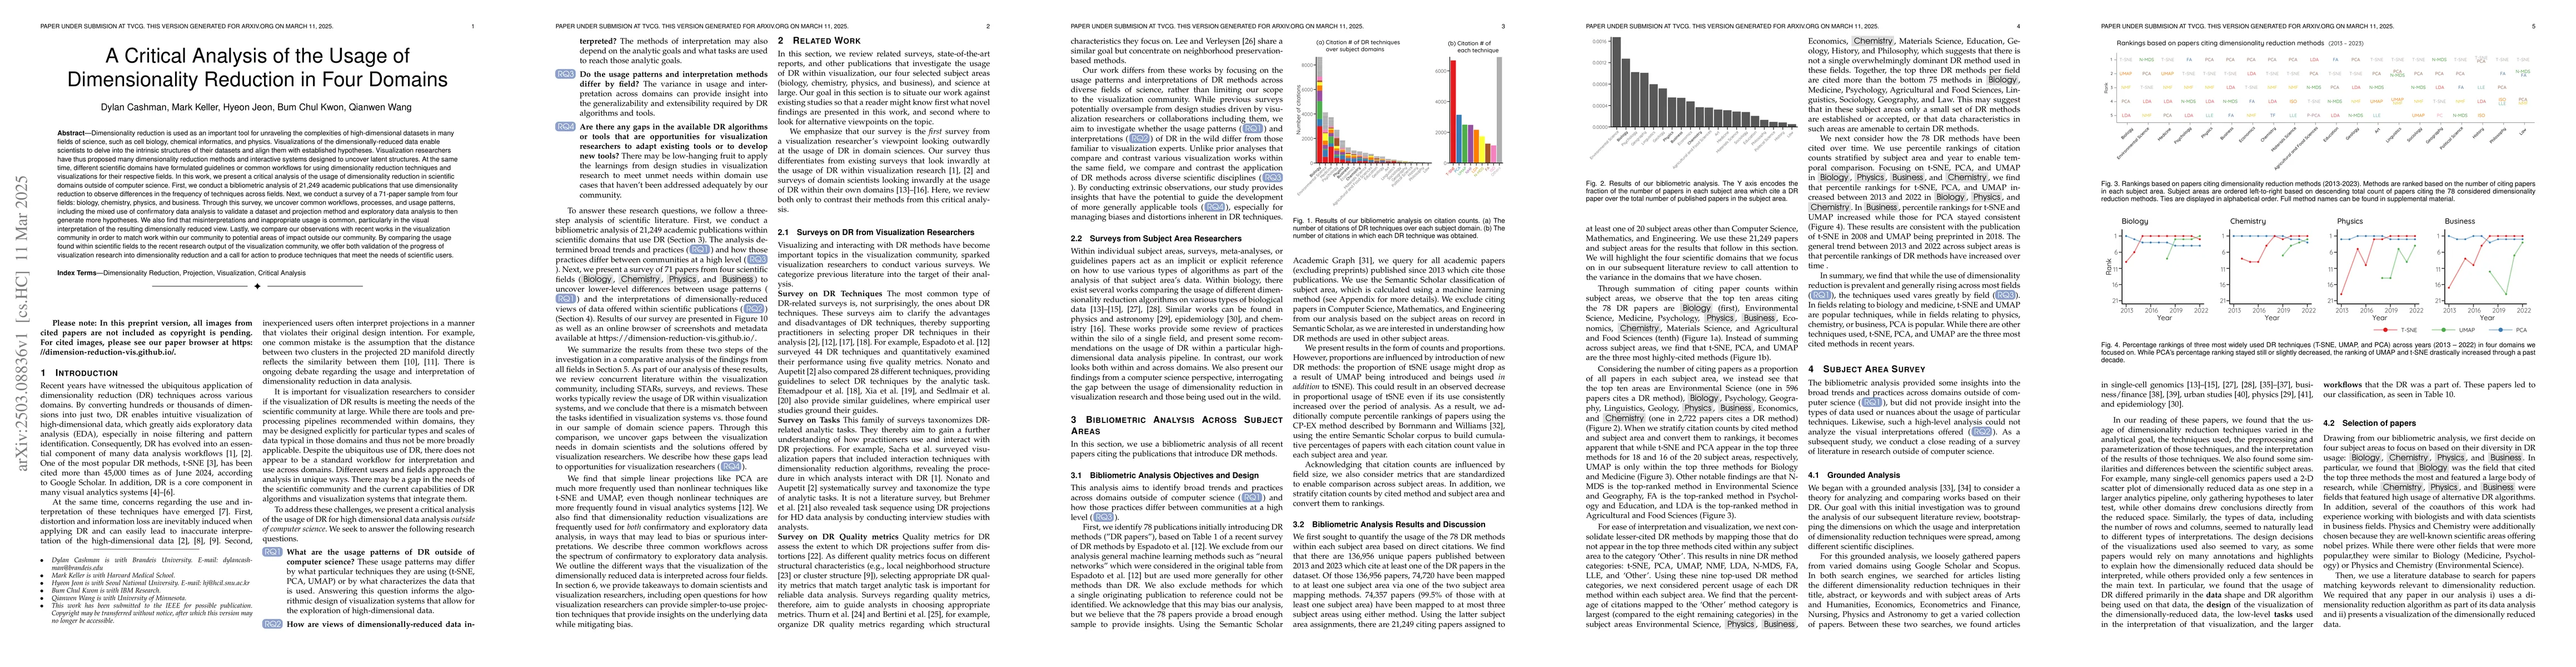
Dimensionality reduction is used as an important tool for unraveling the complexities of high-dimensional datasets in many fields of science, such as cell biology, chemical informatics, and physics. V...
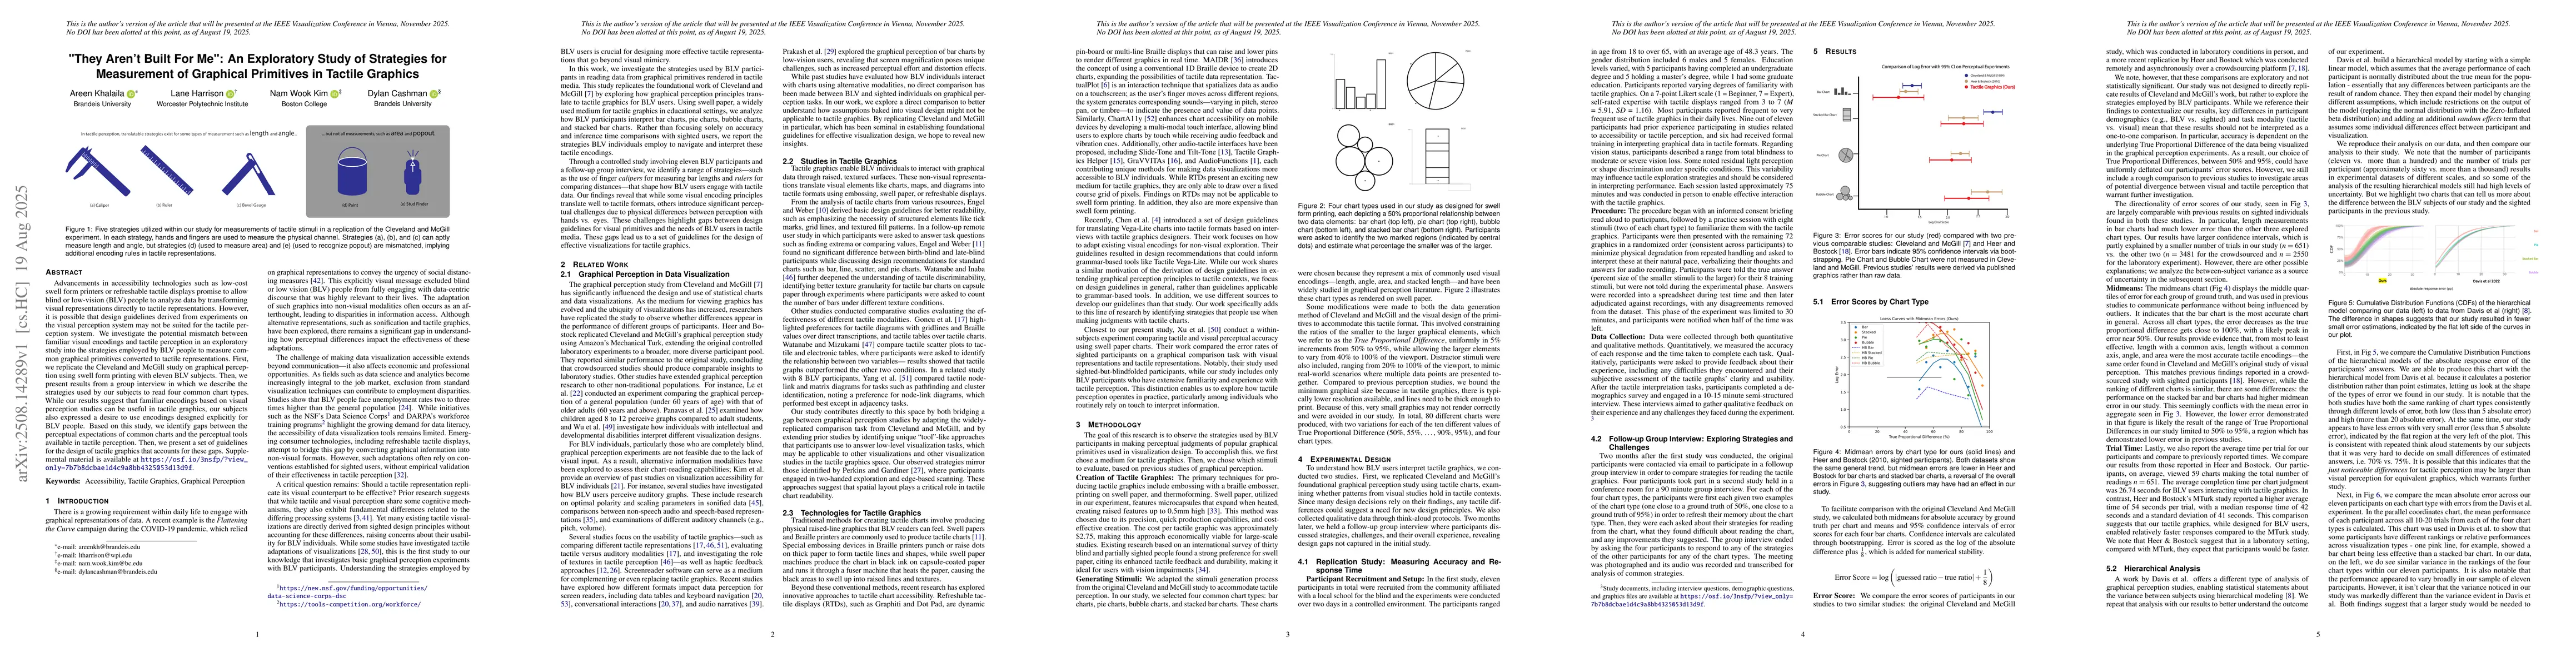
Advancements in accessibility technologies such as low-cost swell form printers or refreshable tactile displays promise to allow blind or low-vision (BLV) people to analyze data by transforming visual...
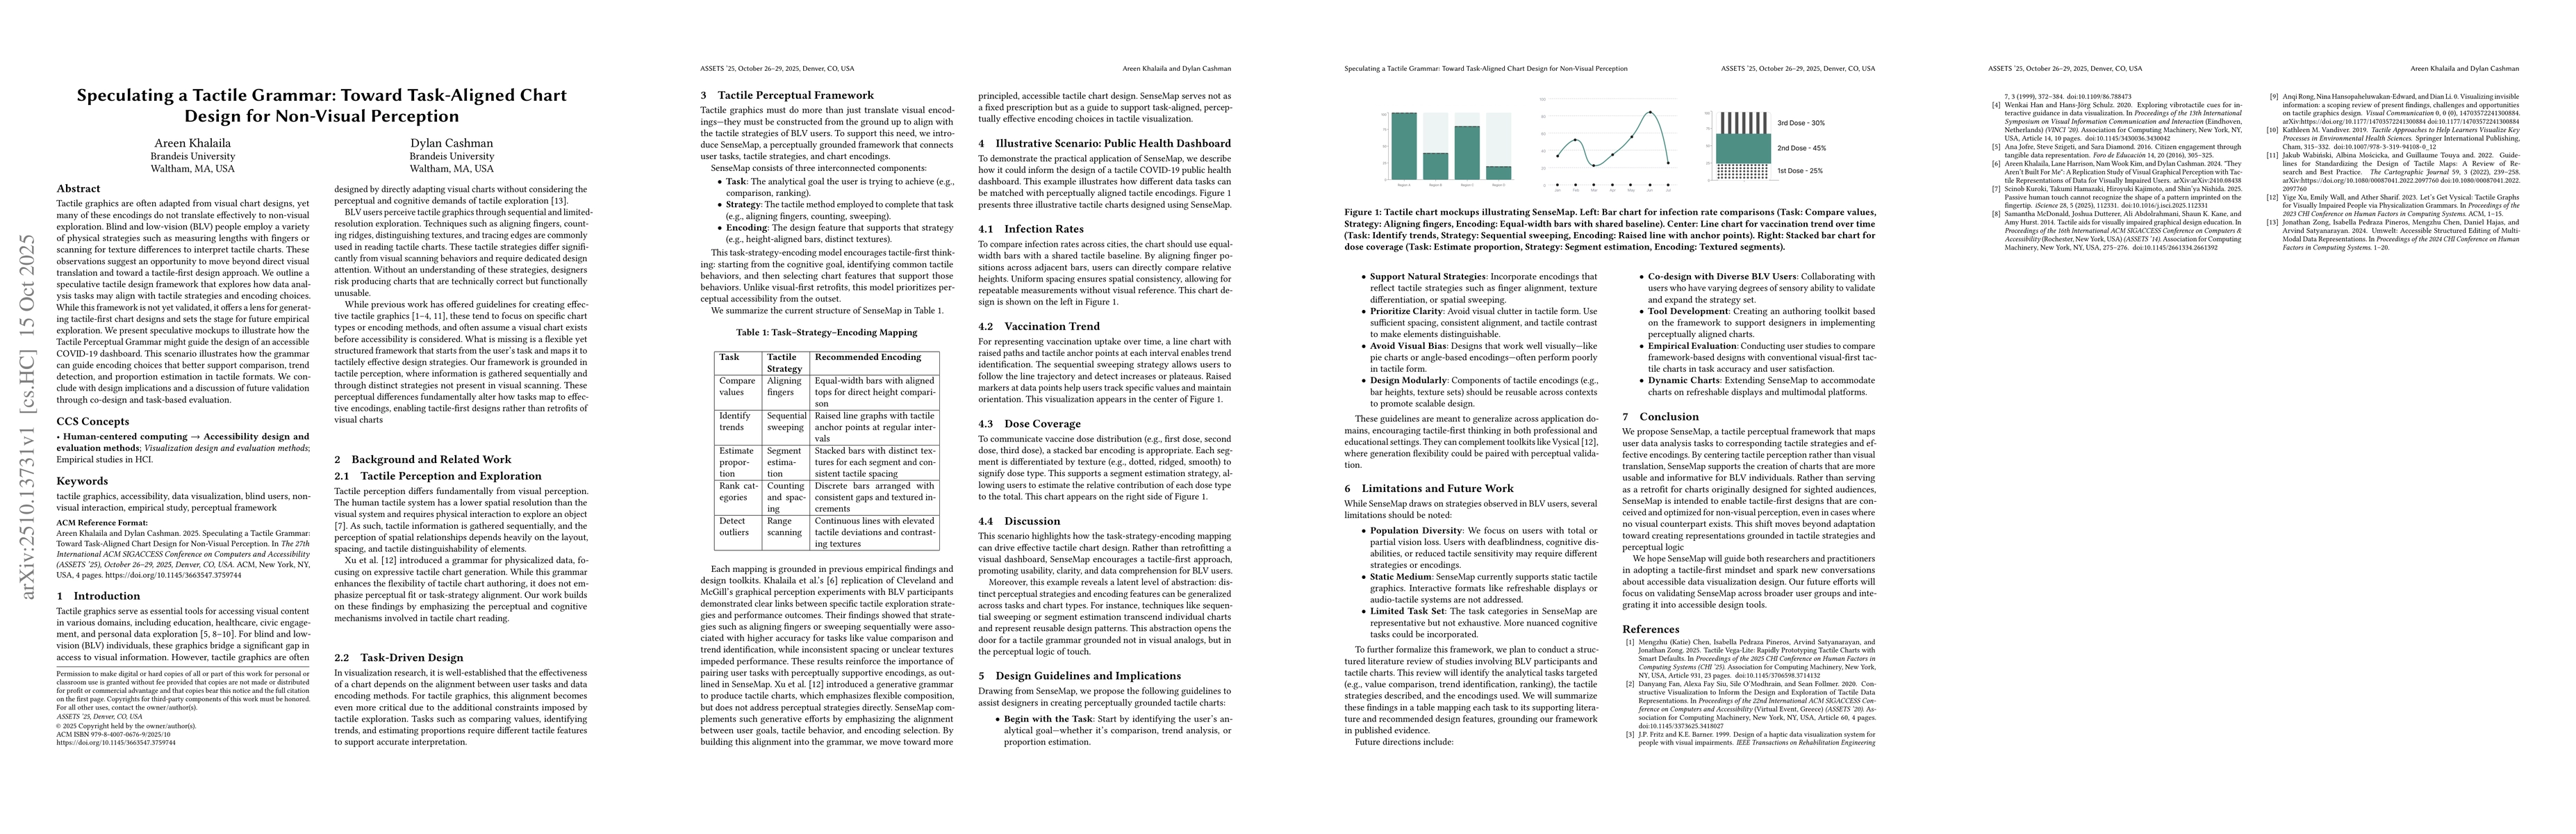
Tactile graphics are often adapted from visual chart designs, yet many of these encodings do not translate effectively to non-visual exploration. Blind and low-vision (BLV) people employ a variety of ...
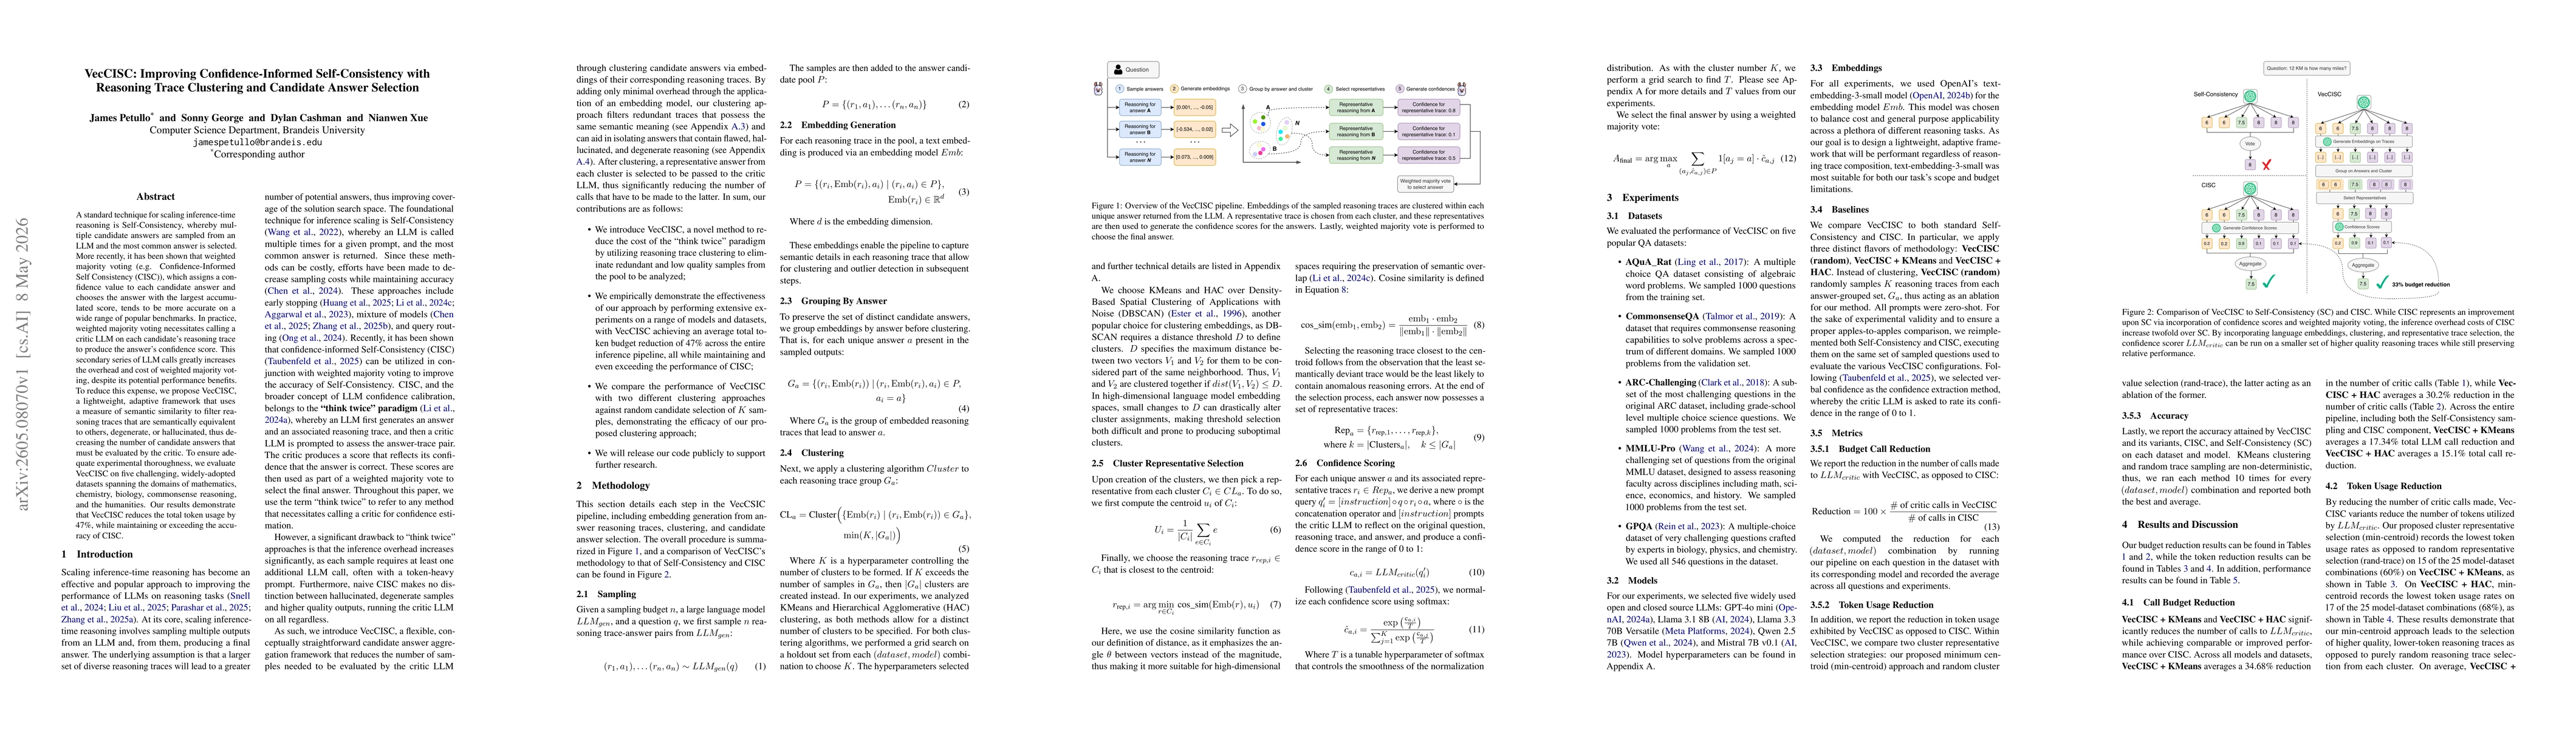
A standard technique for scaling inference-time reasoning is Self-Consistency, whereby multiple candidate answers are sampled from an LLM and the most common answer is selected. More recently, it has ...