Academic Profile
Statistics
Similar Authors
Papers on arXiv
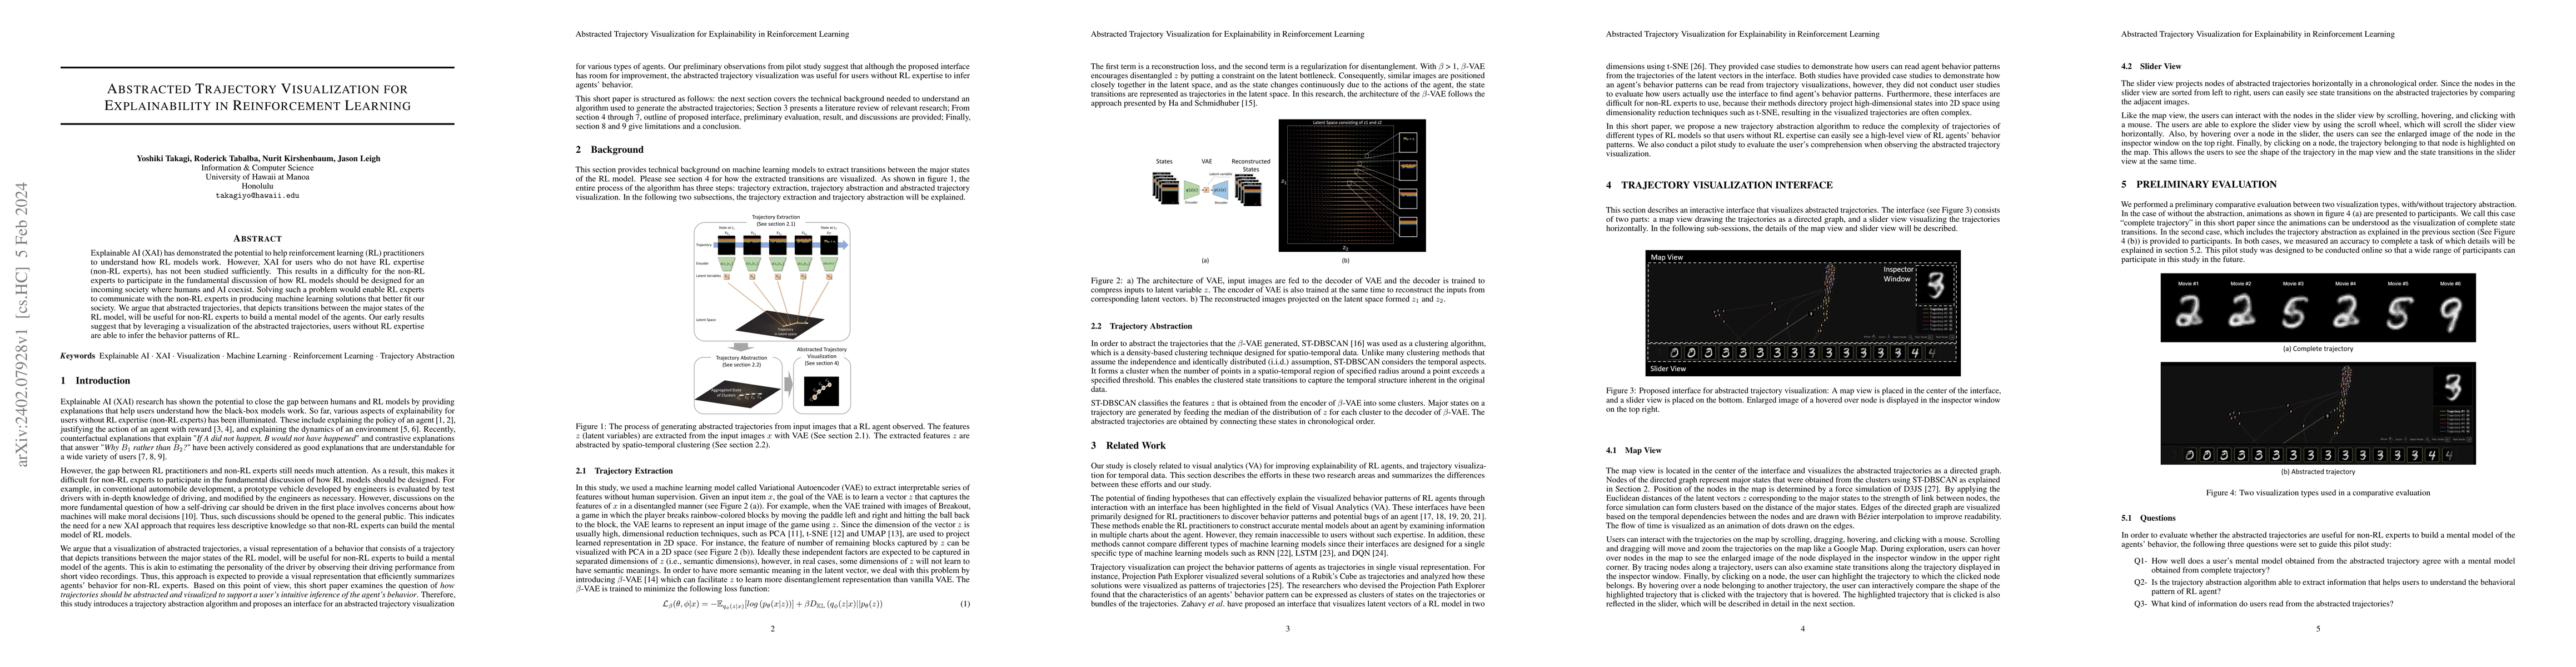
Explainable AI (XAI) has demonstrated the potential to help reinforcement learning (RL) practitioners to understand how RL models work. However, XAI for users who do not have RL expertise (non-RL ex...
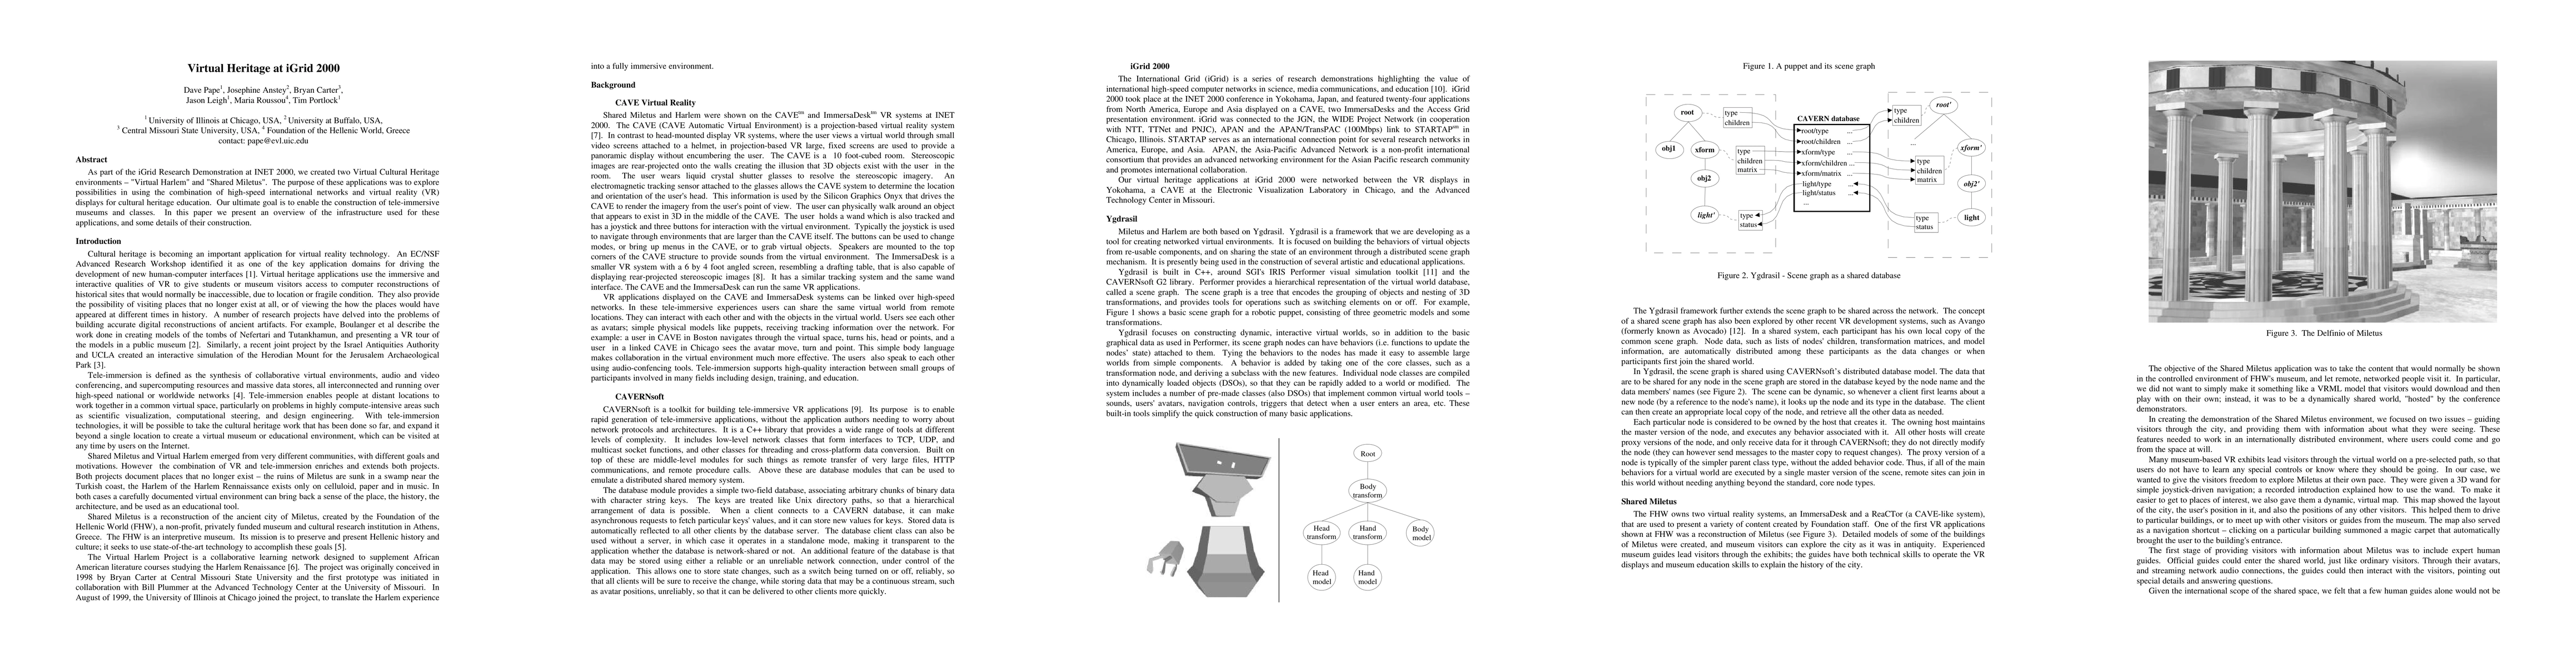
As part of the iGrid Research Demonstration at INET 2000, we created two Virtual Cultural Heritage environments - "Virtual Harlem" and "Shared Miletus". The purpose of these applications was to expl...
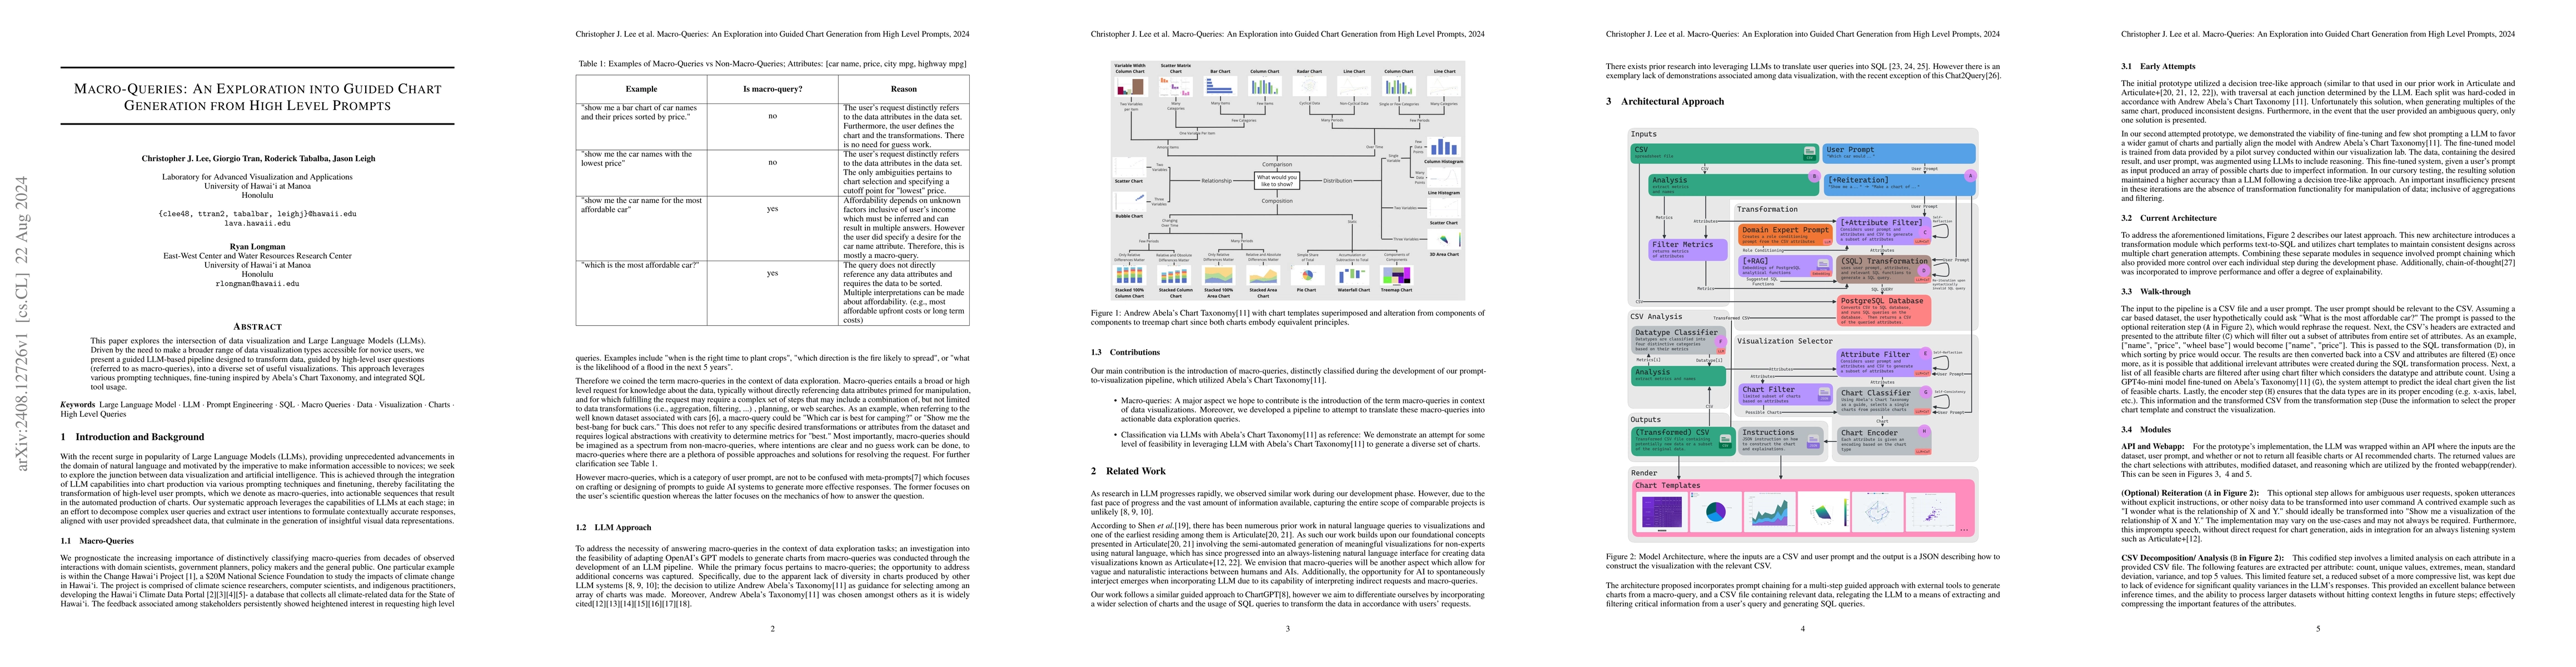
This paper explores the intersection of data visualization and Large Language Models (LLMs). Driven by the need to make a broader range of data visualization types accessible for novice users, we pres...
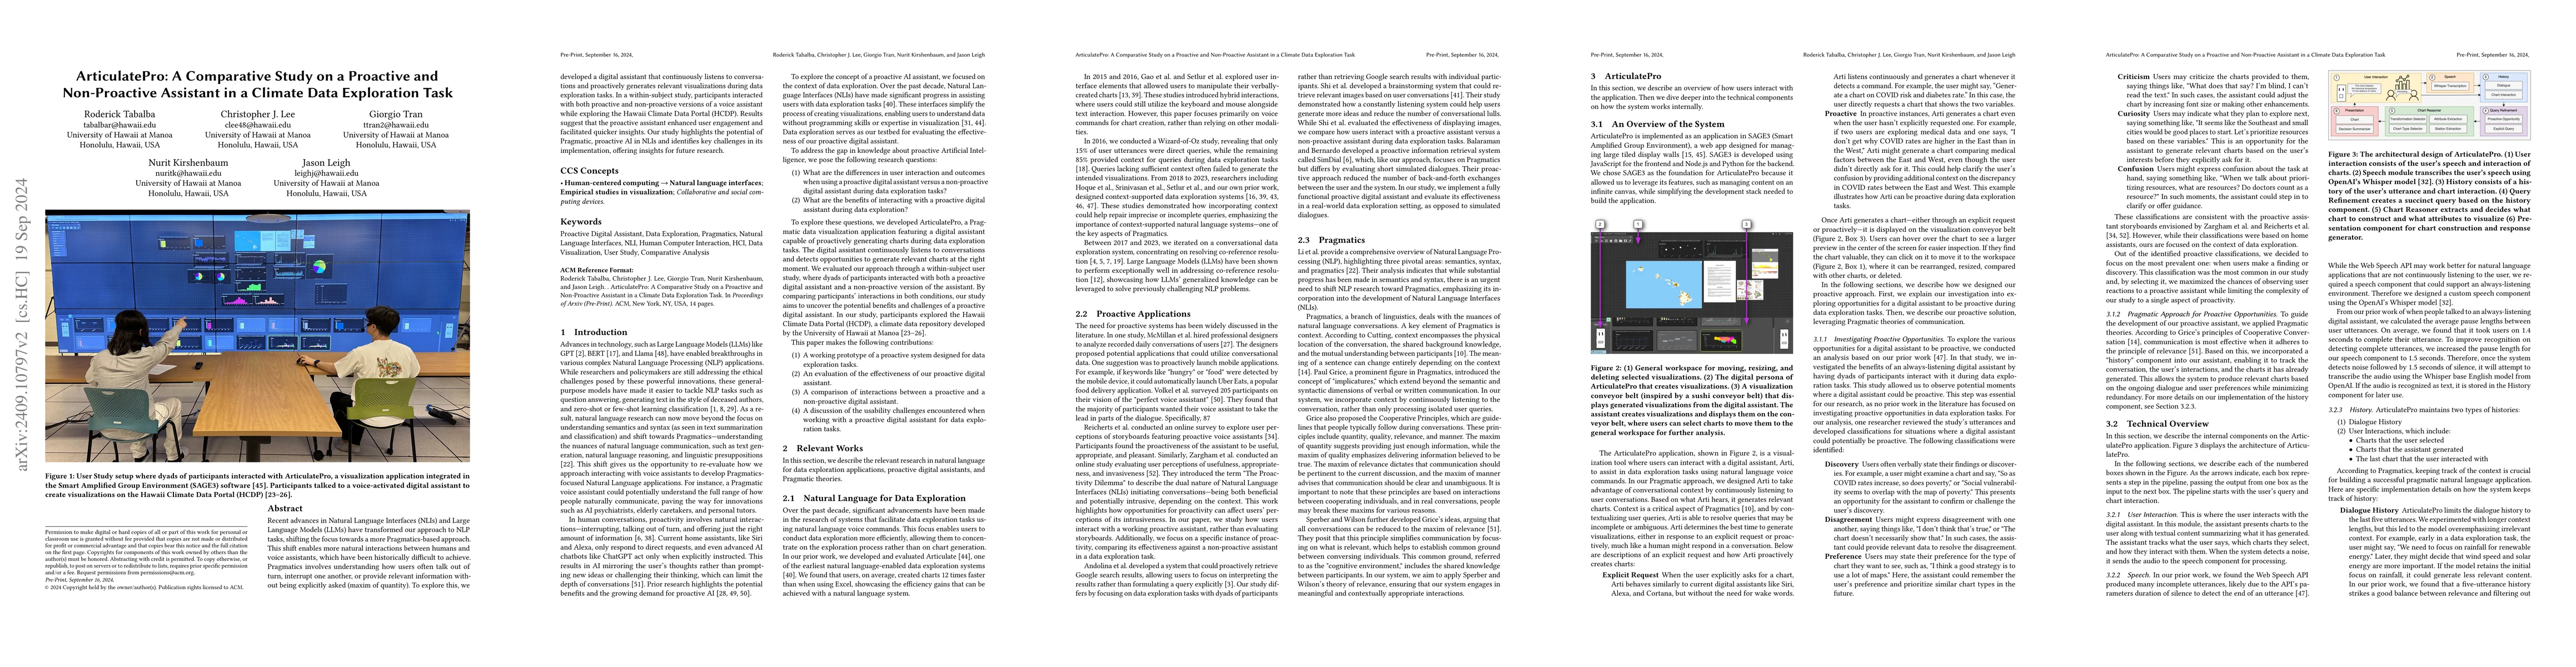
Recent advances in Natural Language Interfaces (NLIs) and Large Language Models (LLMs) have transformed our approach to NLP tasks, shifting the focus towards a more Pragmatics-based approach. This shi...
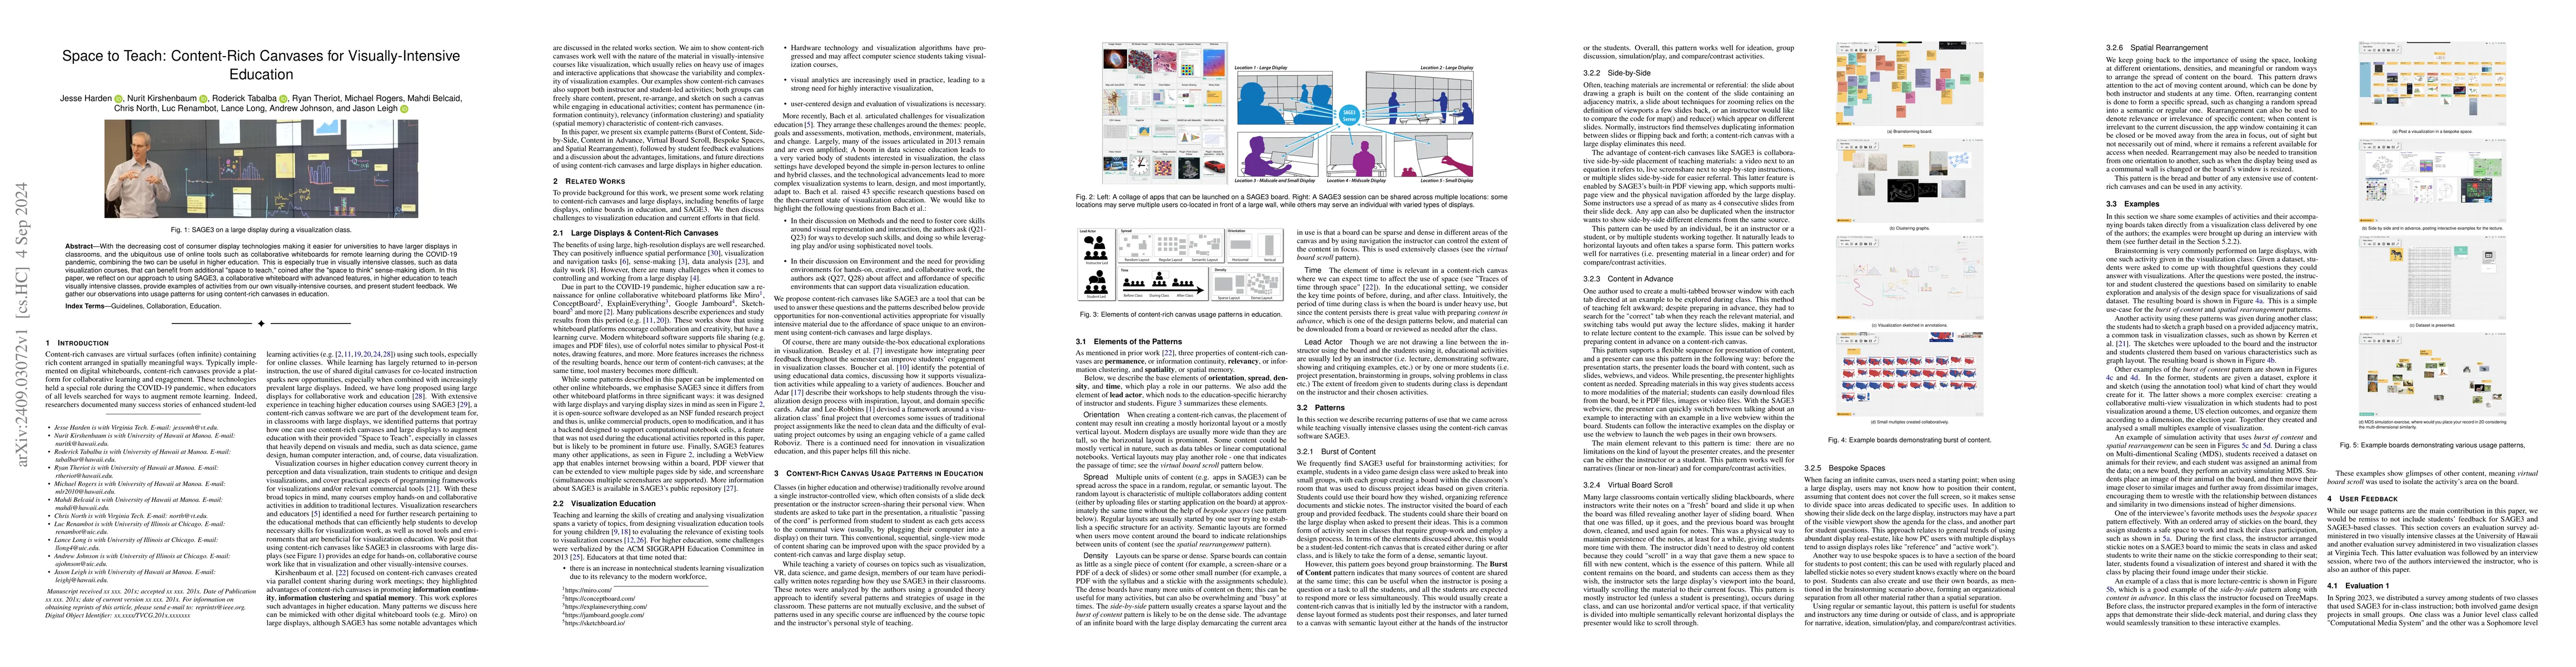
With the decreasing cost of consumer display technologies making it easier for universities to have larger displays in classrooms, and the ubiquitous use of online tools such as collaborative whiteboa...
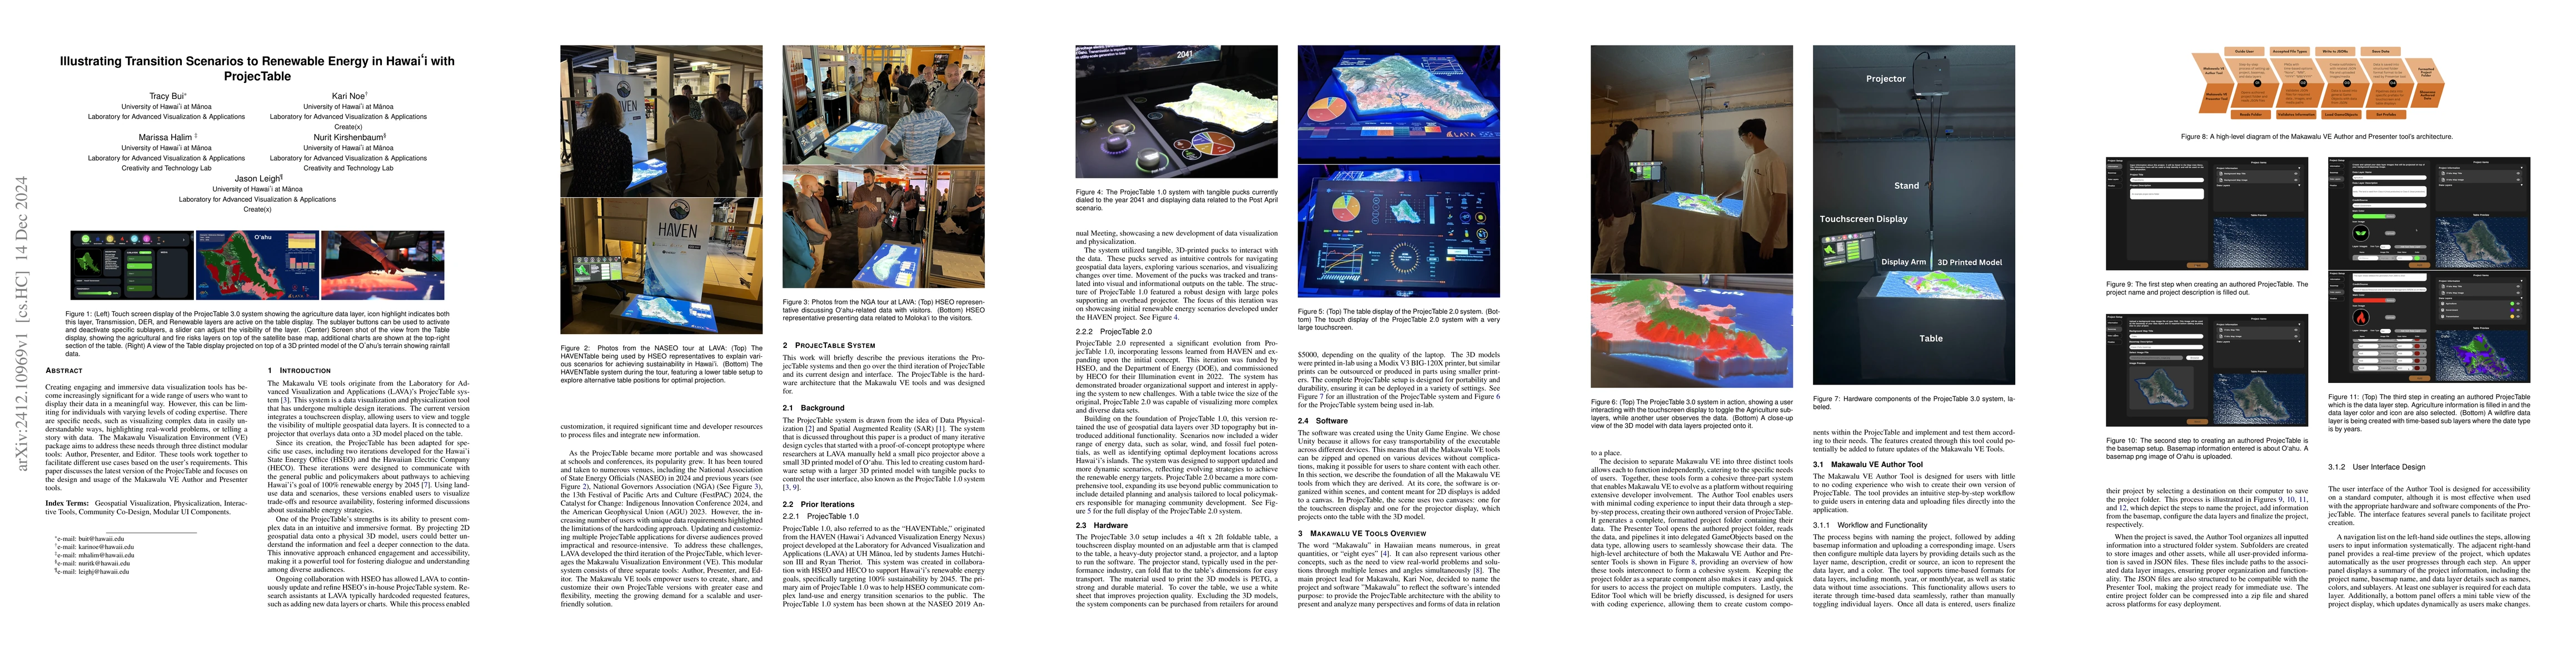
Creating engaging and immersive data visualization tools has become increasingly significant for a wide range of users who want to display their data in a meaningful way. However, this can be limiting...
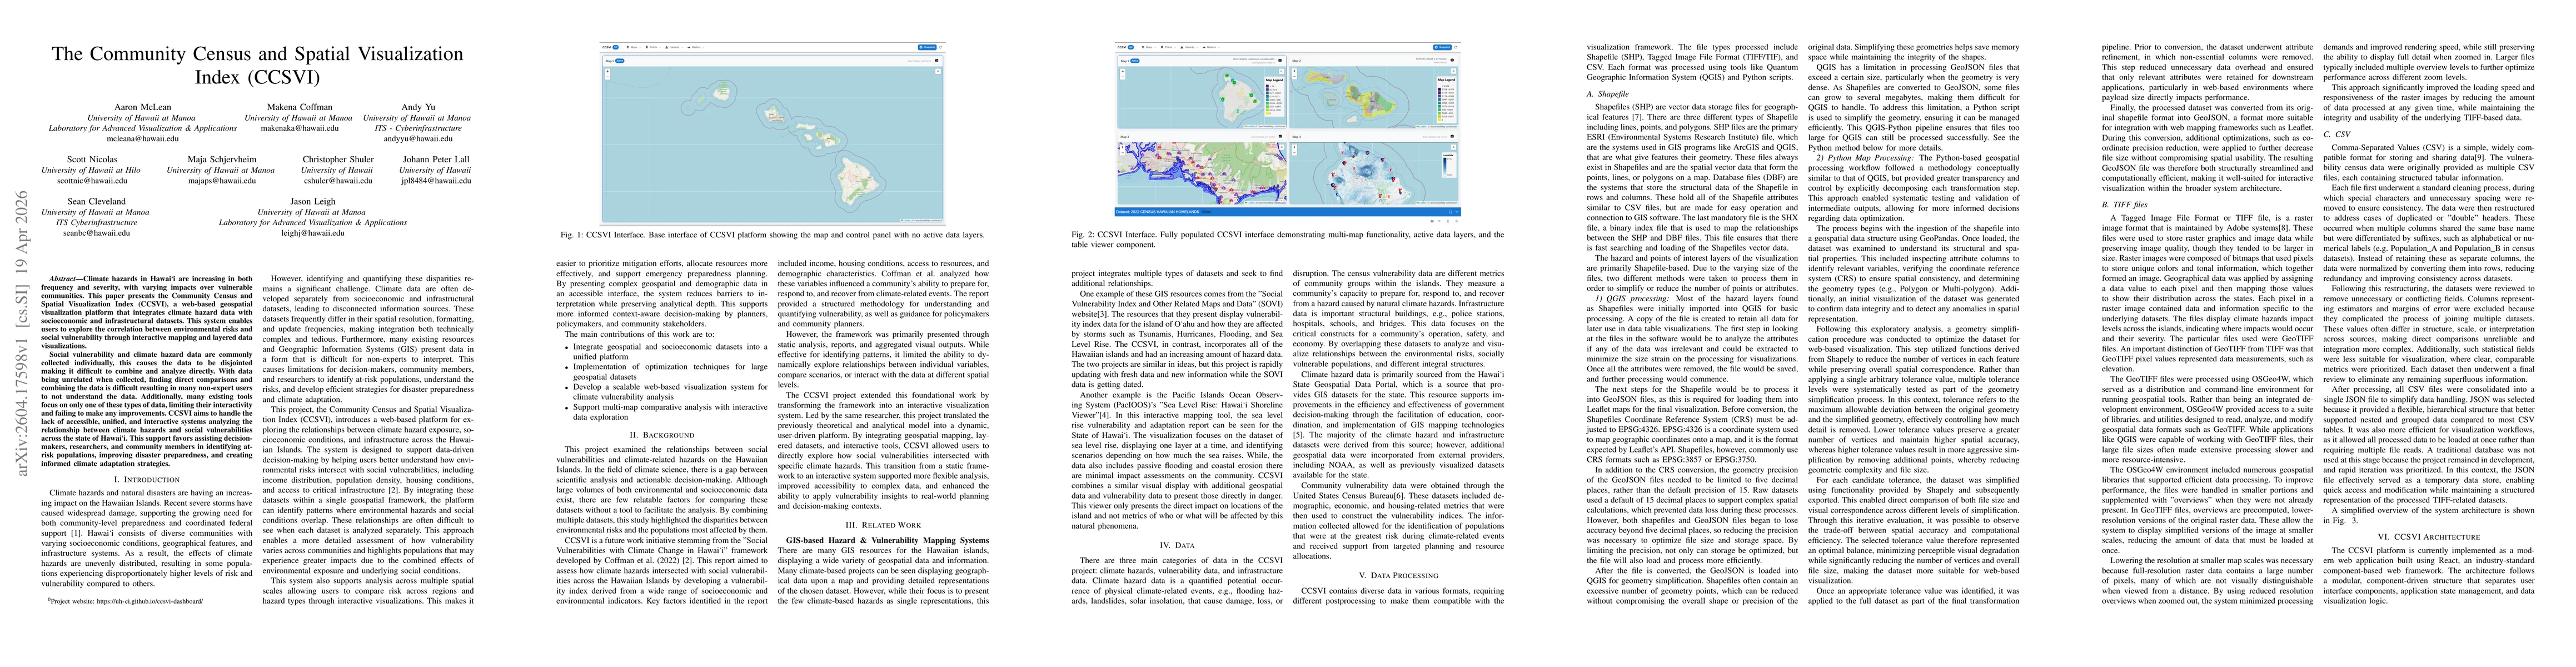
Climate hazards in Hawai'i are increasing in both frequency and severity, with varying impacts over vulnerable communities. This paper presents the Community Census and Spatial Visualization Index (CC...