Academic Profile
Statistics
Similar Authors
Papers on arXiv
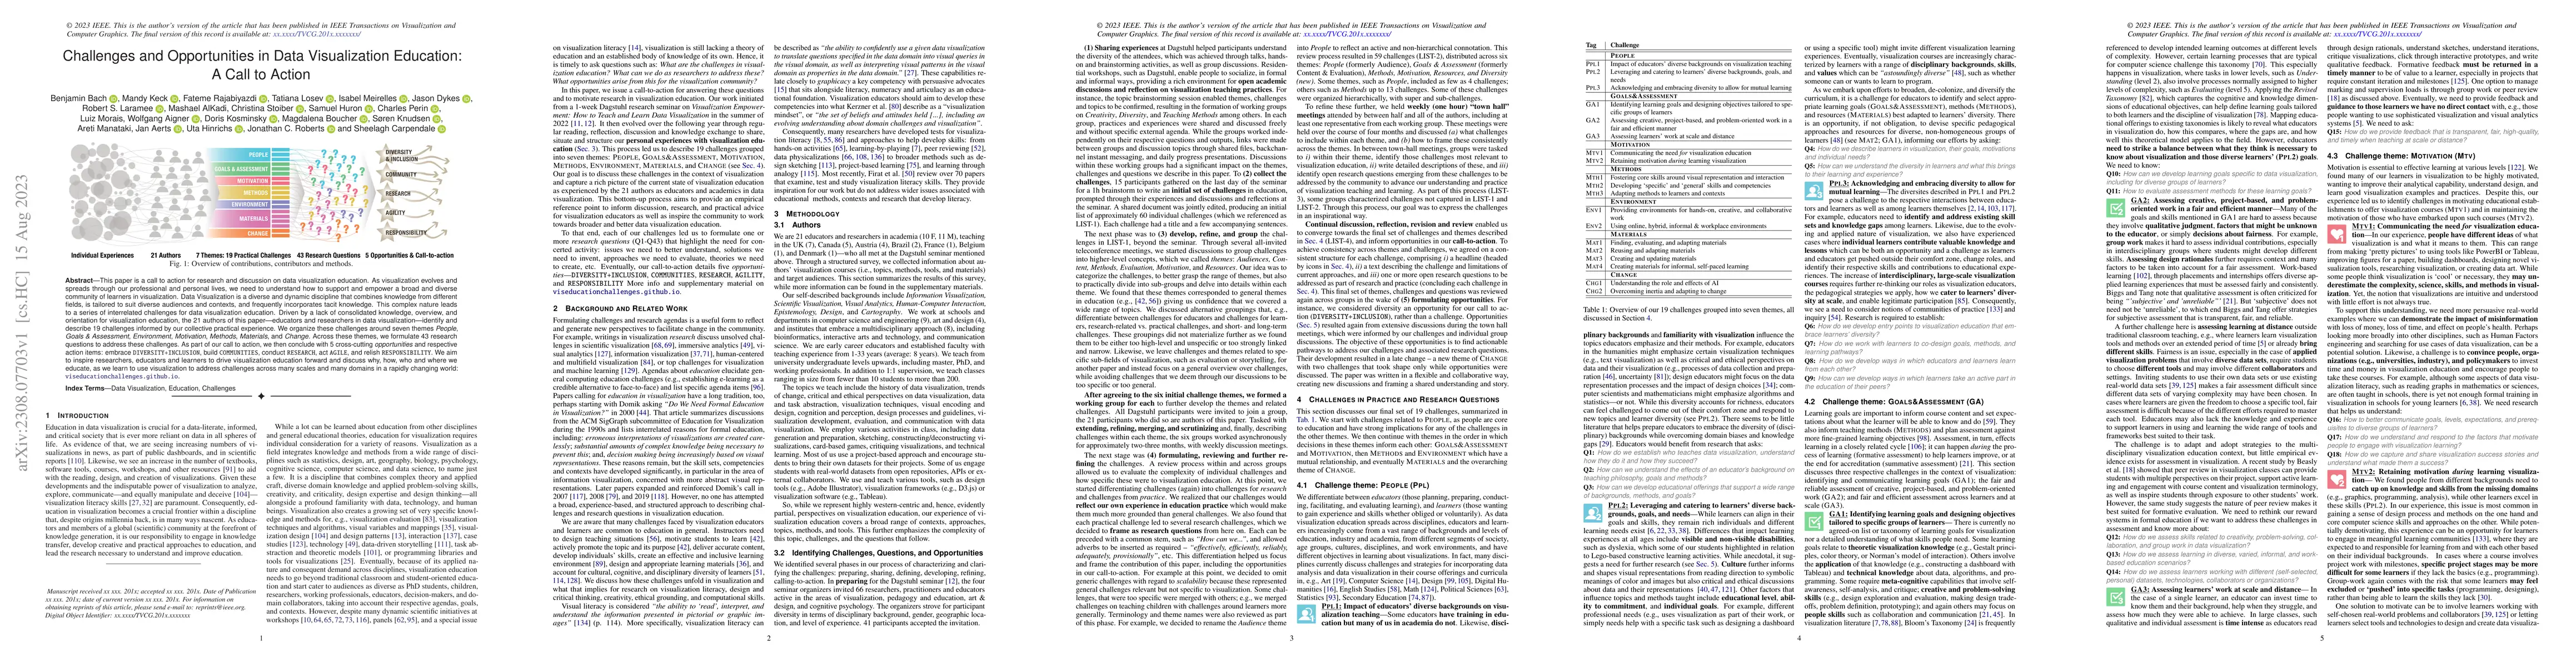
This paper is a call to action for research and discussion on data visualization education. As visualization evolves and spreads through our professional and personal lives, we need to understand ho...
This workshop focuses on visualization education, literacy, and activities. It aims to streamline previous efforts and initiatives of the visualization community to provide a format for education an...
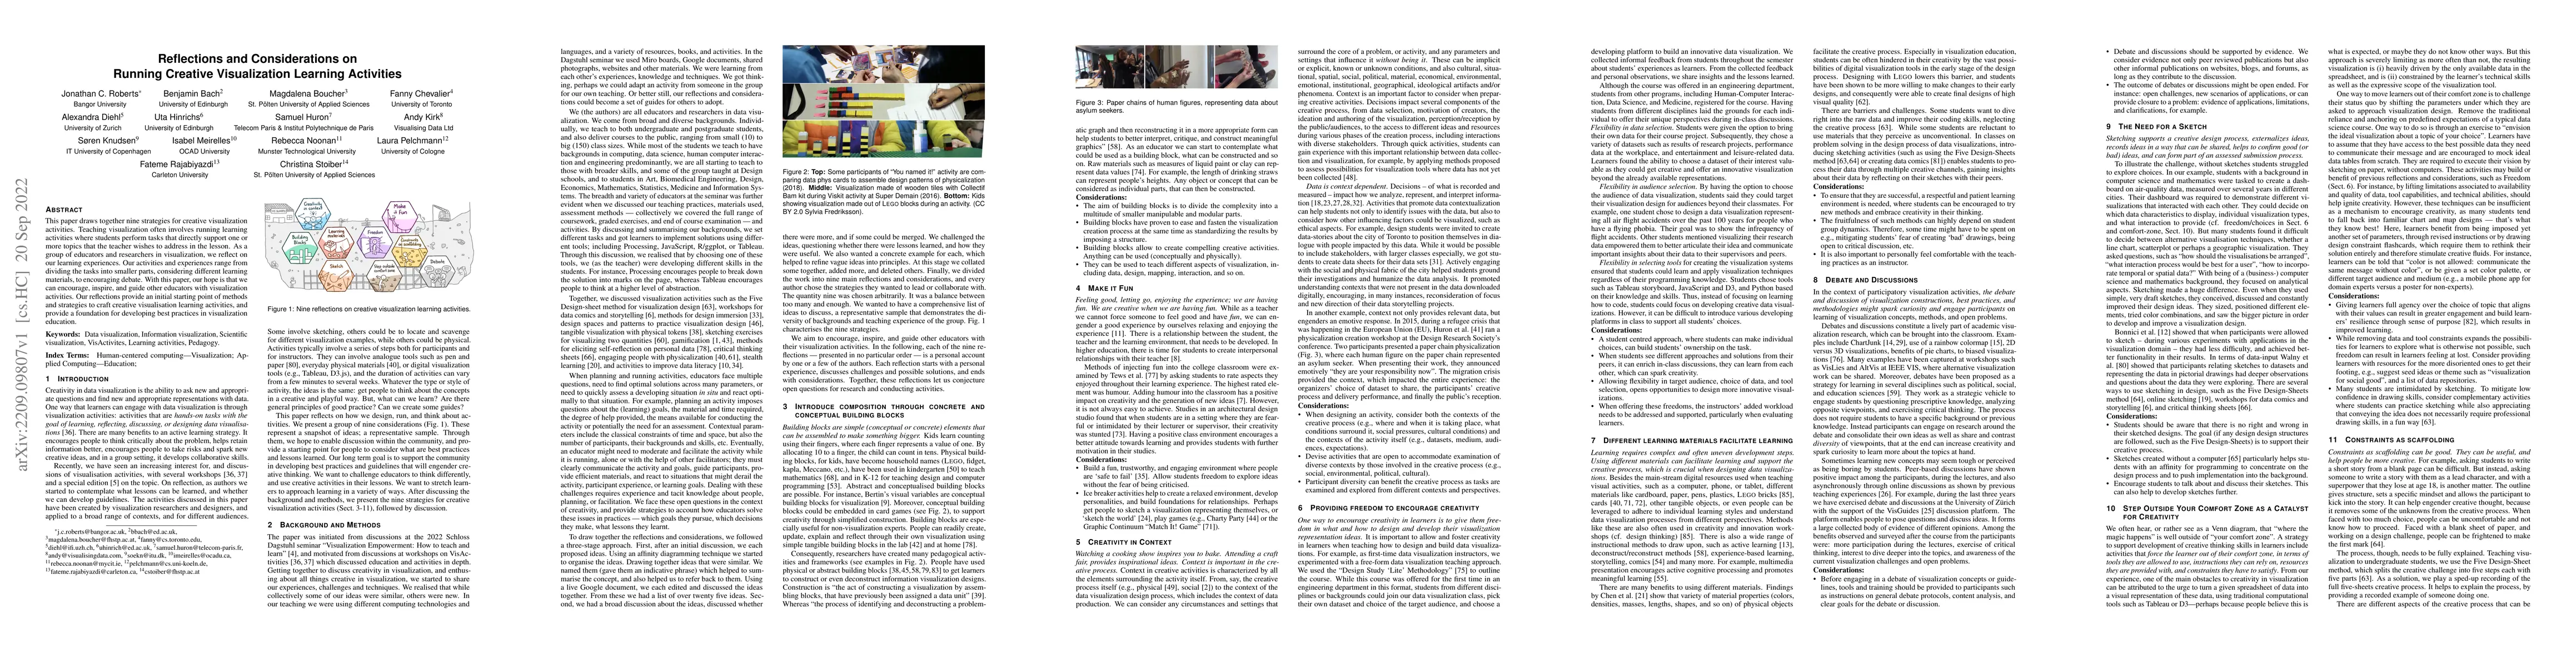
This paper draws together nine strategies for creative visualization activities. Teaching visualization often involves running learning activities where students perform tasks that directly support ...
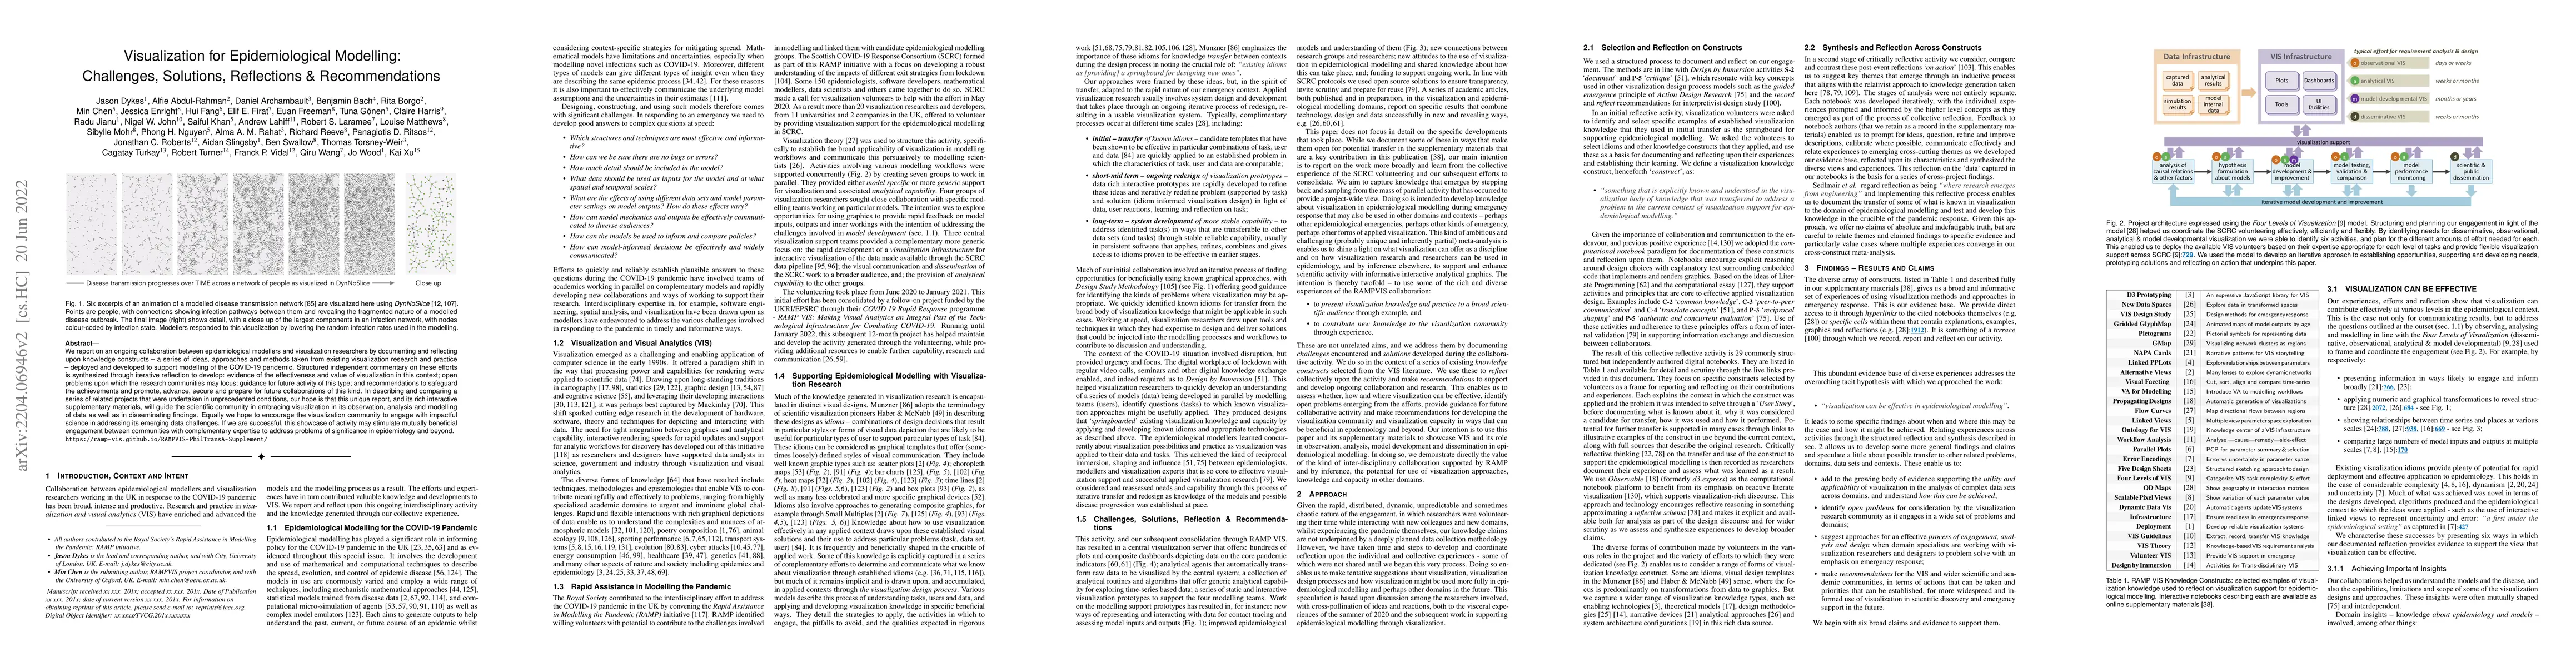
We report on an ongoing collaboration between epidemiological modellers and visualization researchers by documenting and reflecting upon knowledge constructs -- a series of ideas, approaches and met...
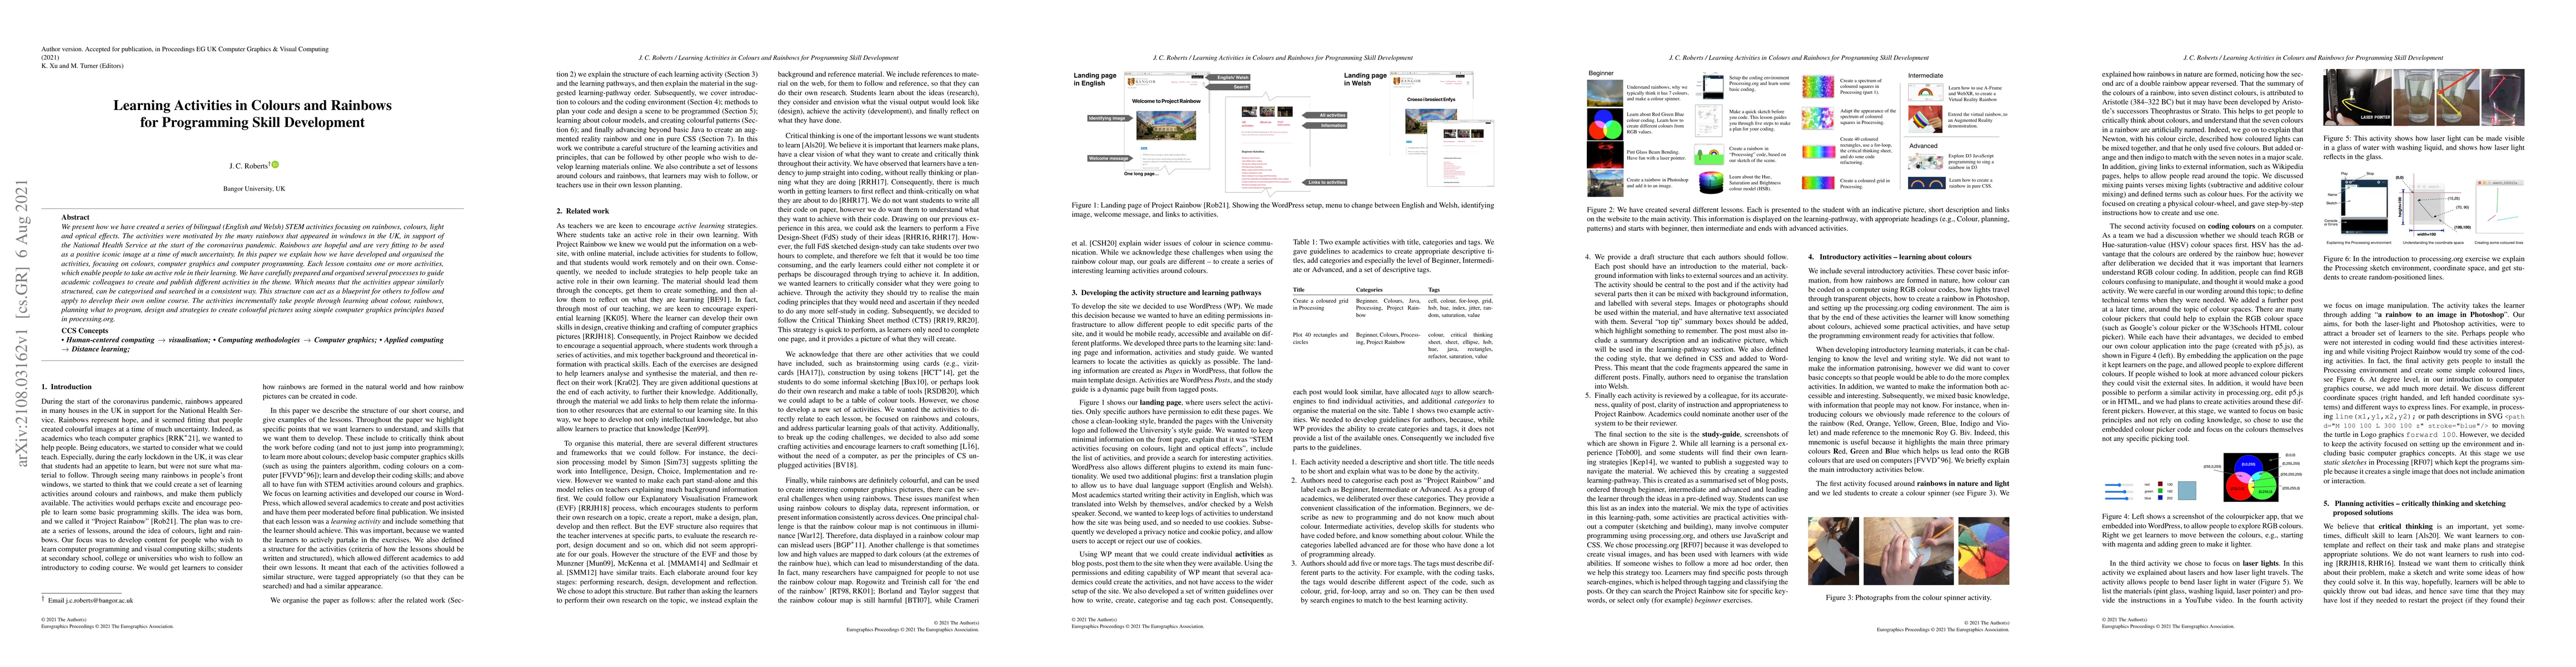
We present how we have created a series of bilingual (English and Welsh) STEM activities focusing on rainbows, colours, light and optical effects. The activities were motivated by the many rainbows ...
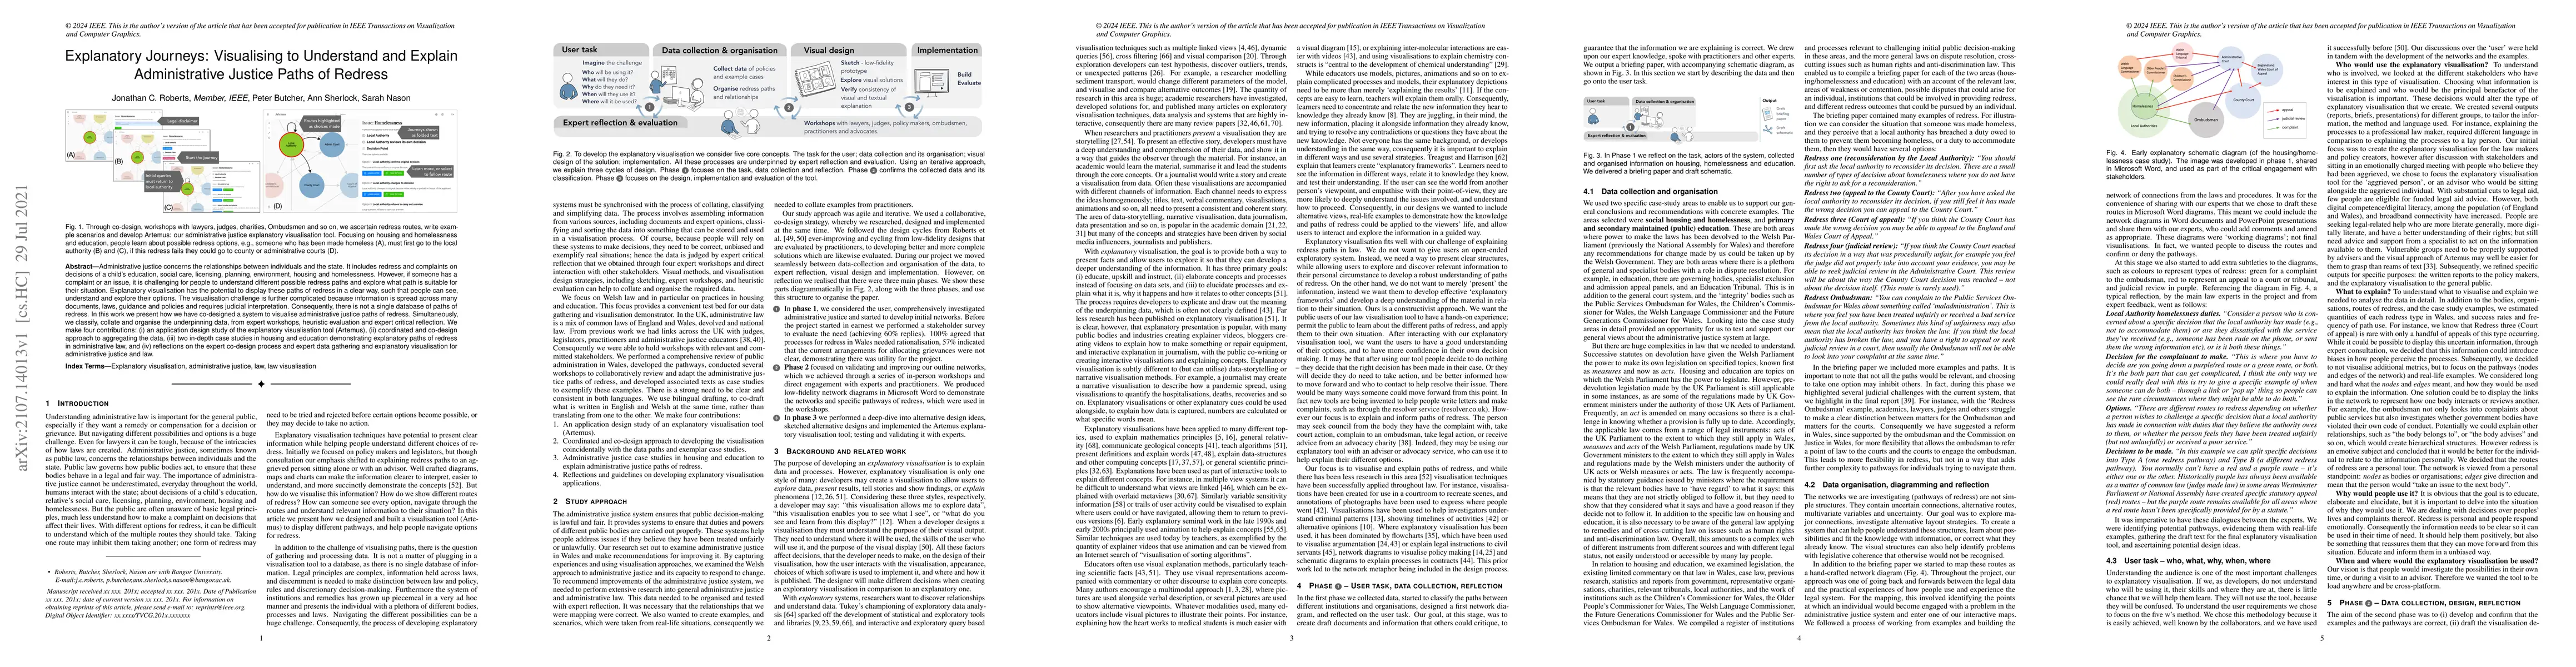
Administrative justice concerns the relationships between individuals and the state. It includes redress and complaints on decisions of a child's education, social care, licensing, planning, environ...
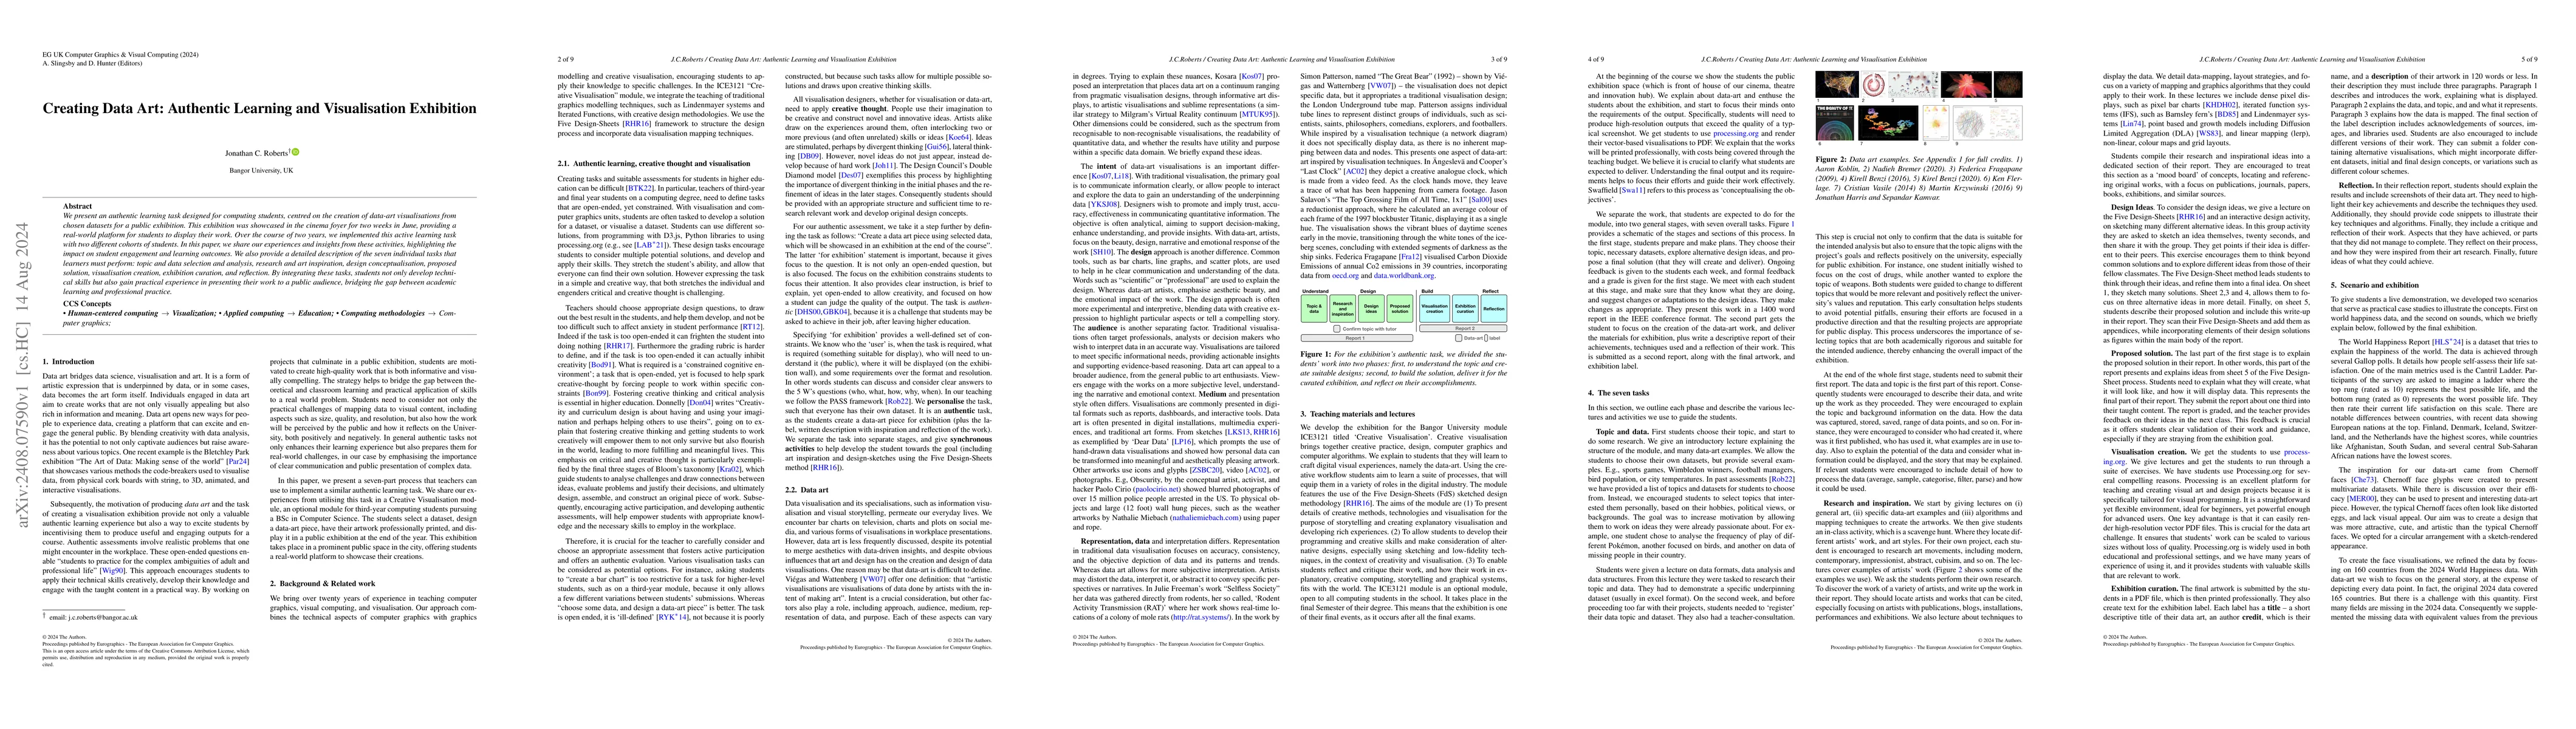
We present an authentic learning task designed for computing students, centred on the creation of data-art visualisations from chosen datasets for a public exhibition. This exhibition was showcased in...
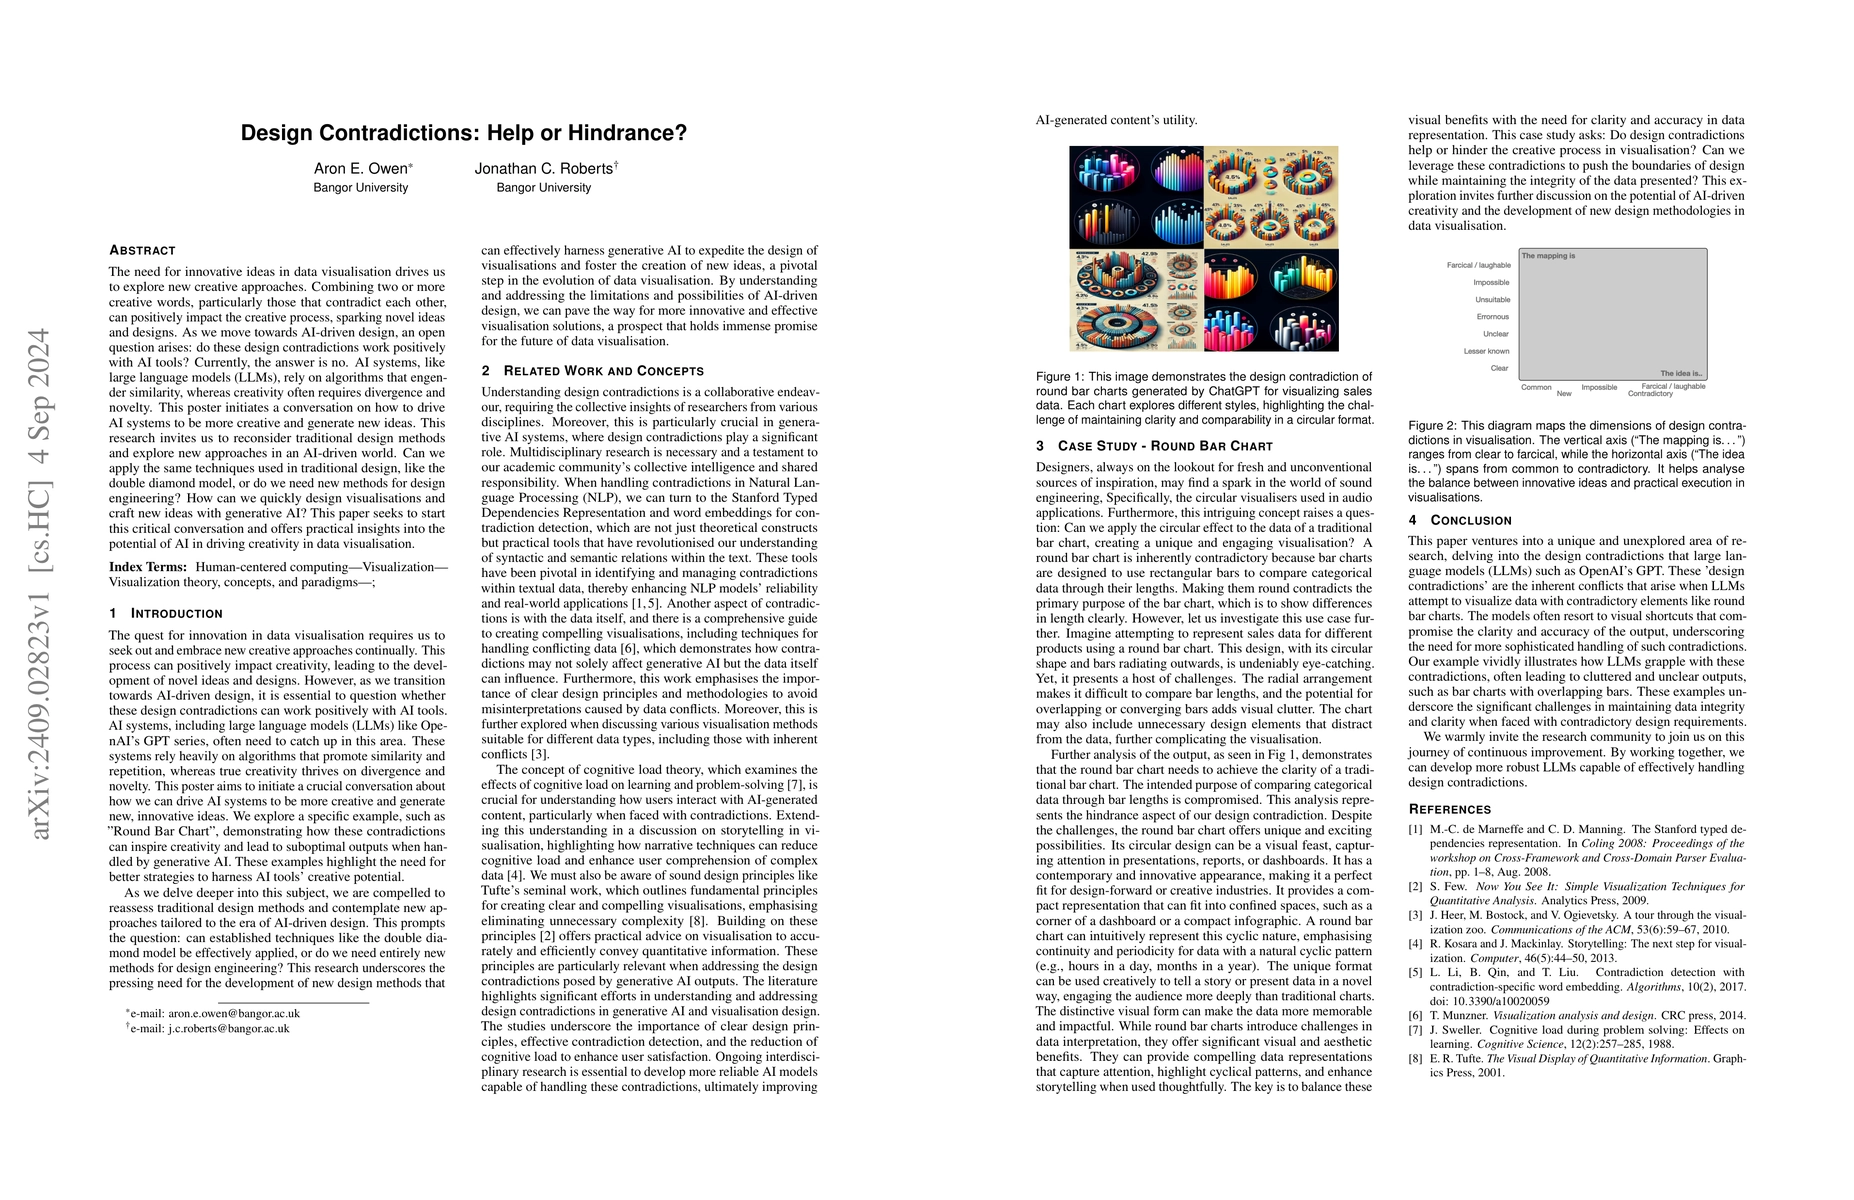
The need for innovative ideas in data visualisation drives us to explore new creative approaches. Combining two or more creative words, particularly those that contradict each other, can positively im...
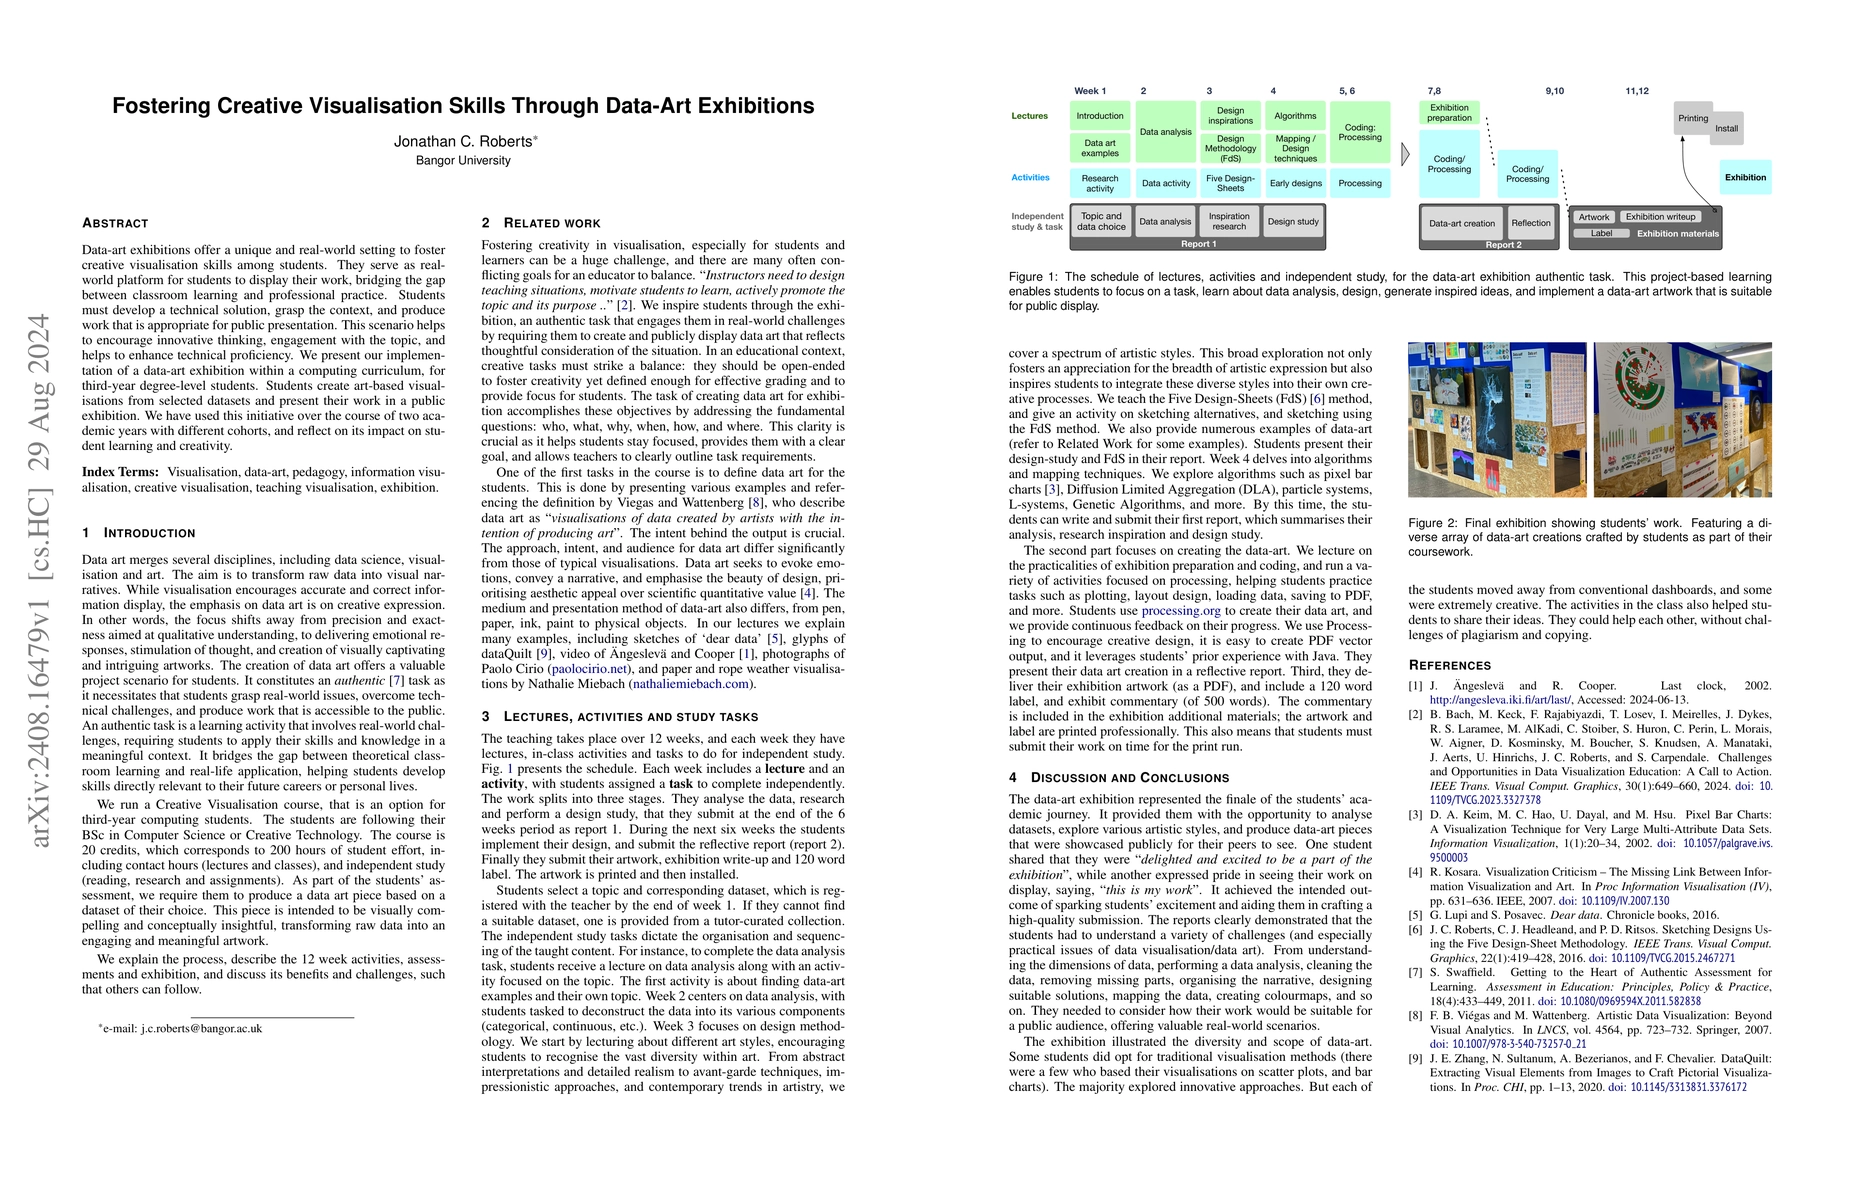
Data-art exhibitions offer a unique and real-world setting to foster creative visualisation skills among students. They serve as real-world platform for students to display their work, bridging the ga...
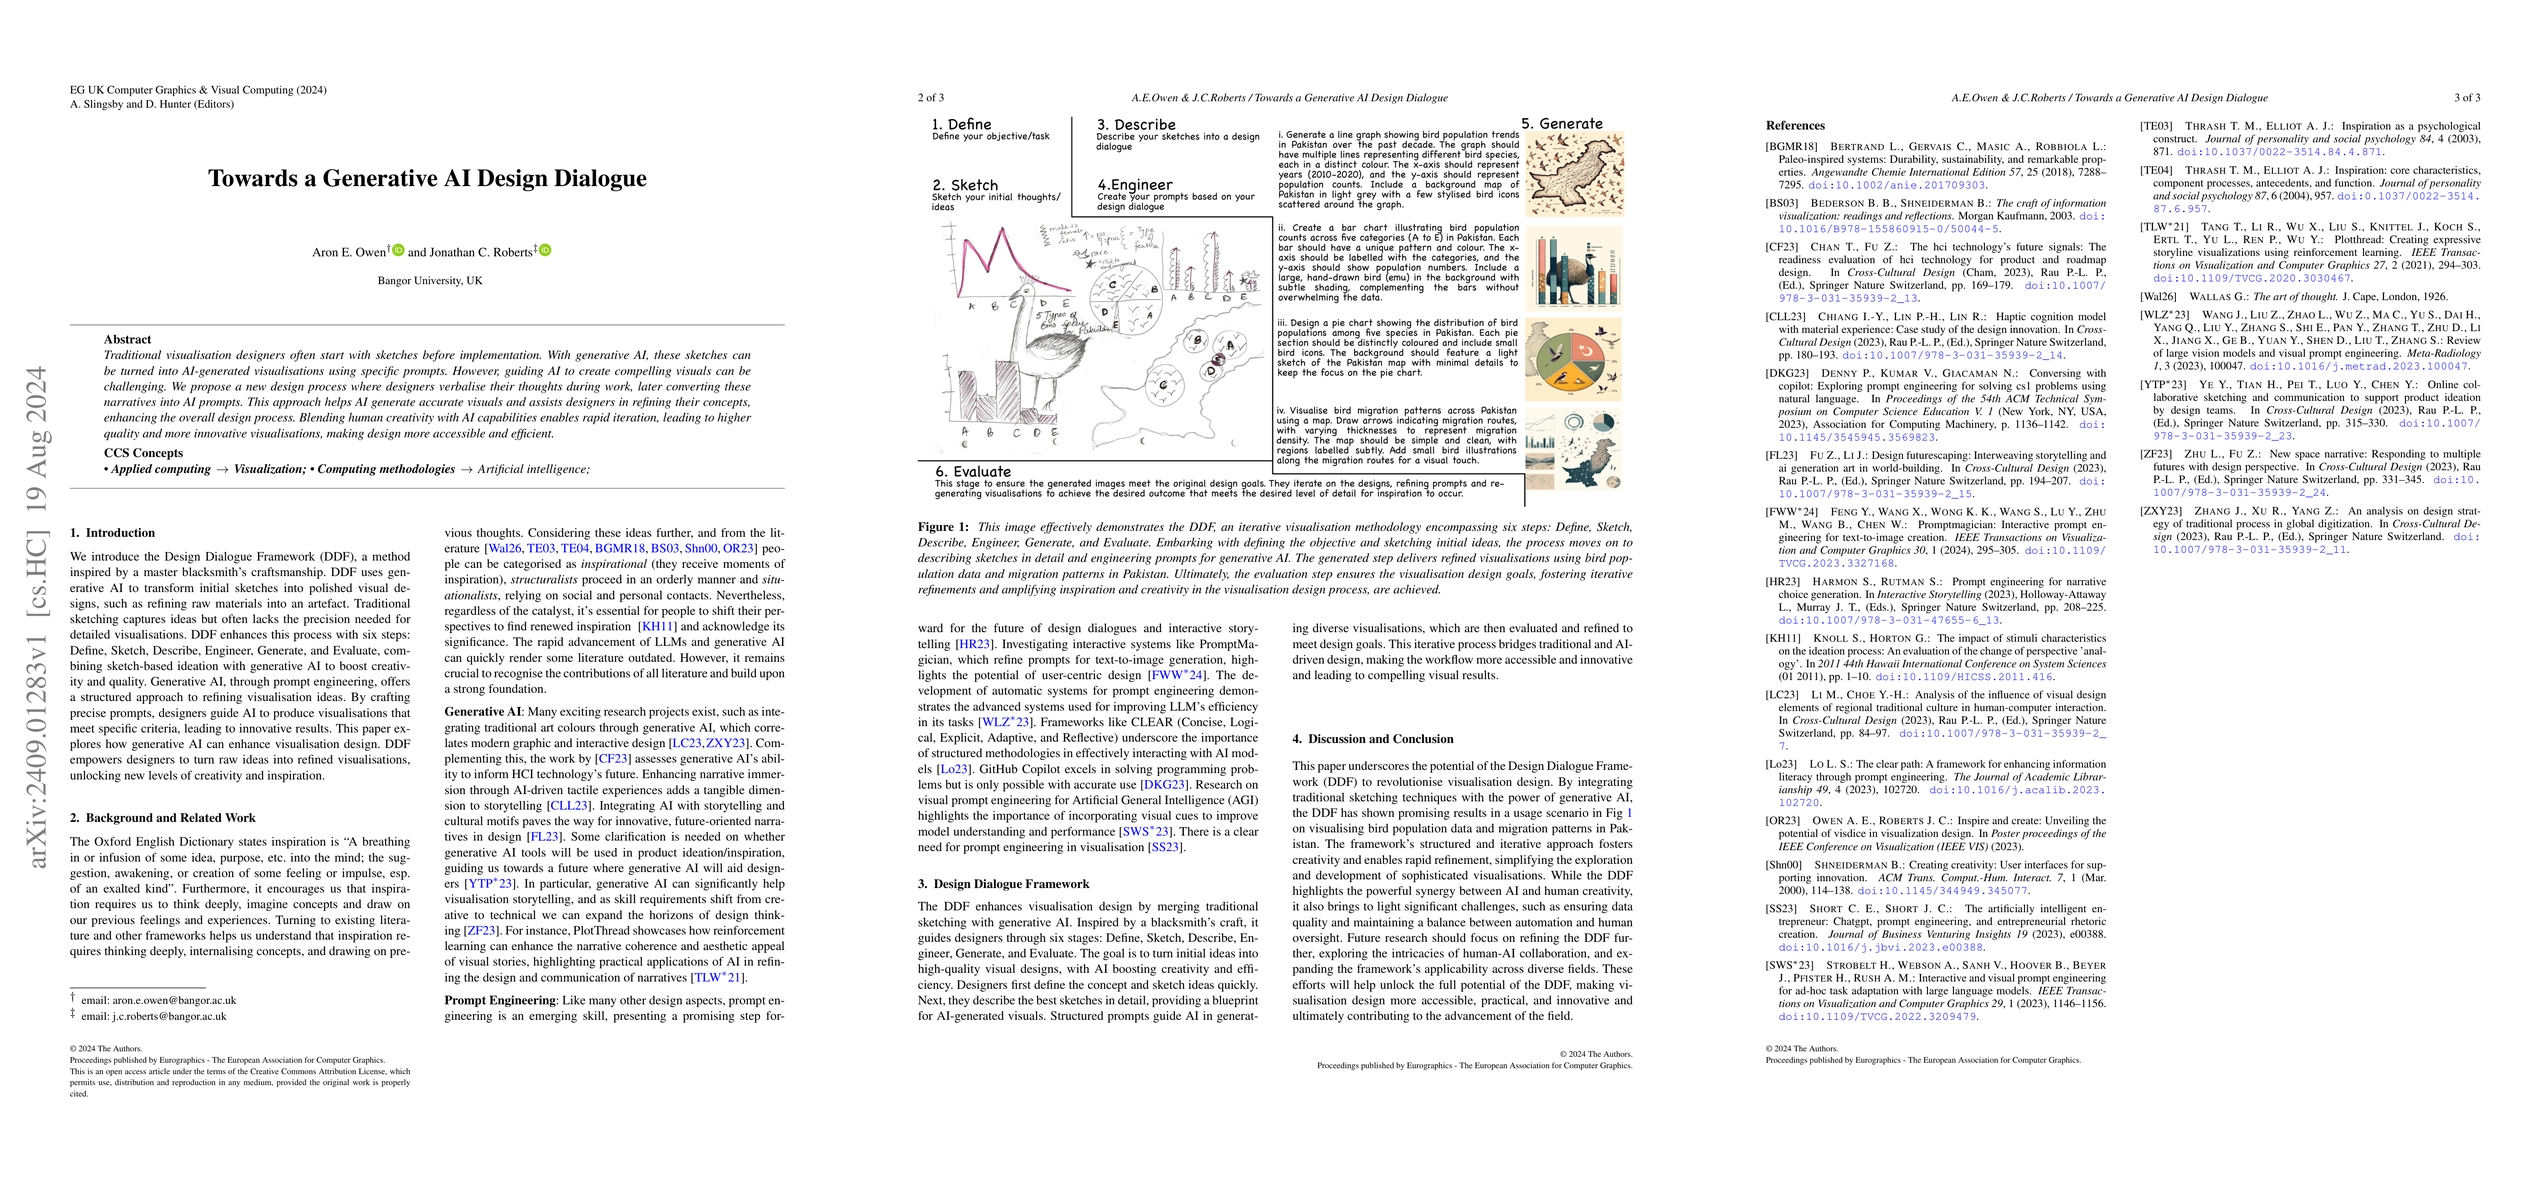
Traditional visualisation designers often start with sketches before implementation. With generative AI, these sketches can be turned into AI-generated visualisations using specific prompts. However, ...
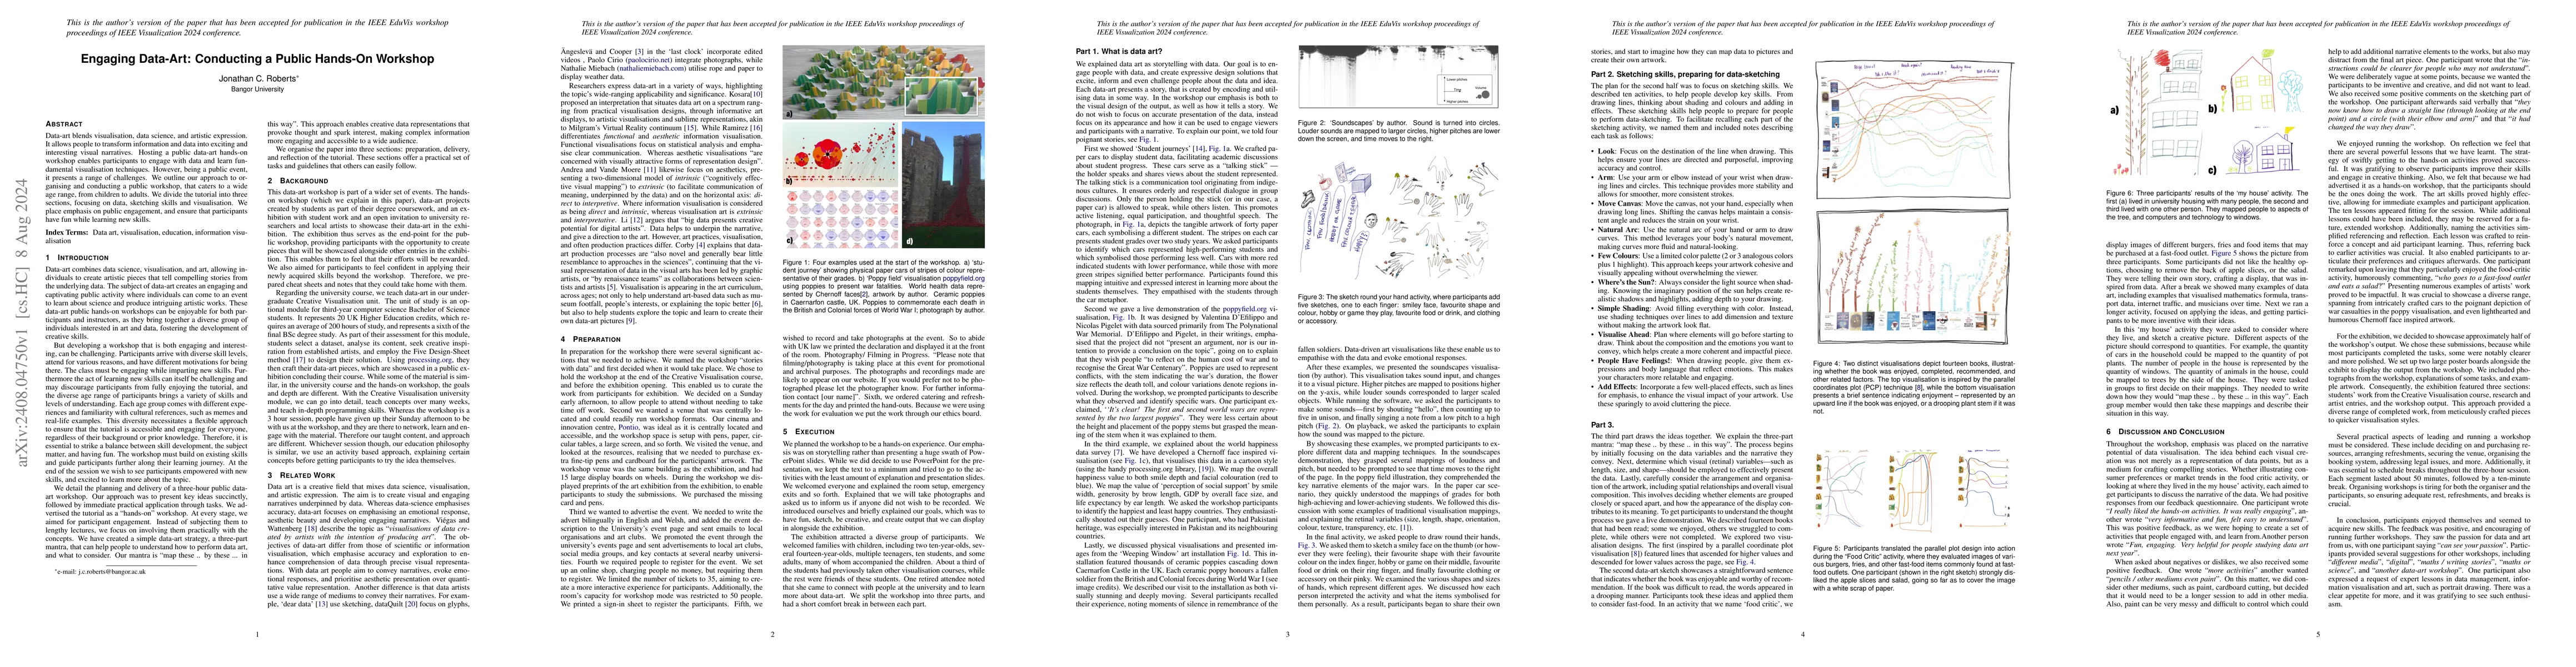
Data-art blends visualisation, data science, and artistic expression. It allows people to transform information and data into exciting and interesting visual narratives. Hosting a public data-art hand...
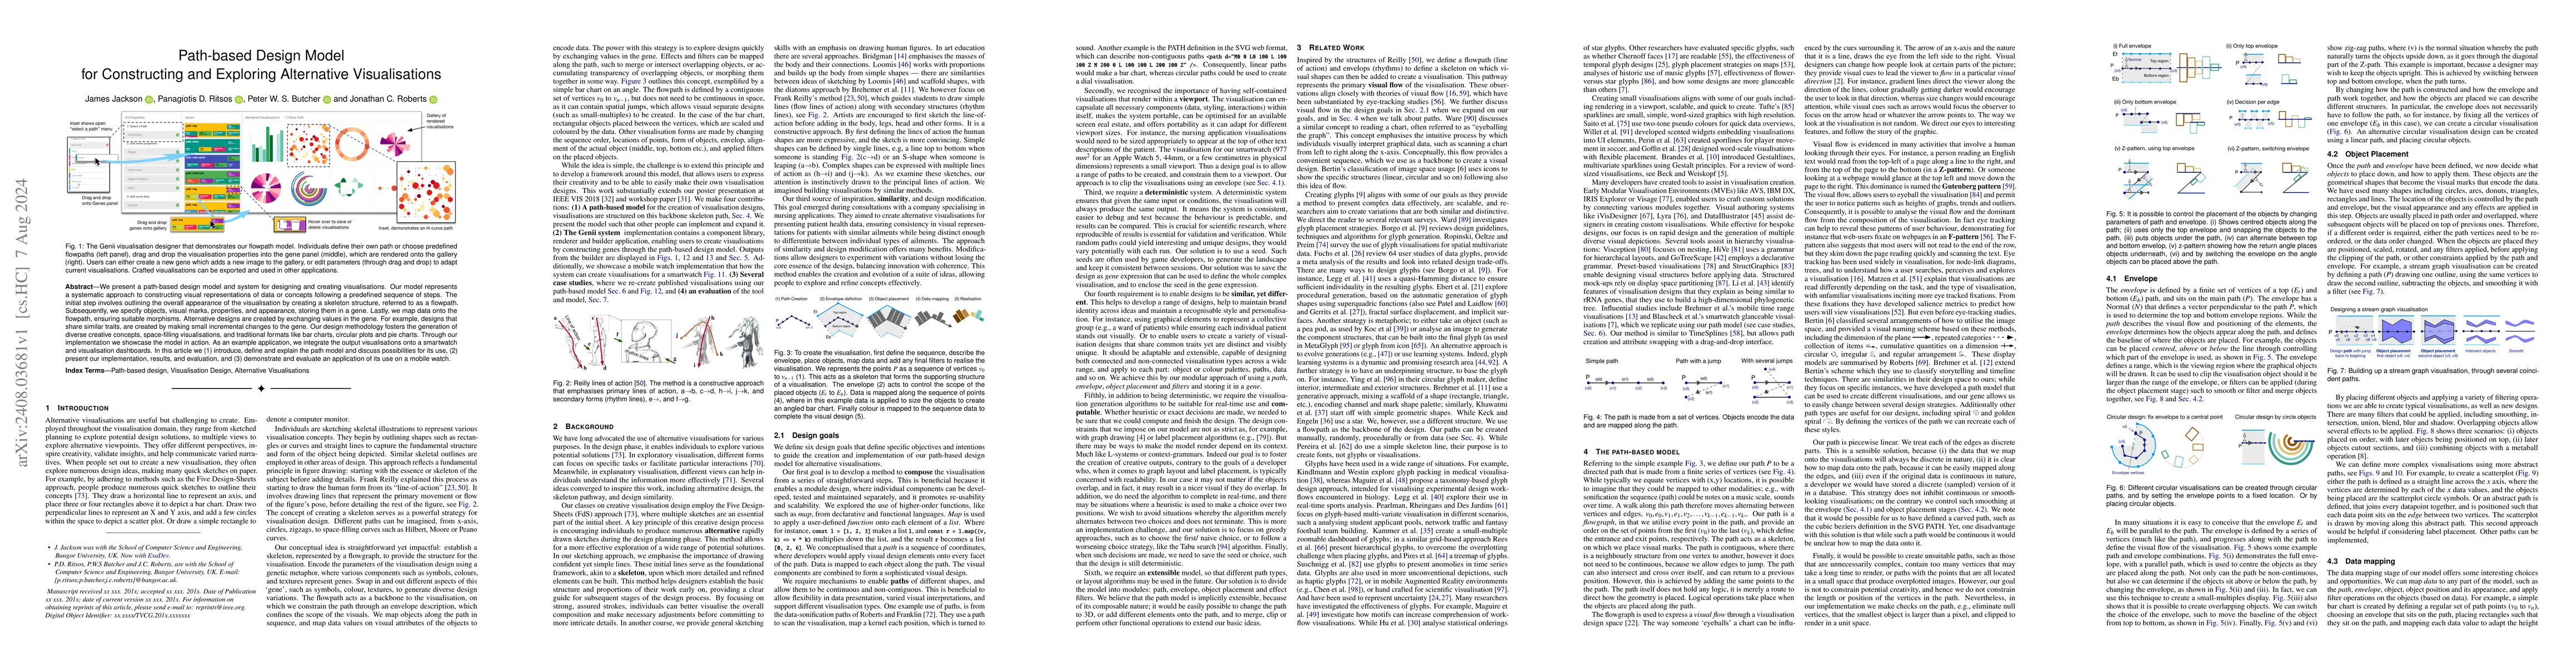
We present a path-based design model and system for designing and creating visualisations. Our model represents a systematic approach to constructing visual representations of data or concepts followi...
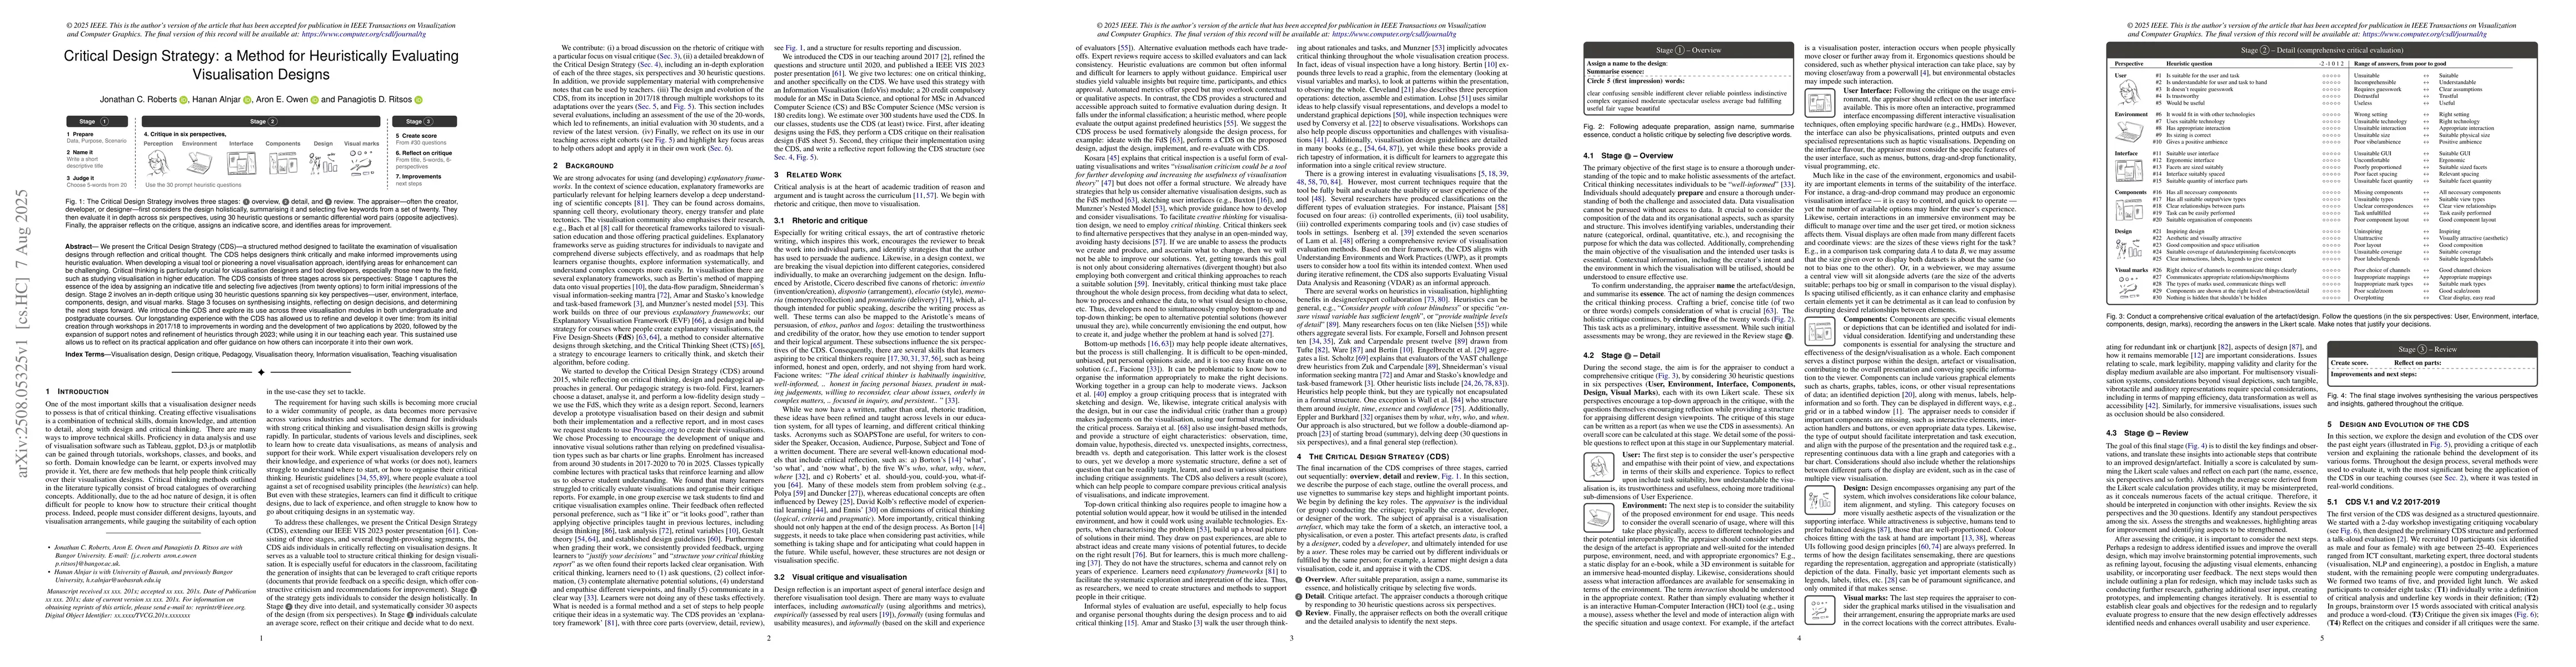
We present the Critical Design Strategy (CDS) - a structured method designed to facilitate the examination of visualisation designs through reflection and critical thought. The CDS helps designers thi...
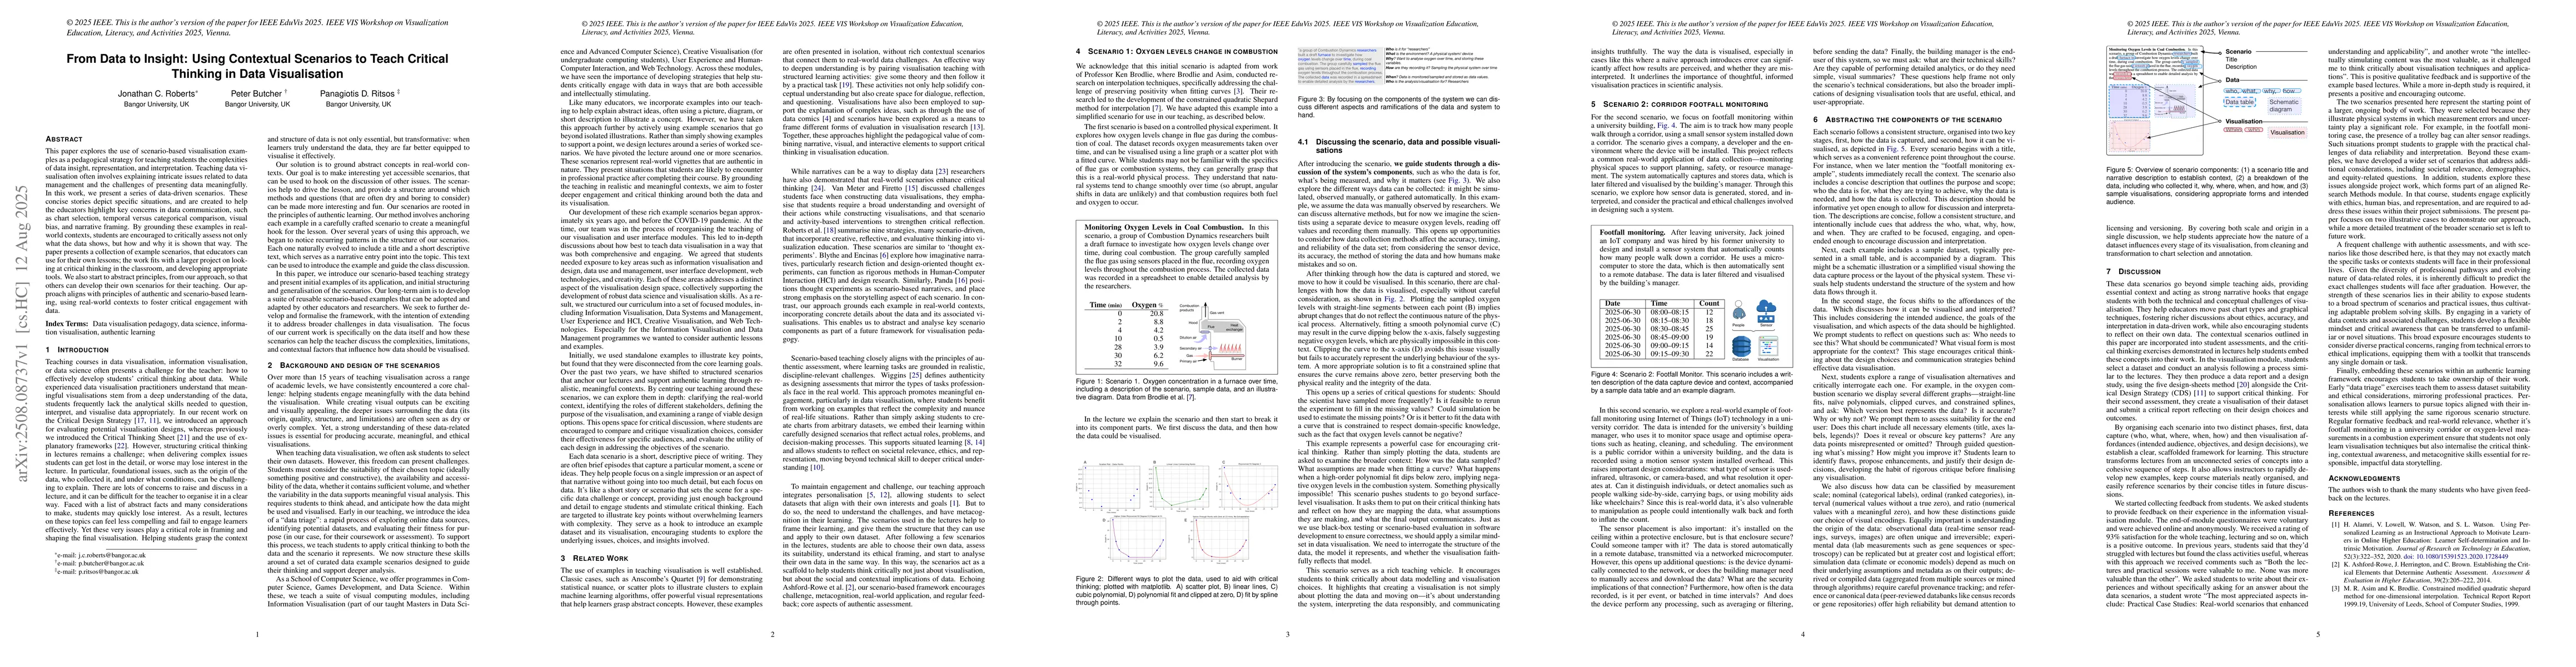
This paper explores the use of scenario-based visualisation examples as a pedagogical strategy for teaching students the complexities of data insight, representation, and interpretation. Teaching data...
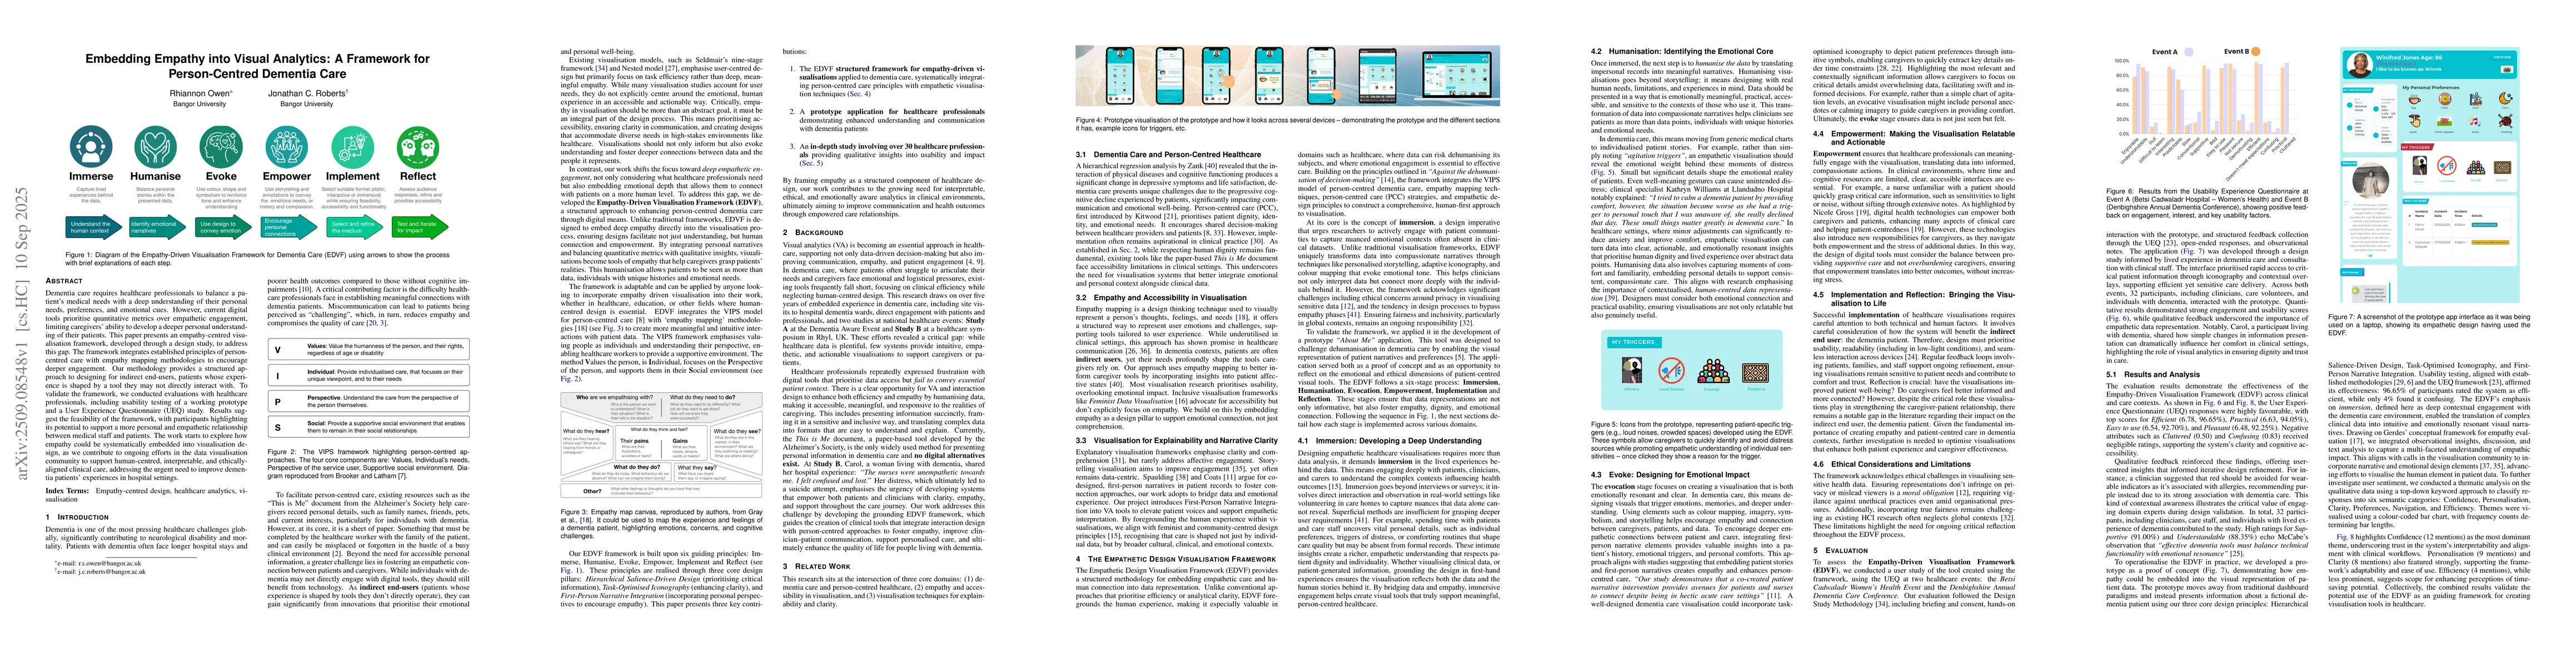
Dementia care requires healthcare professionals to balance a patient's medical needs with a deep understanding of their personal needs, preferences, and emotional cues. However, current digital tools ...