Academic Profile
Statistics
Similar Authors
Papers on arXiv
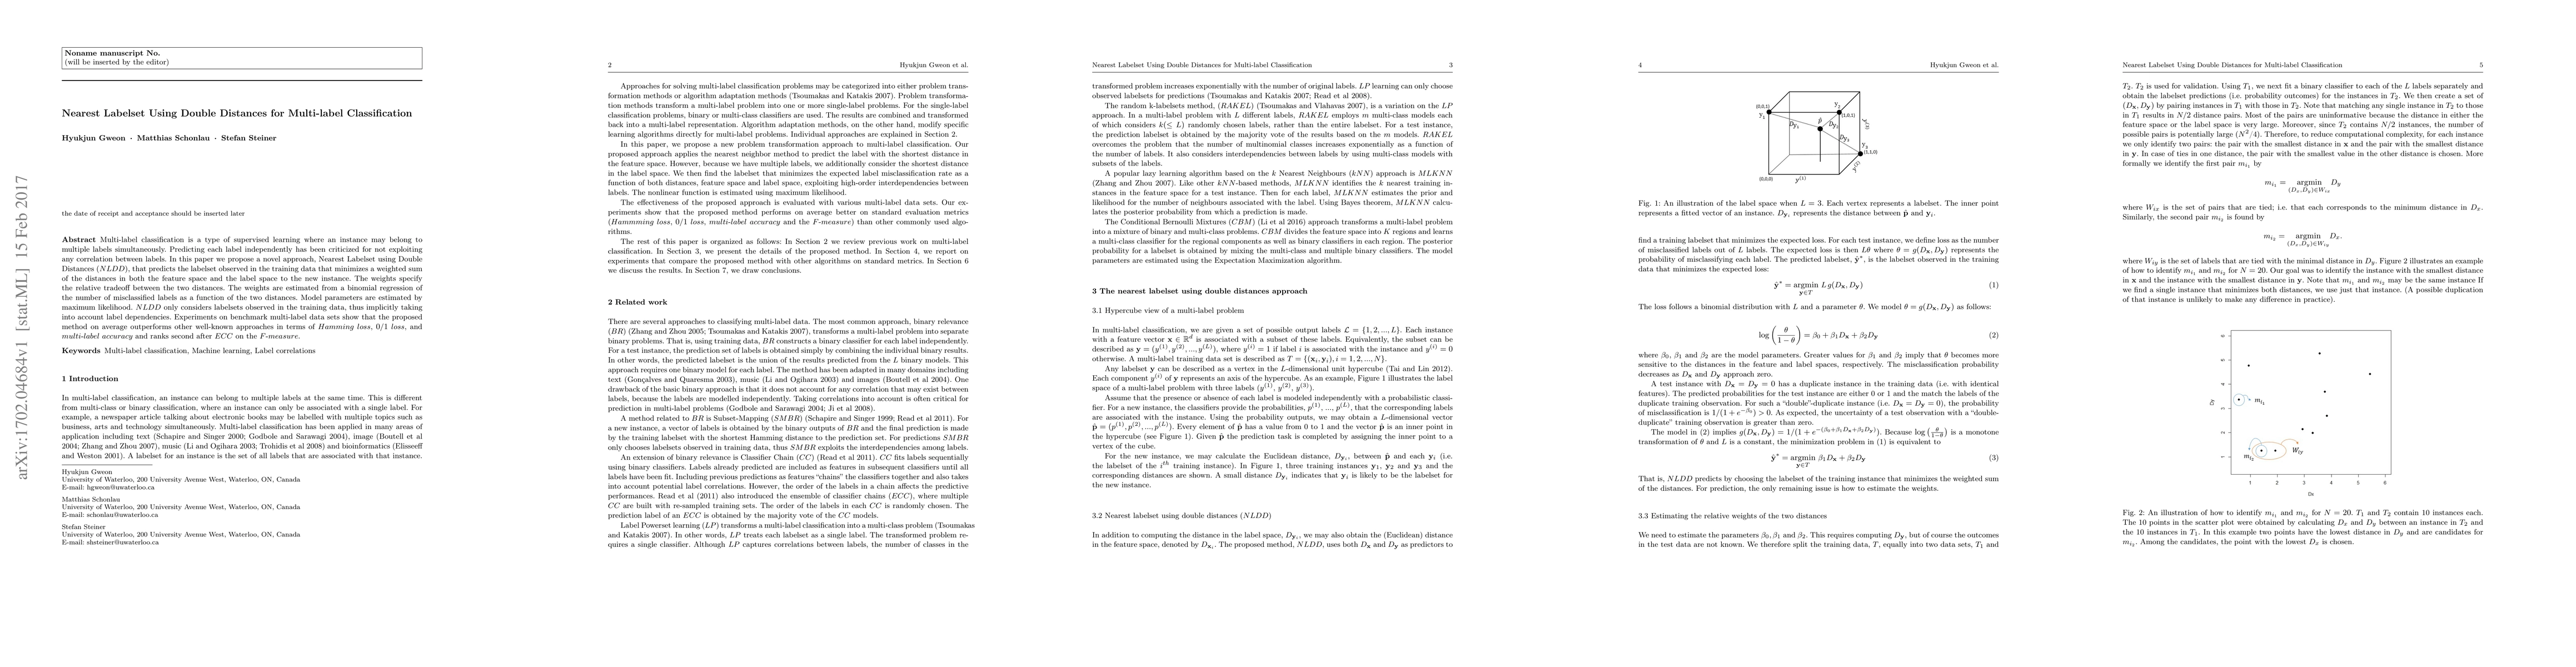
Multi-label classification is a type of supervised learning where an instance may belong to multiple labels simultaneously. Predicting each label independently has been criticized for not exploiting...
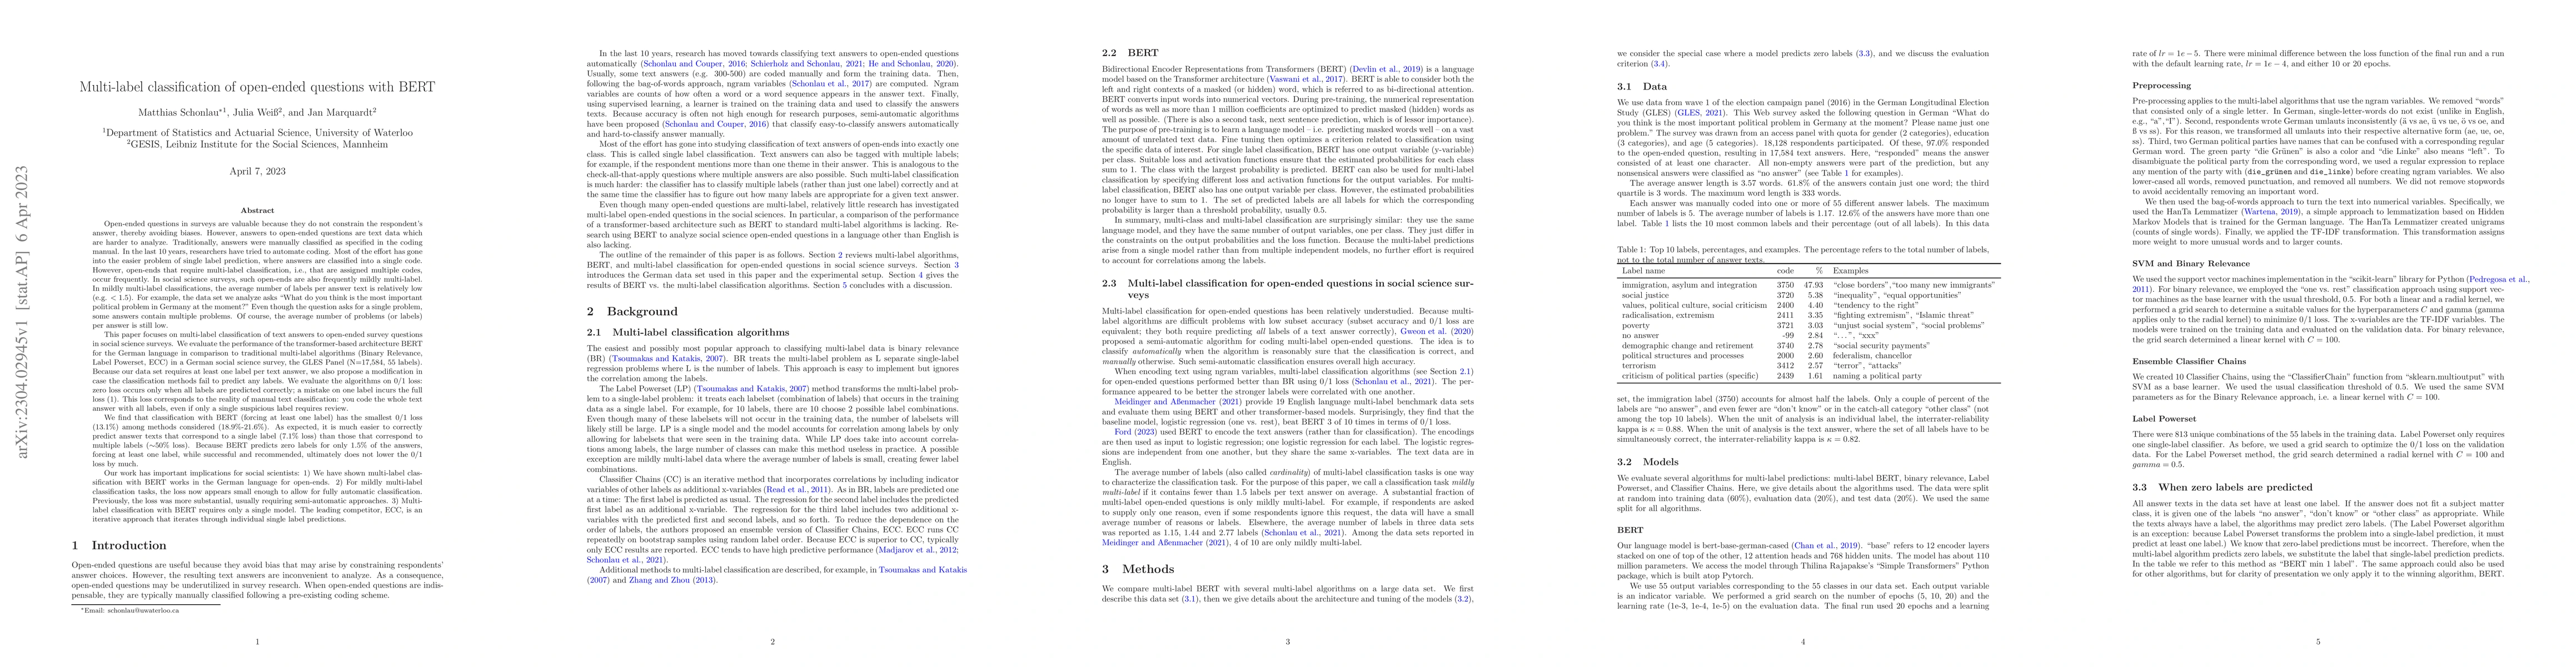
Open-ended questions in surveys are valuable because they do not constrain the respondent's answer, thereby avoiding biases. However, answers to open-ended questions are text data which are harder t...
Manual coding of text data from open-ended questions into different categories is time consuming and expensive. Automated coding uses statistical/machine learning to train on a small subset of manua...
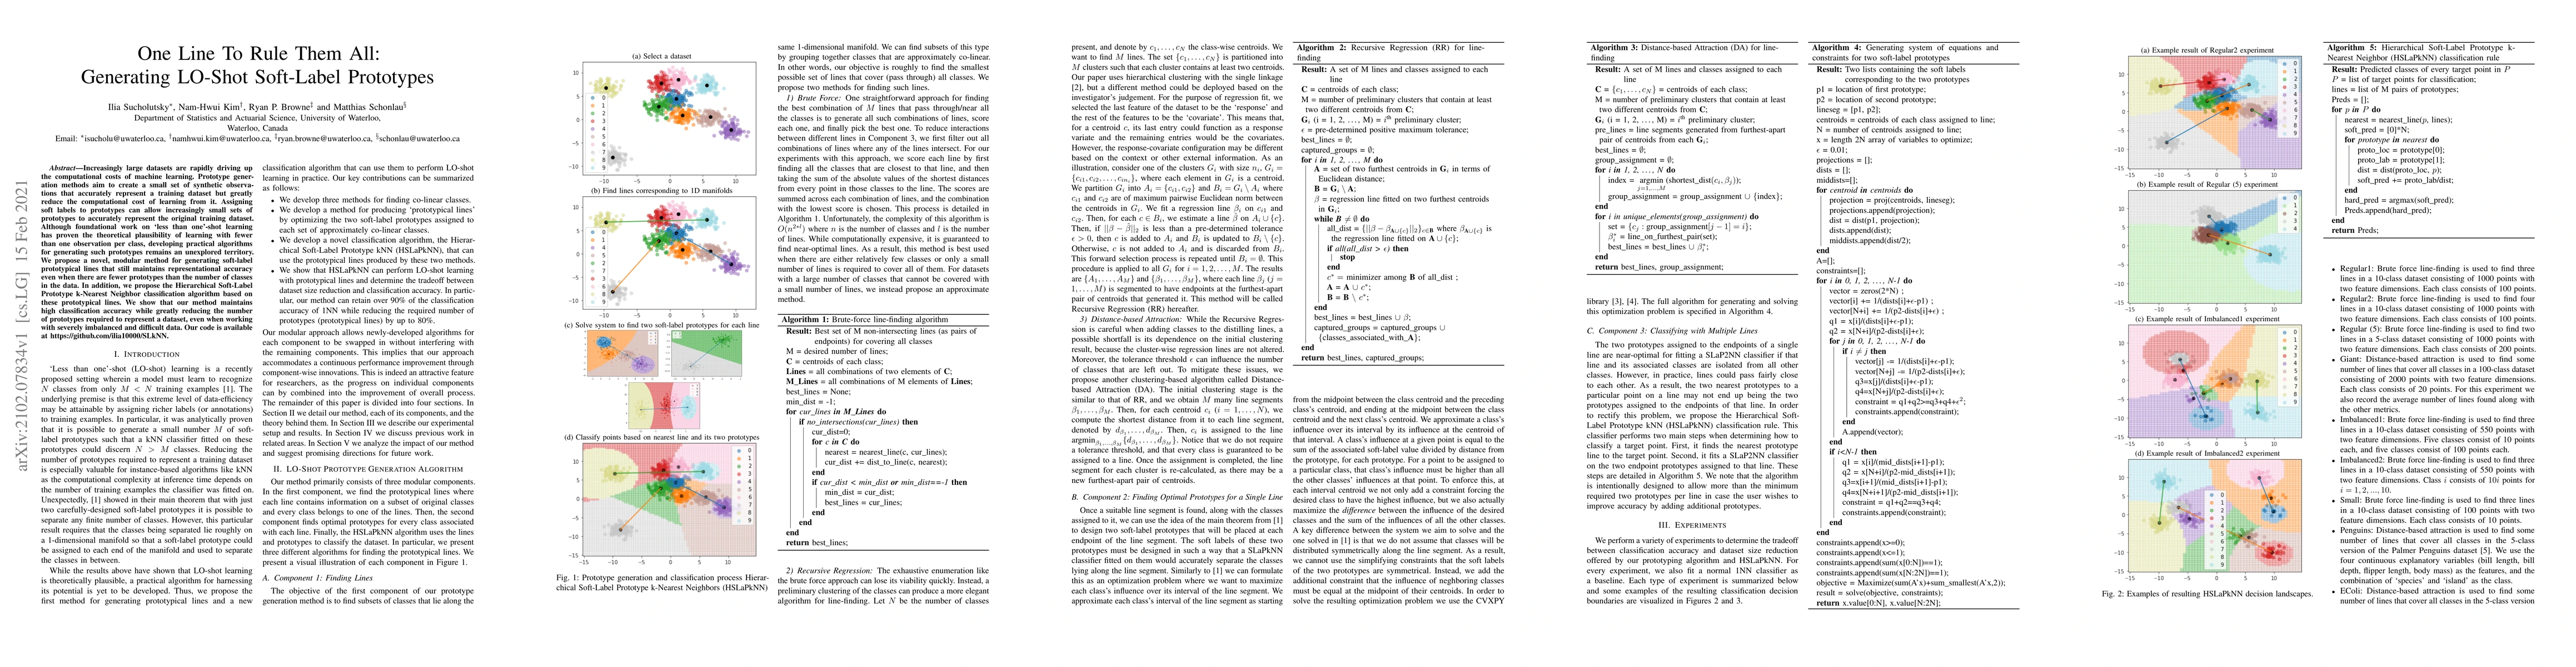
Increasingly large datasets are rapidly driving up the computational costs of machine learning. Prototype generation methods aim to create a small set of synthetic observations that accurately repre...
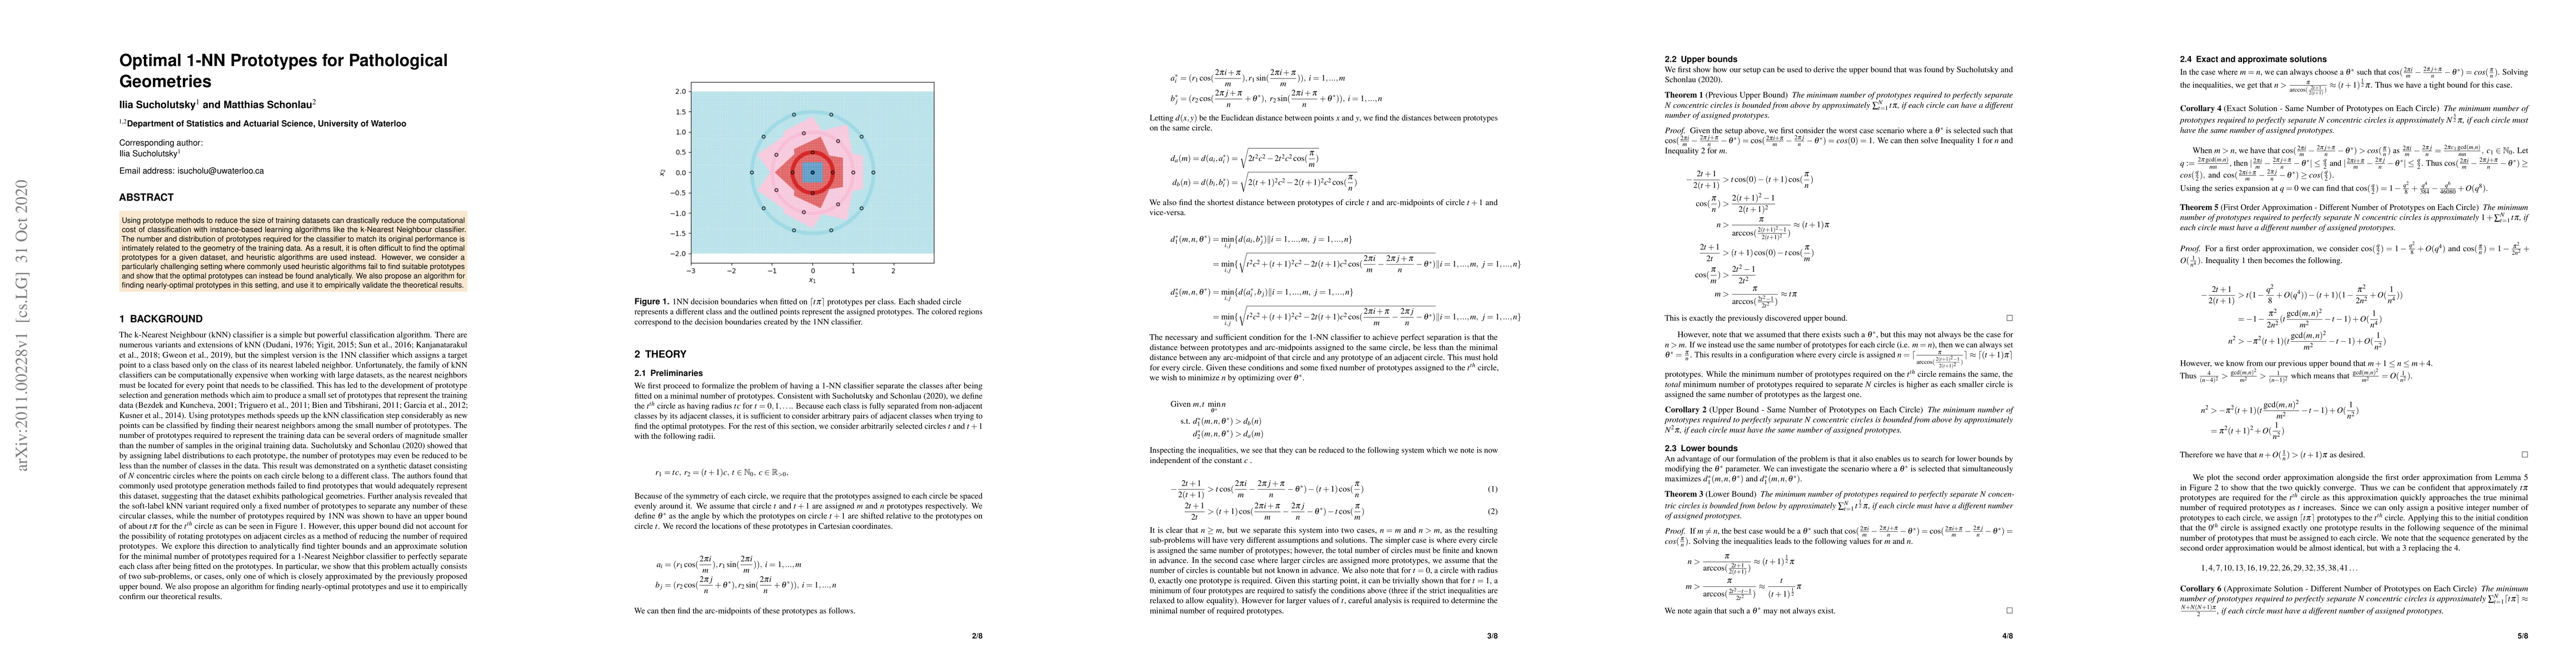
Using prototype methods to reduce the size of training datasets can drastically reduce the computational cost of classification with instance-based learning algorithms like the k-Nearest Neighbour c...
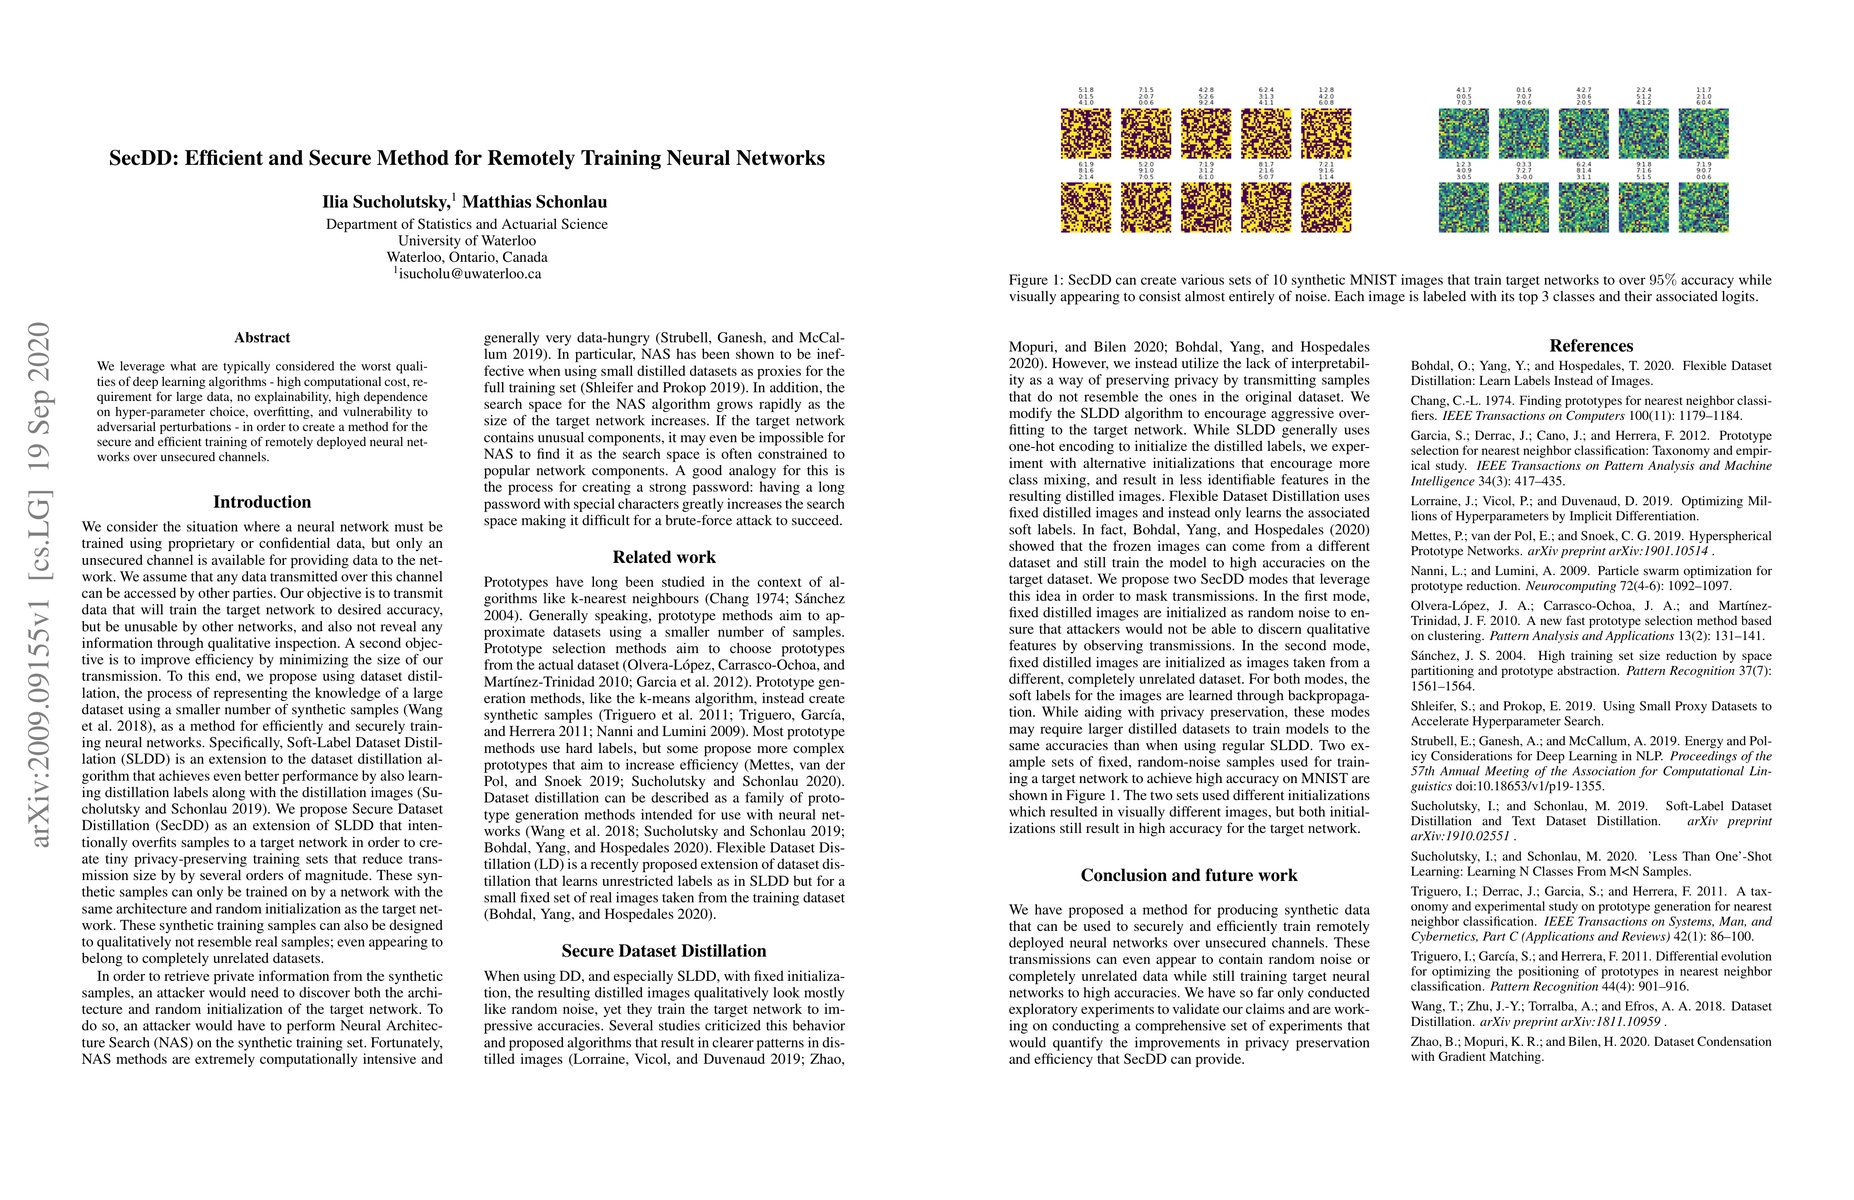
We leverage what are typically considered the worst qualities of deep learning algorithms - high computational cost, requirement for large data, no explainability, high dependence on hyper-parameter...
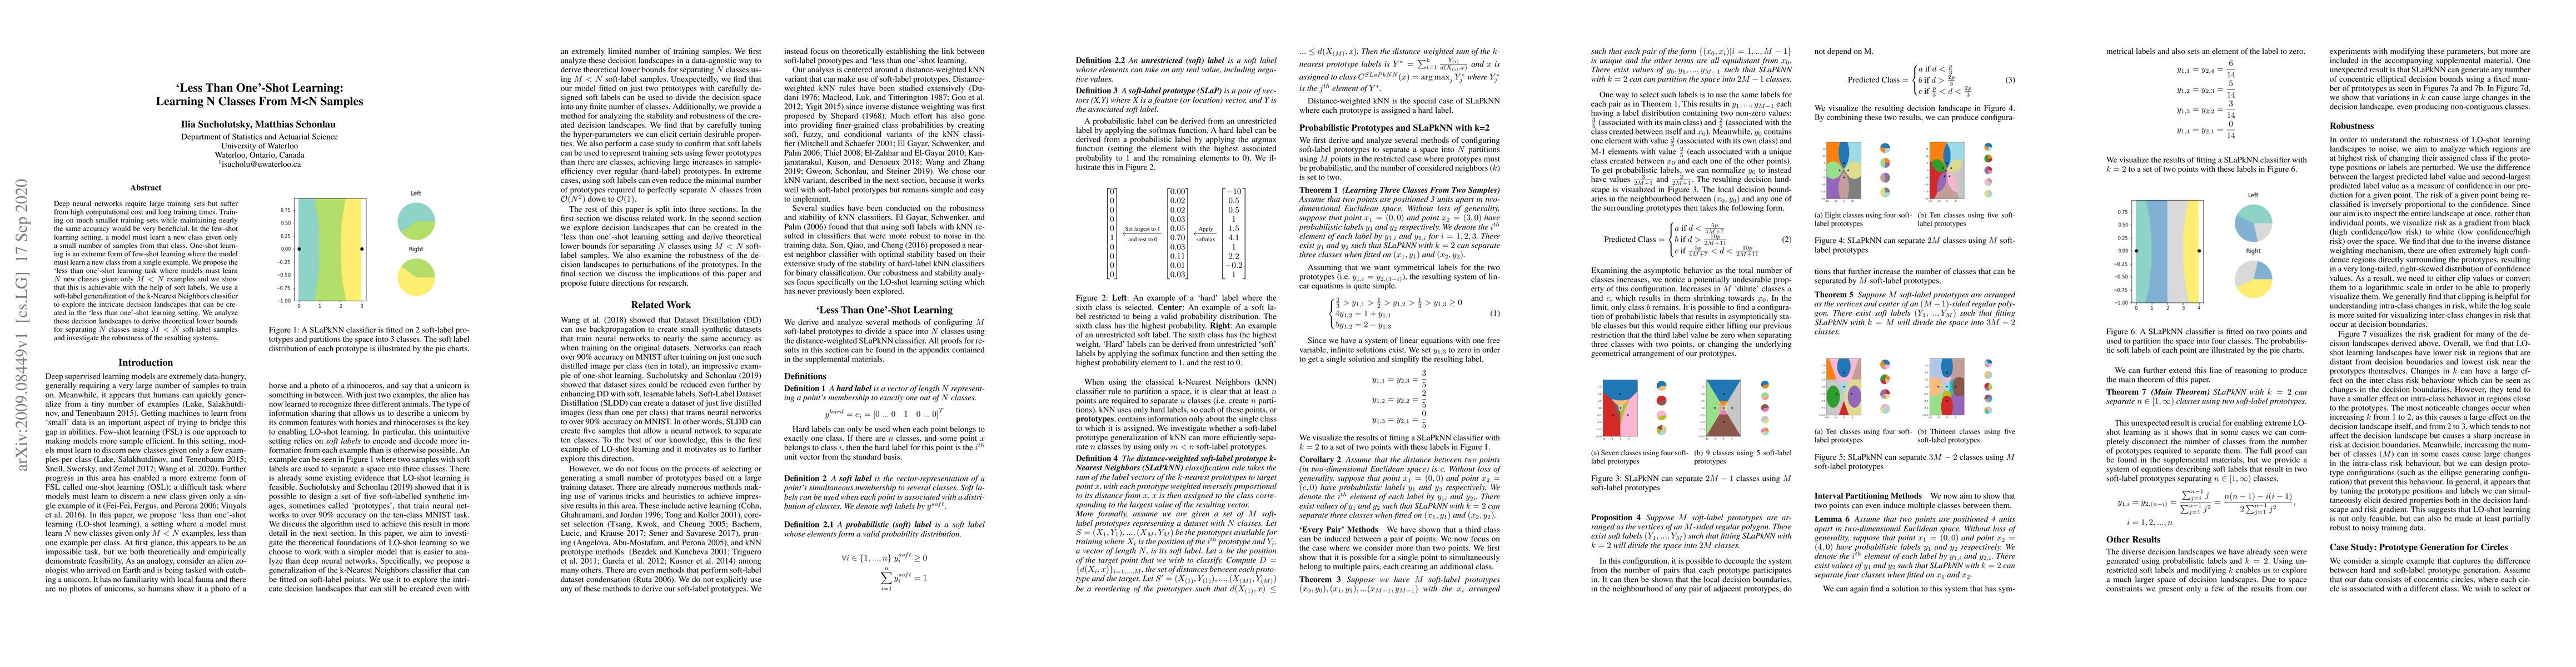
Deep neural networks require large training sets but suffer from high computational cost and long training times. Training on much smaller training sets while maintaining nearly the same accuracy wo...
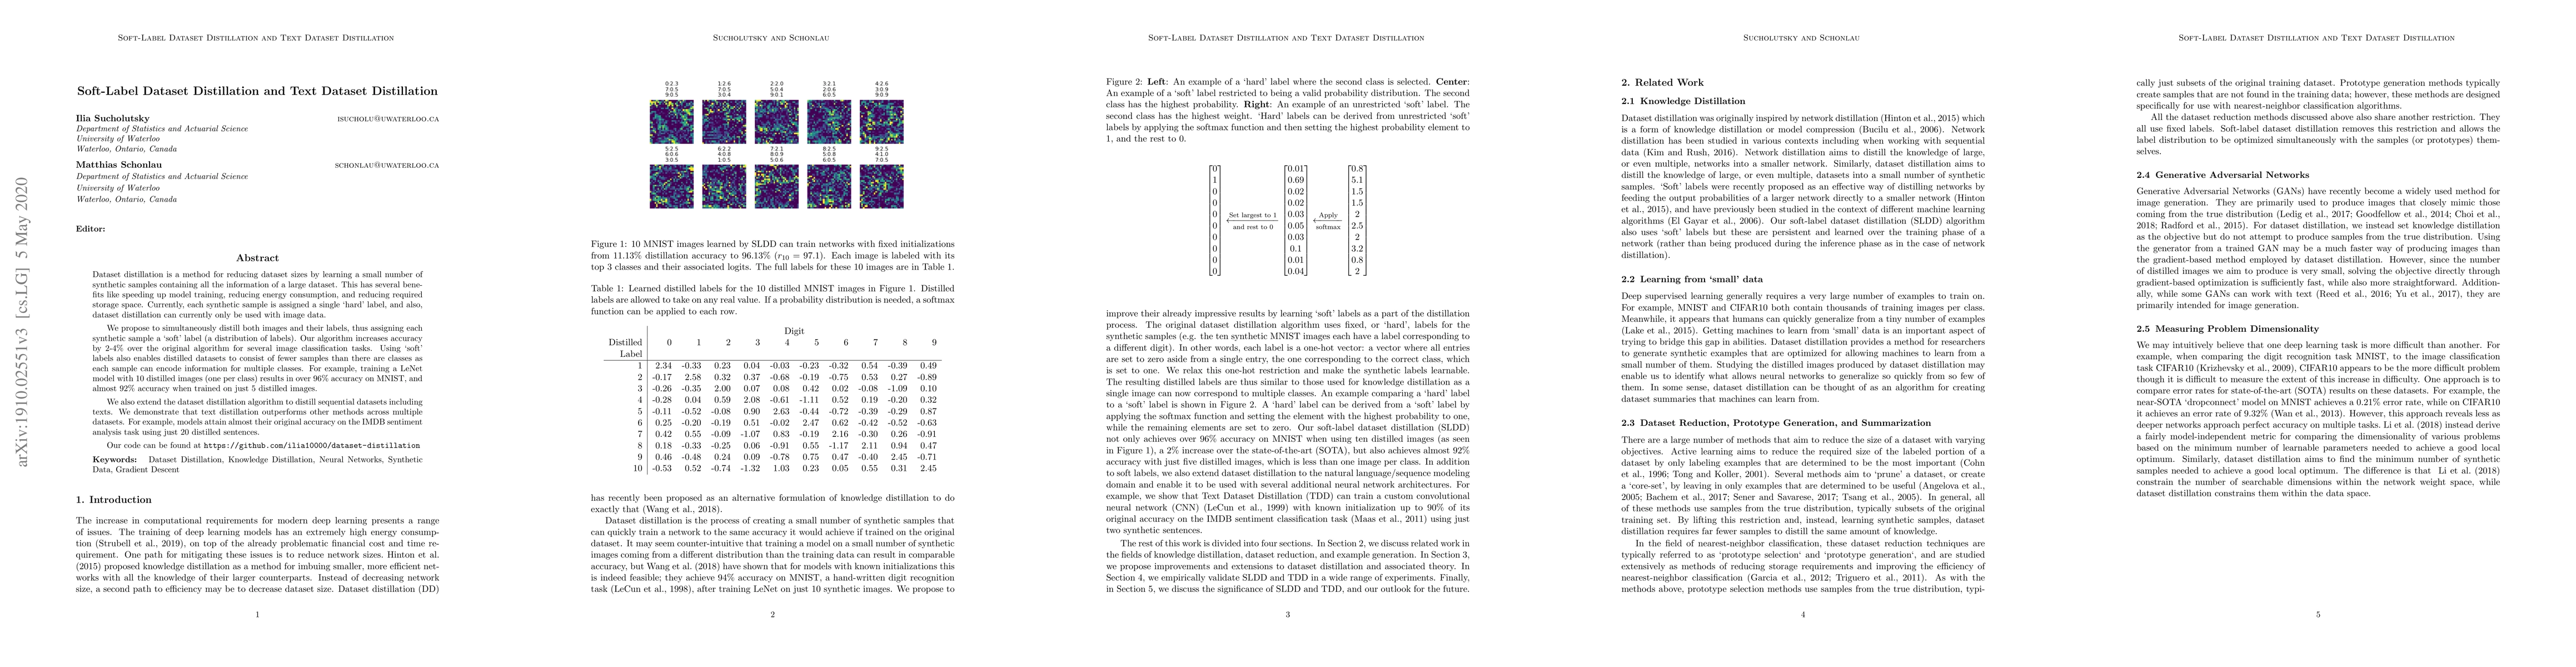
Dataset distillation is a method for reducing dataset sizes by learning a small number of synthetic samples containing all the information of a large dataset. This has several benefits like speeding...
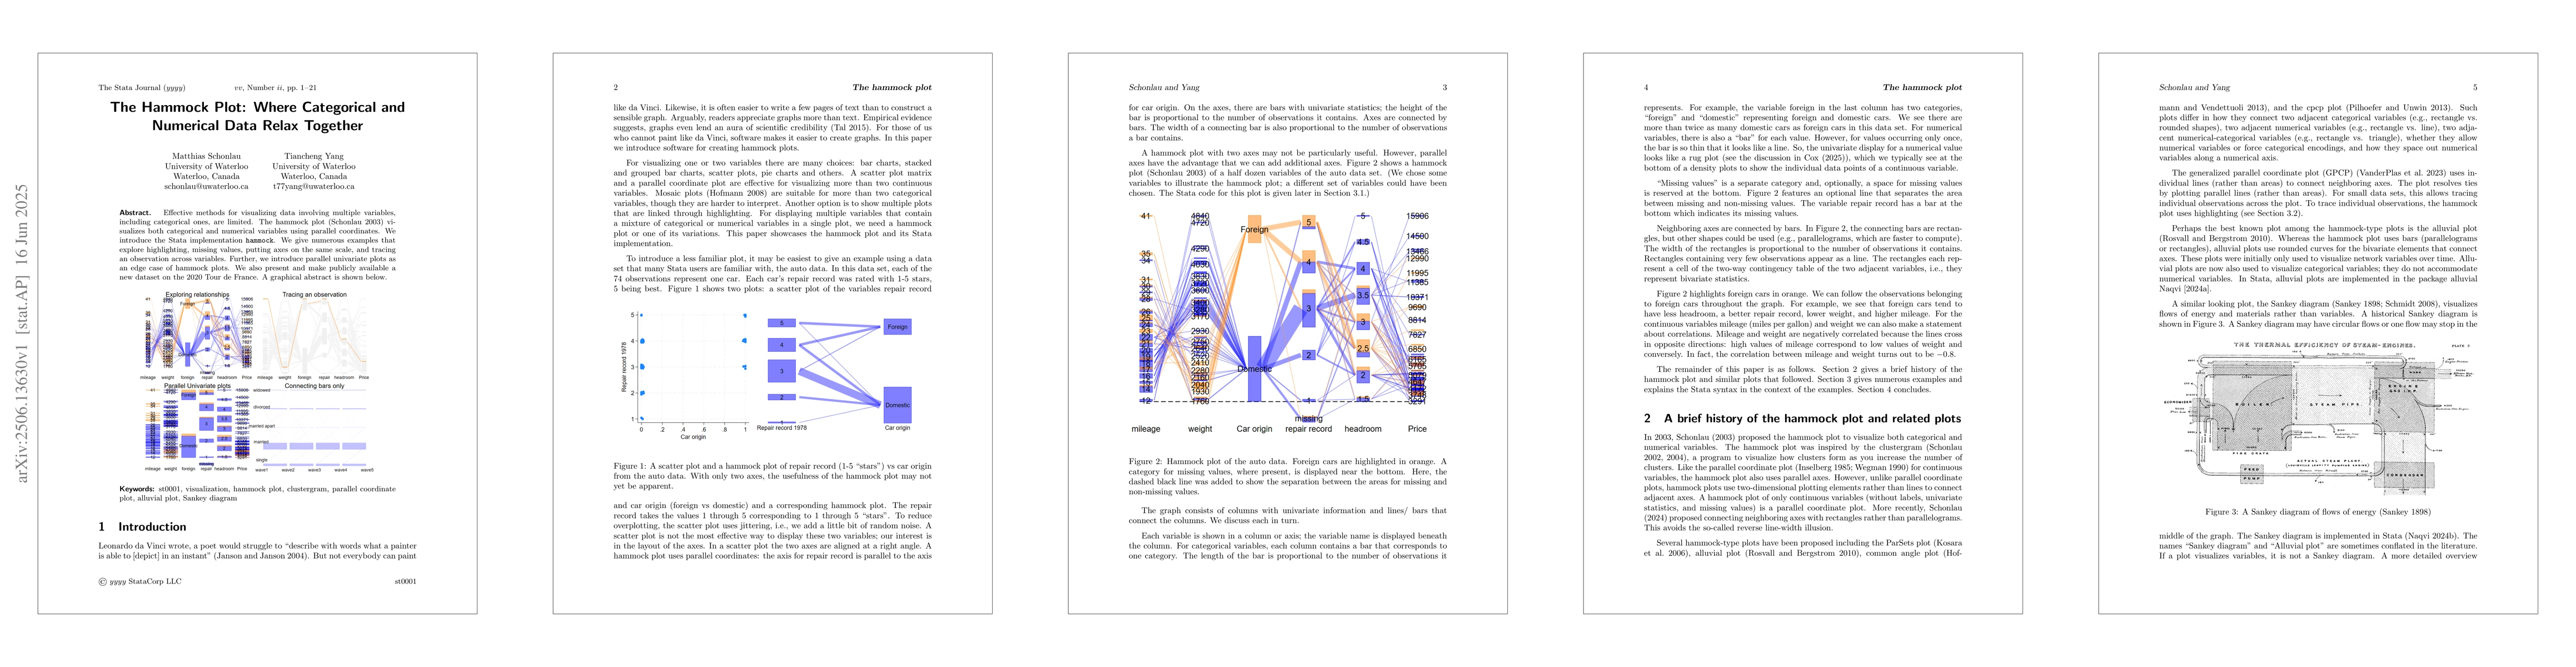
Effective methods for visualizing data involving multiple variables, including categorical ones, are limited. The hammock plot (Schonlau, 2003) visualizes both categorical and numerical variables usin...
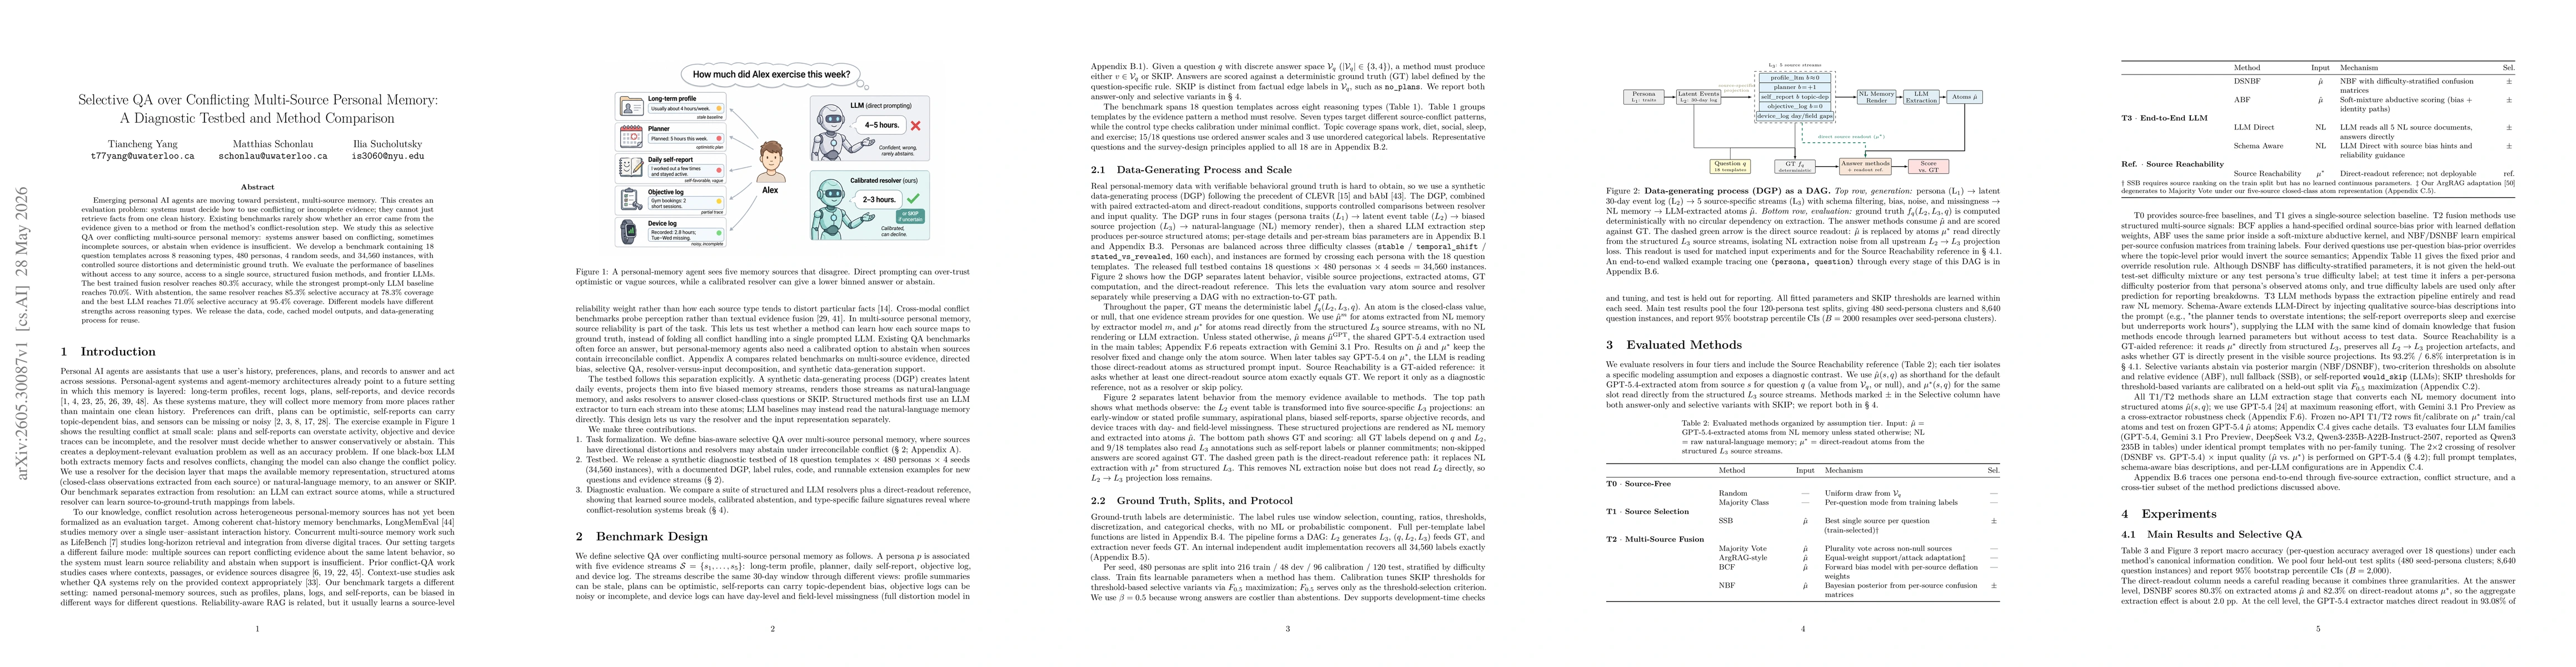
Emerging personal AI agents are moving toward persistent, multi-source memory. This creates an evaluation problem: systems must decide how to use conflicting or incomplete evidence; they cannot just r...