Academic Profile
Statistics
Similar Authors
Papers on arXiv
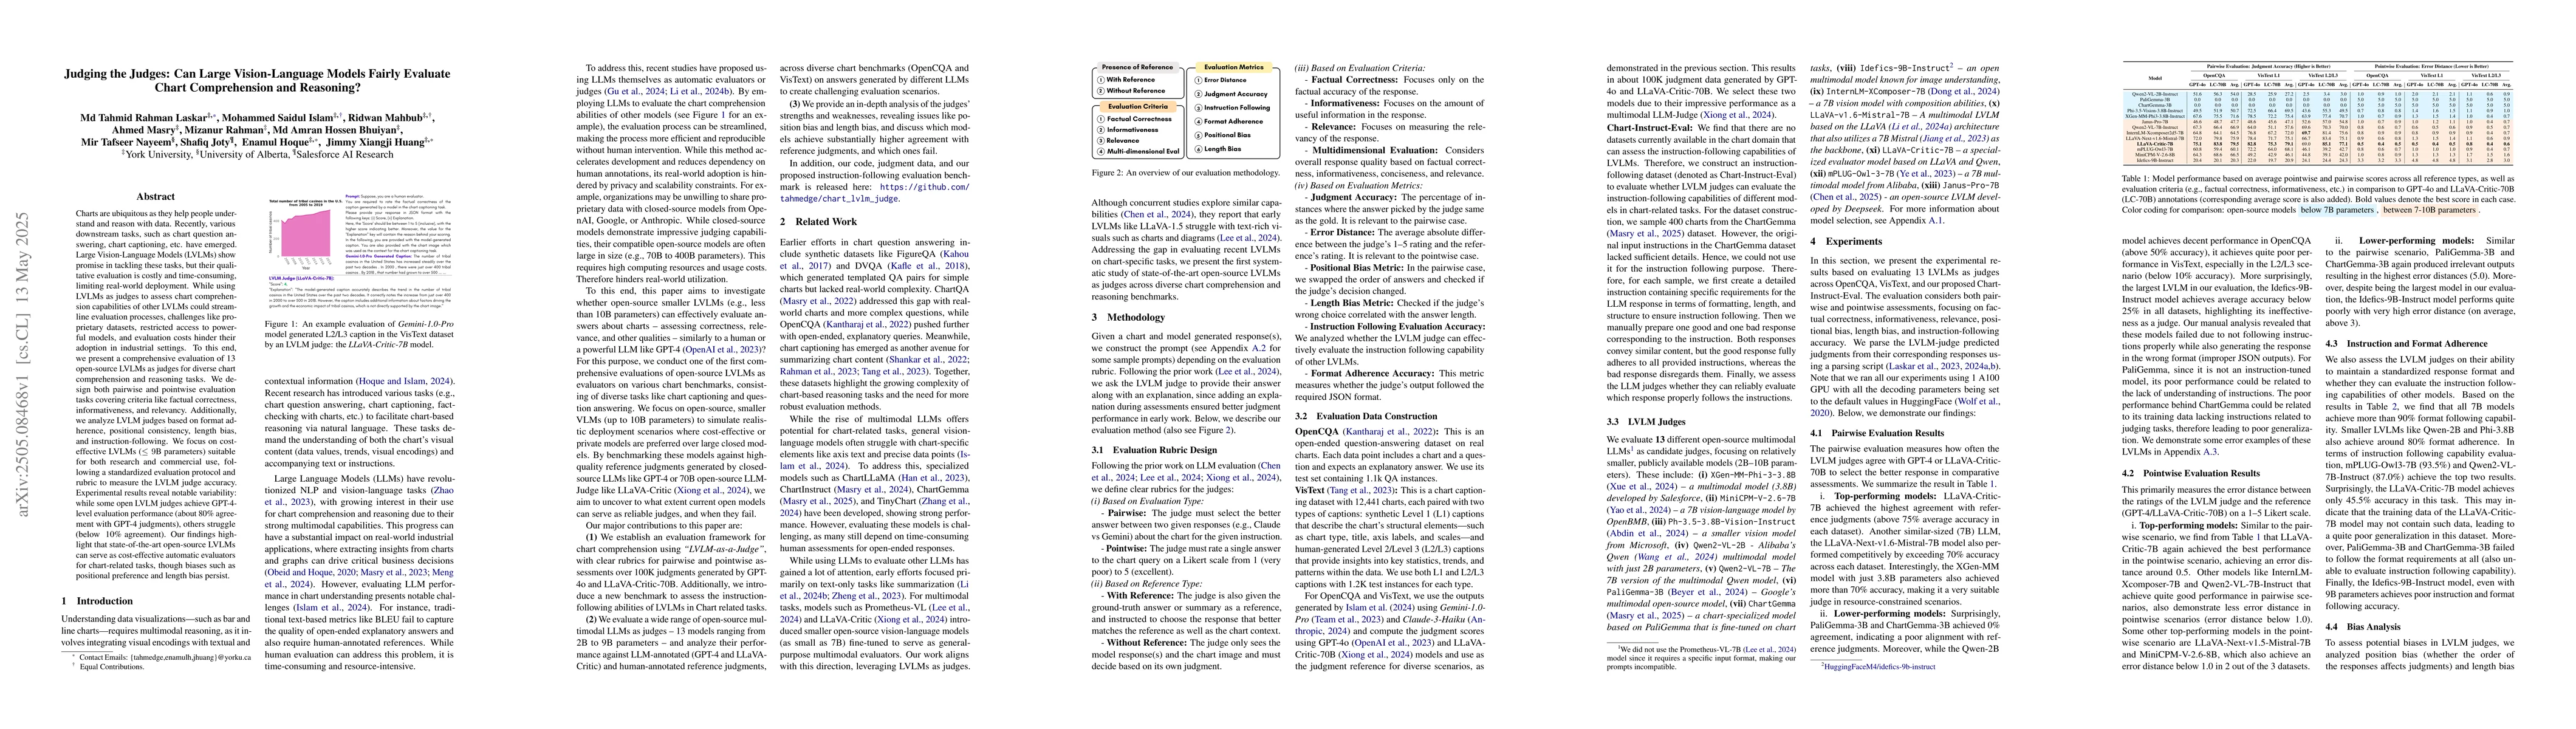
Charts are ubiquitous as they help people understand and reason with data. Recently, various downstream tasks, such as chart question answering, chart2text, and fact-checking, have emerged. Large Visi...
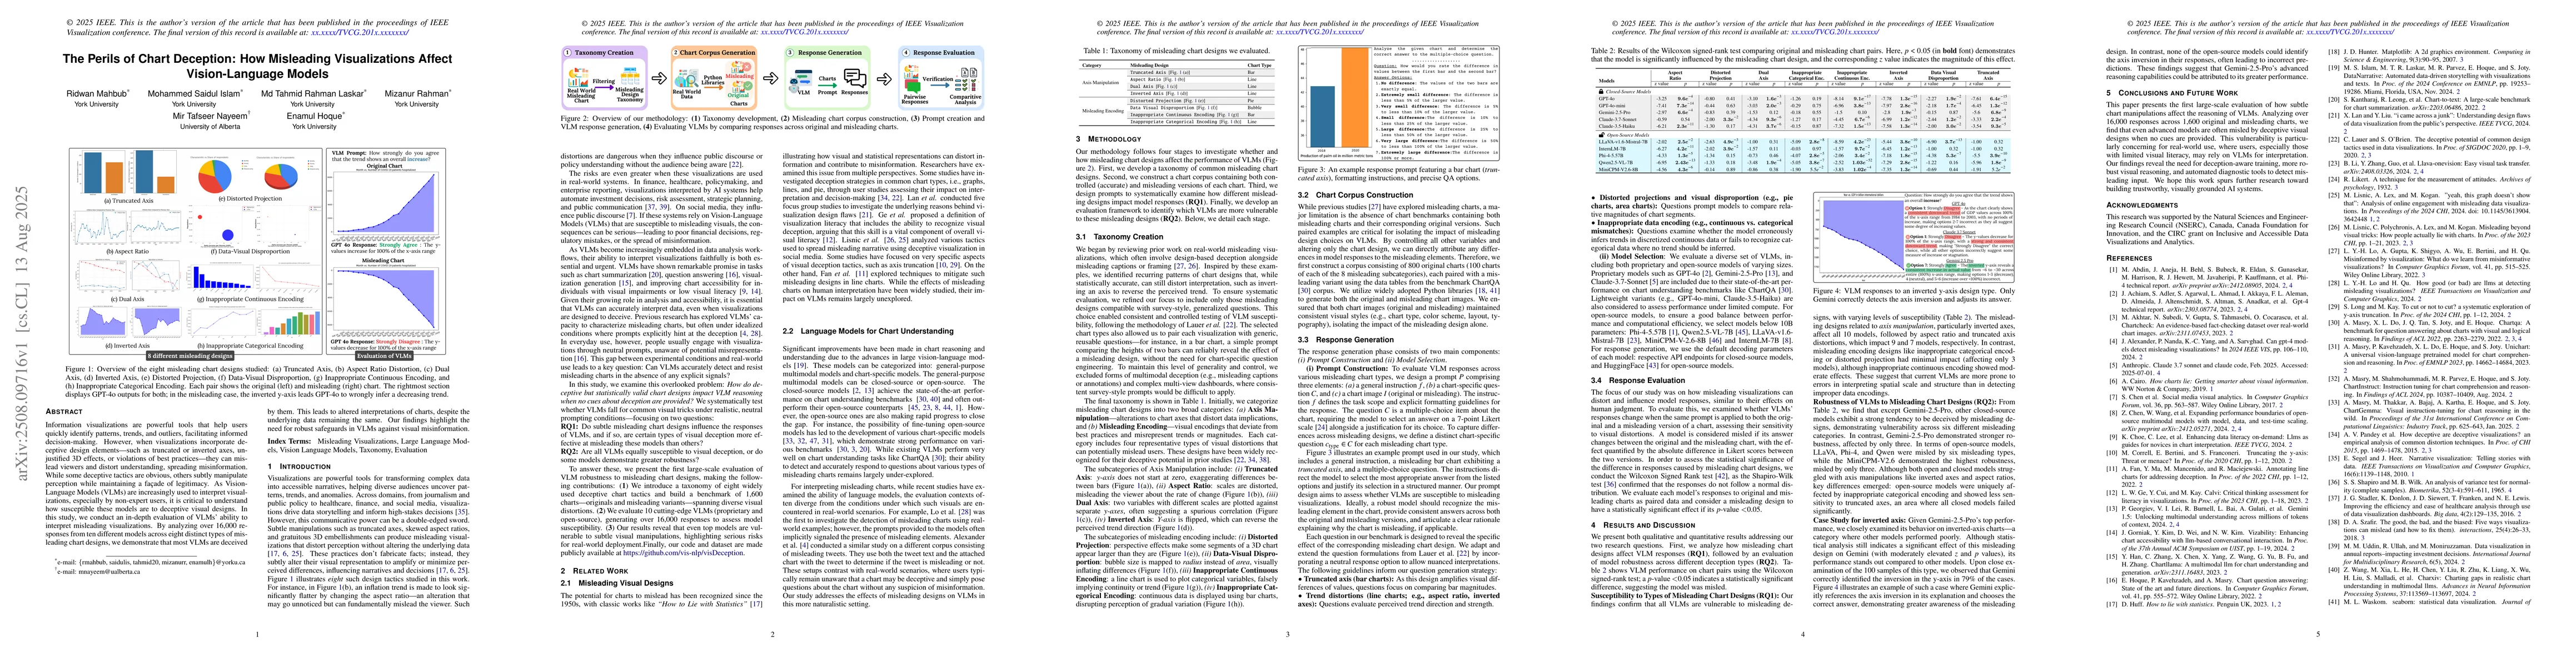
Information visualizations are powerful tools that help users quickly identify patterns, trends, and outliers, facilitating informed decision-making. However, when visualizations incorporate deceptive...
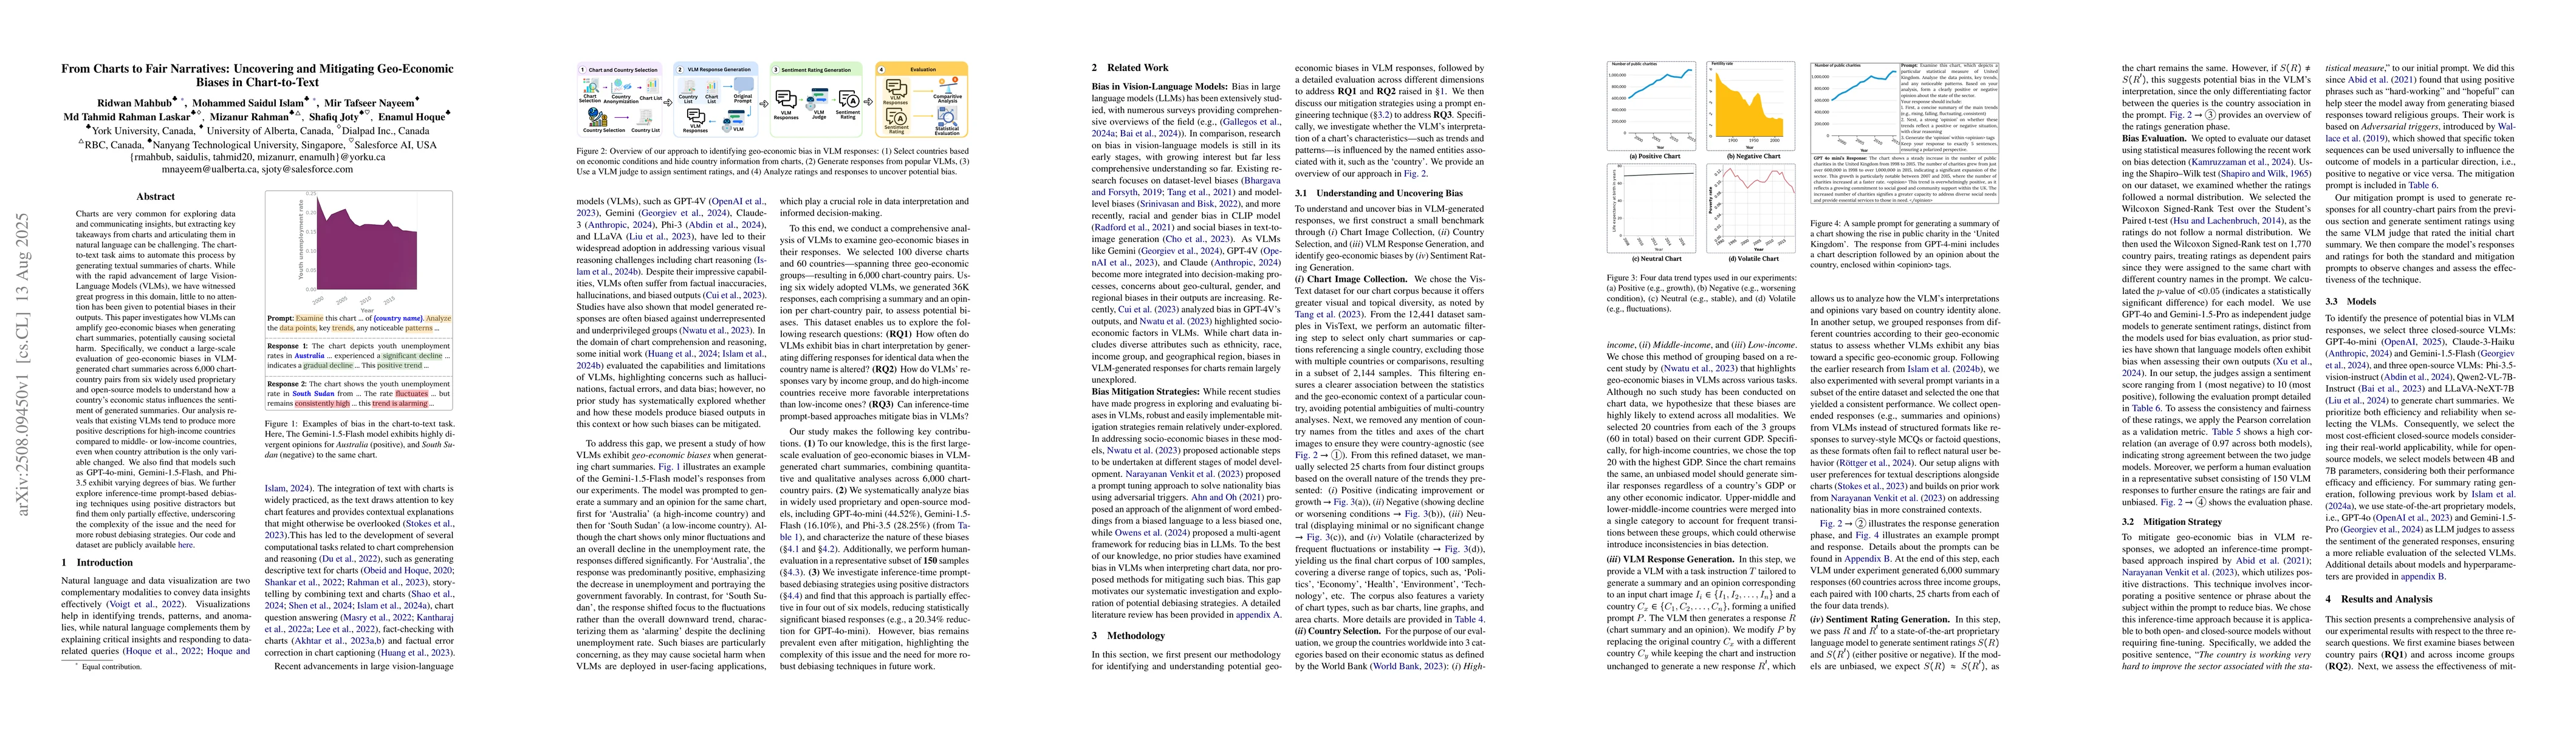
Charts are very common for exploring data and communicating insights, but extracting key takeaways from charts and articulating them in natural language can be challenging. The chart-to-text task aims...
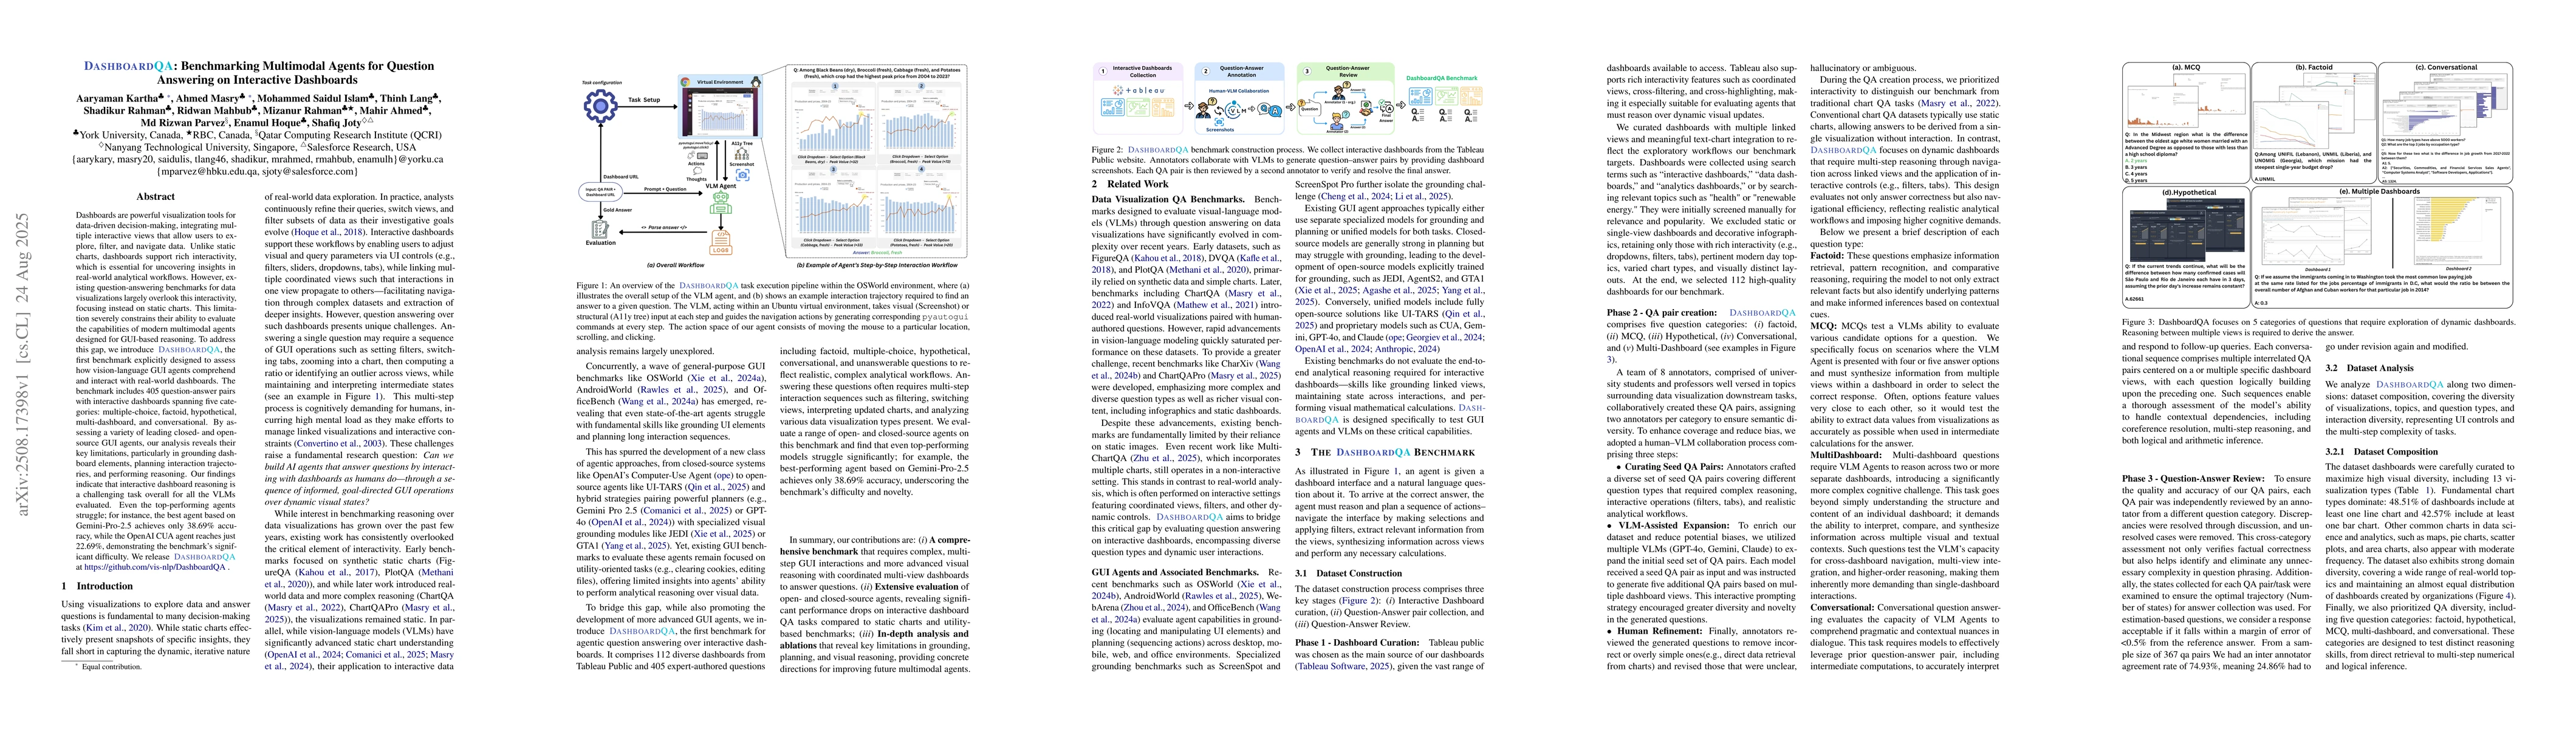
Dashboards are powerful visualization tools for data-driven decision-making, integrating multiple interactive views that allow users to explore, filter, and navigate data. Unlike static charts, dashbo...
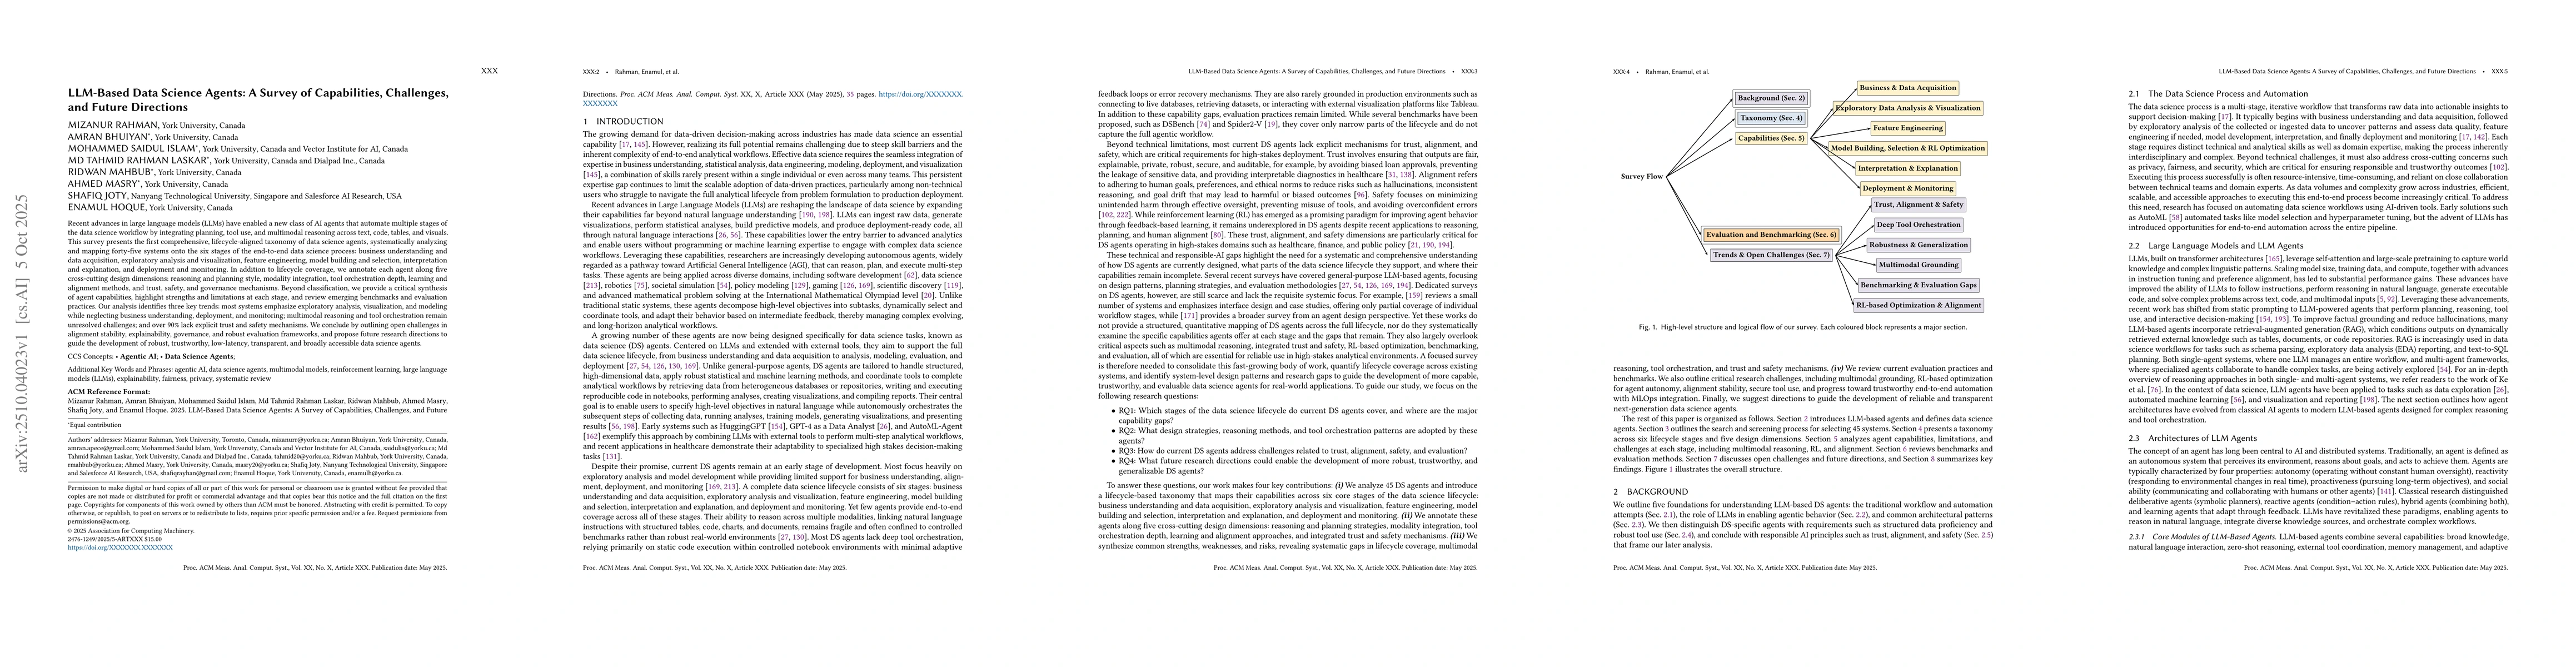
Recent advances in large language models (LLMs) have enabled a new class of AI agents that automate multiple stages of the data science workflow by integrating planning, tool use, and multimodal reaso...

Large Vision-Language Models (LVLMs) with only 7B parameters have shown promise as automated judges in chart comprehension tasks. However, tiny models (<=2B parameters) still perform poorly as judges,...
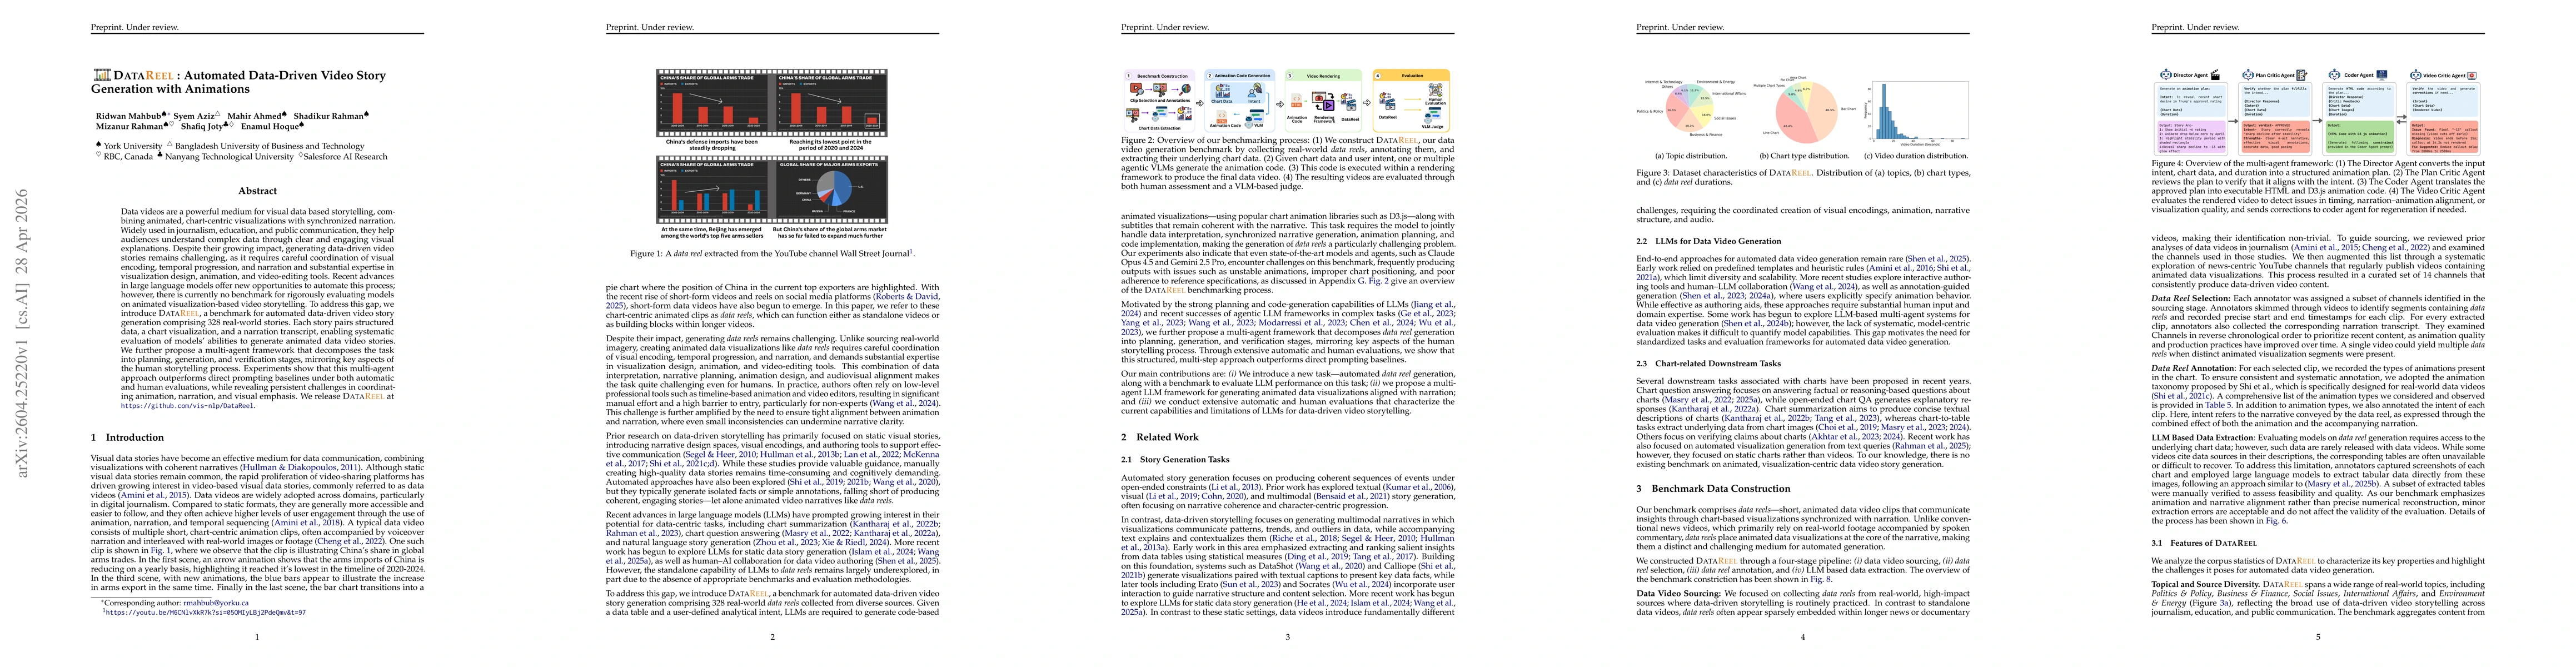
Data videos are a powerful medium for visual data based storytelling, combining animated, chart-centric visualizations with synchronized narration. Widely used in journalism, education, and public com...