Academic Profile
Statistics
Similar Authors
Papers on arXiv
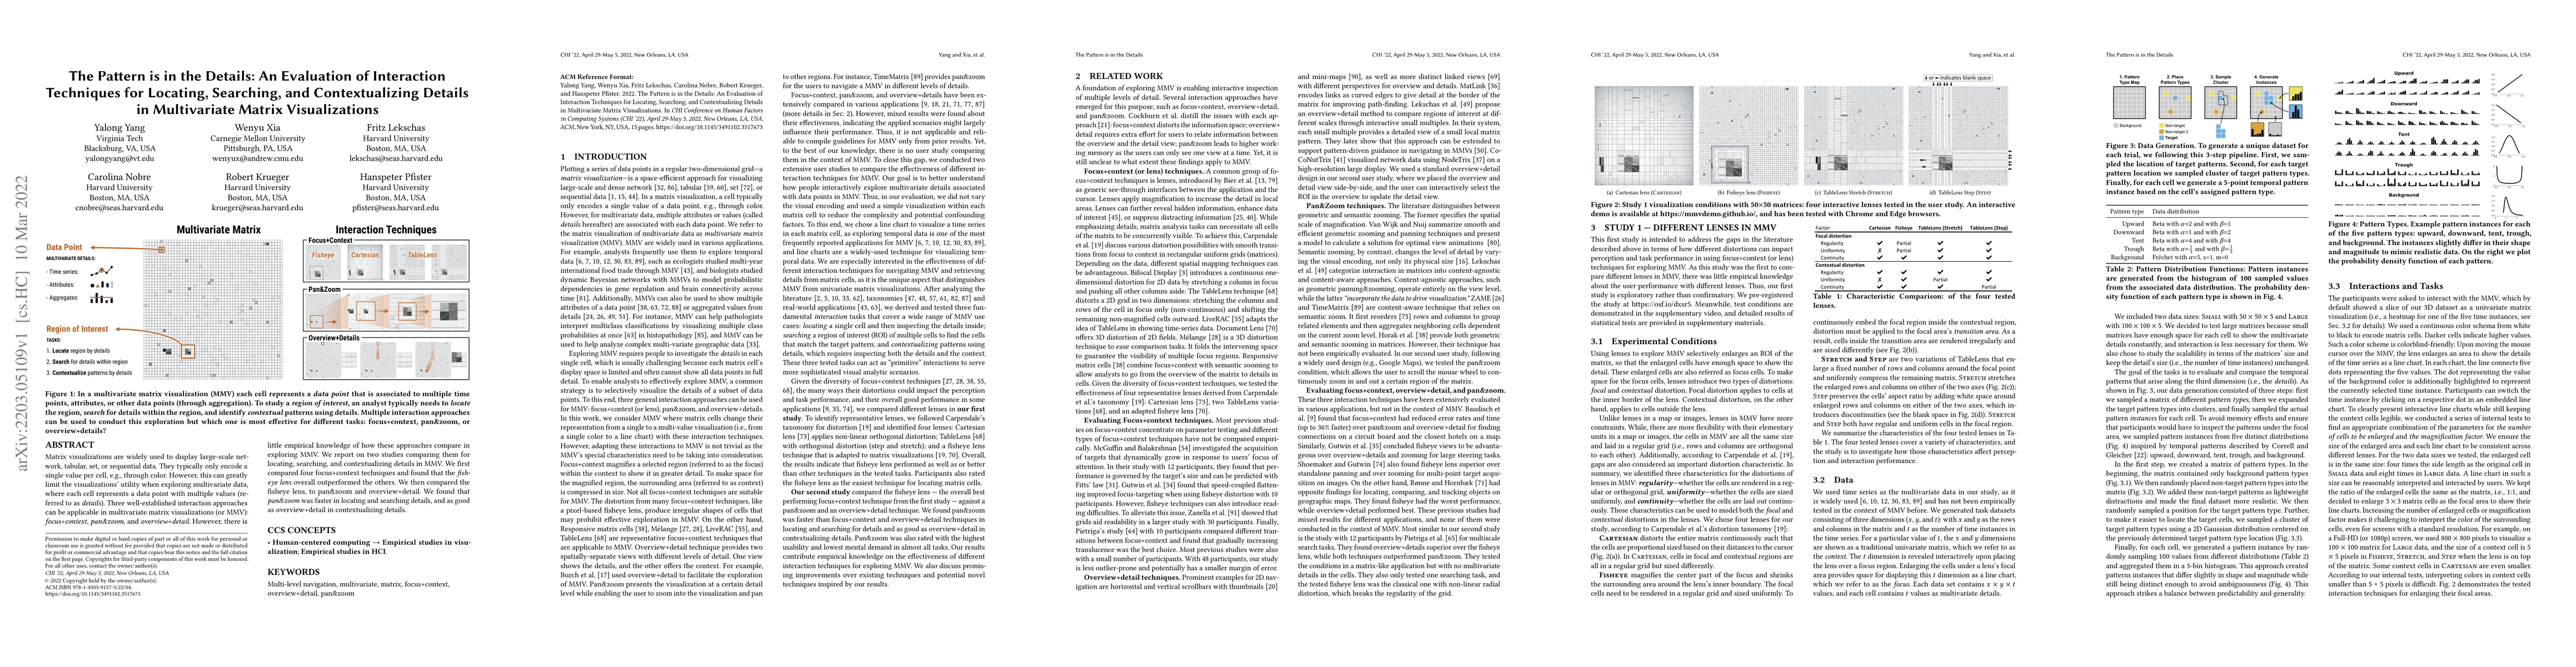
Matrix visualizations are widely used to display large-scale network, tabular, set, or sequential data. They typically only encode a single value per cell, e.g., through color. However, this can gre...
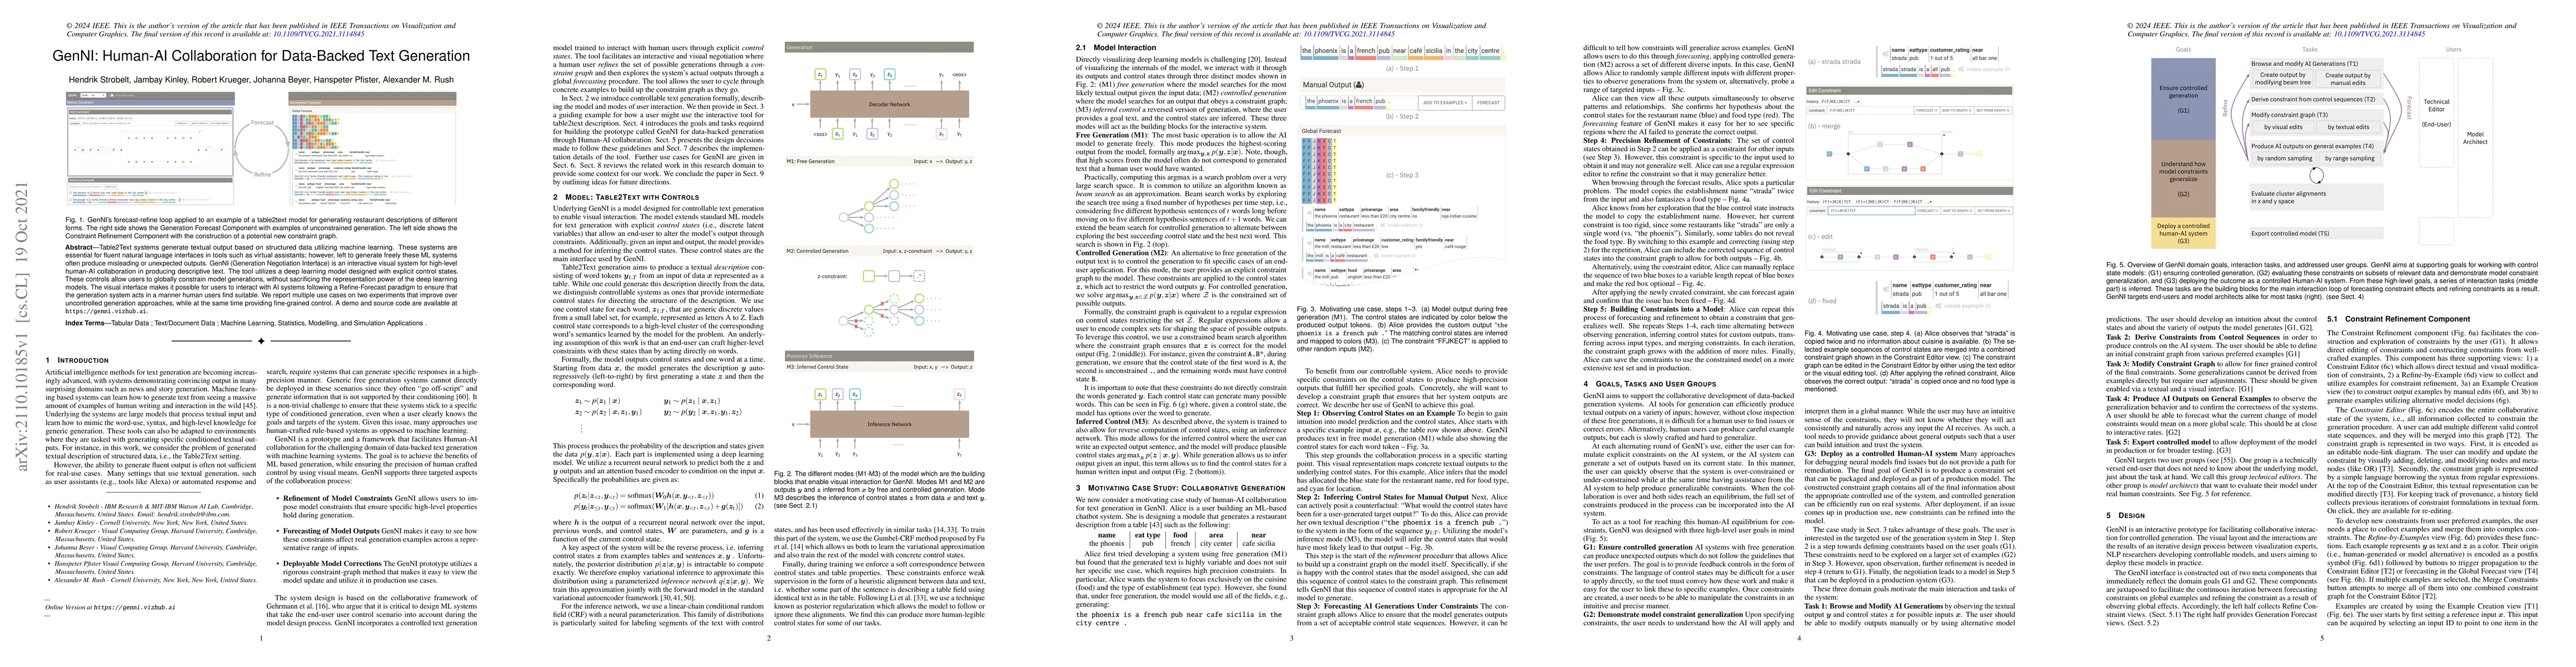
Table2Text systems generate textual output based on structured data utilizing machine learning. These systems are essential for fluent natural language interfaces in tools such as virtual assistants...
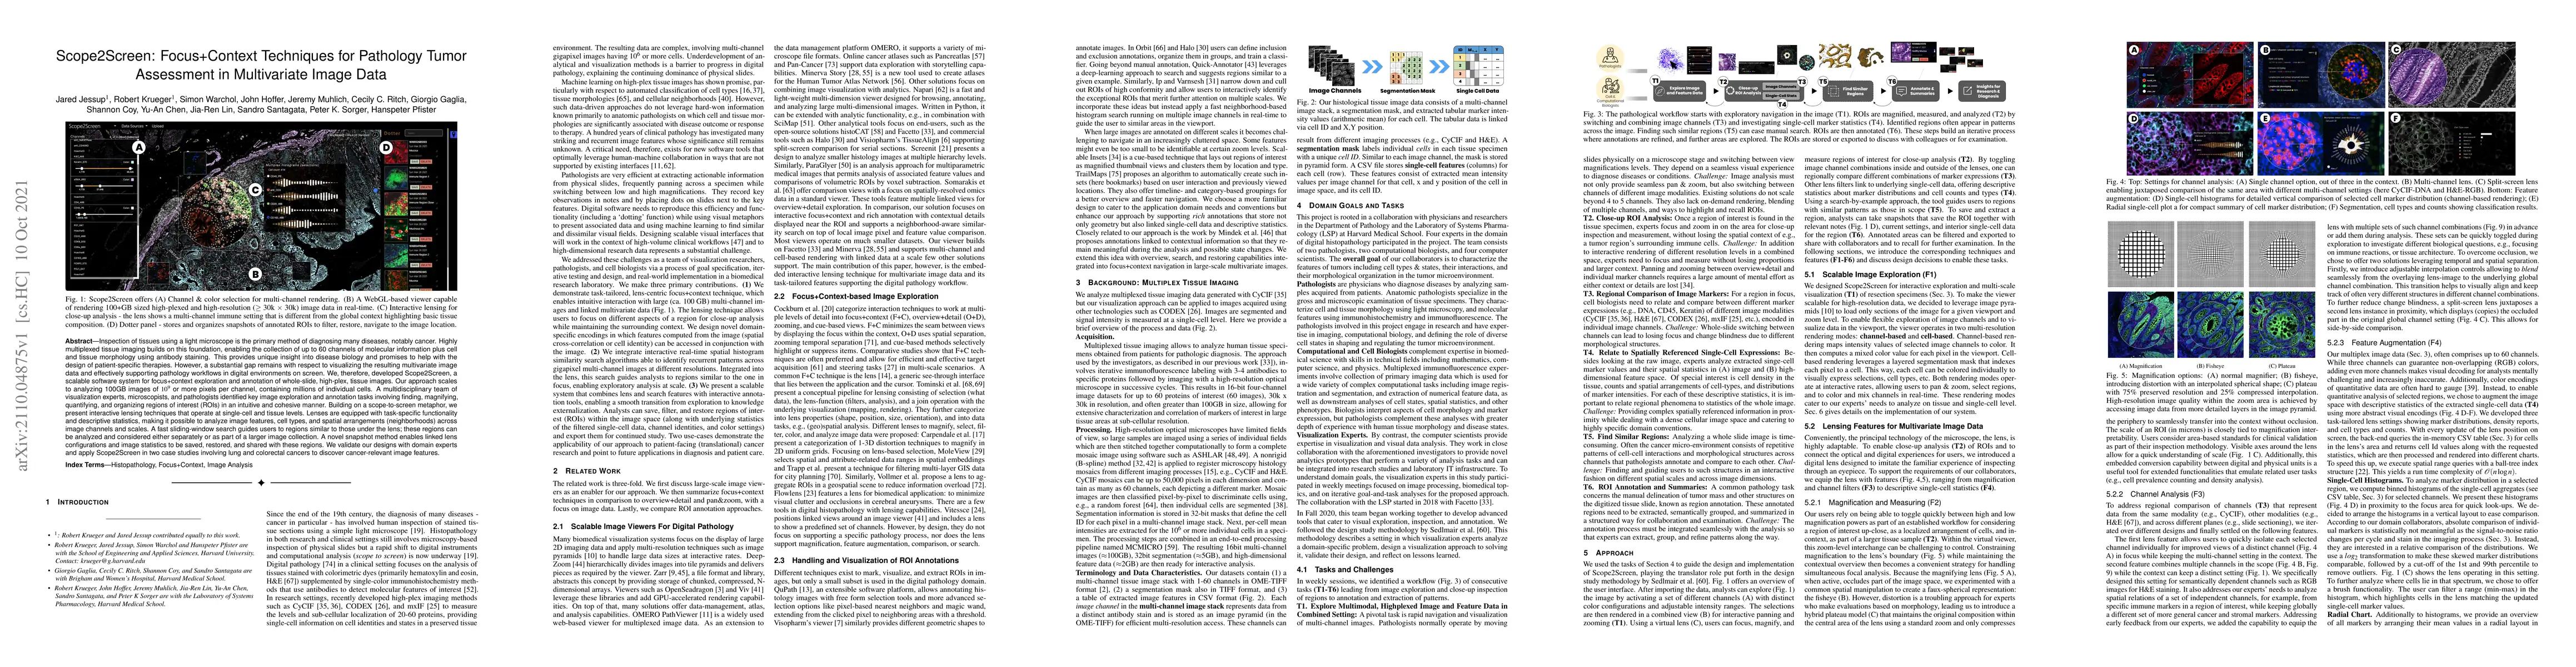
Inspection of tissues using a light microscope is the primary method of diagnosing many diseases, notably cancer. Highly multiplexed tissue imaging builds on this foundation, enabling the collection...