Academic Profile
Statistics
Similar Authors
Papers on arXiv
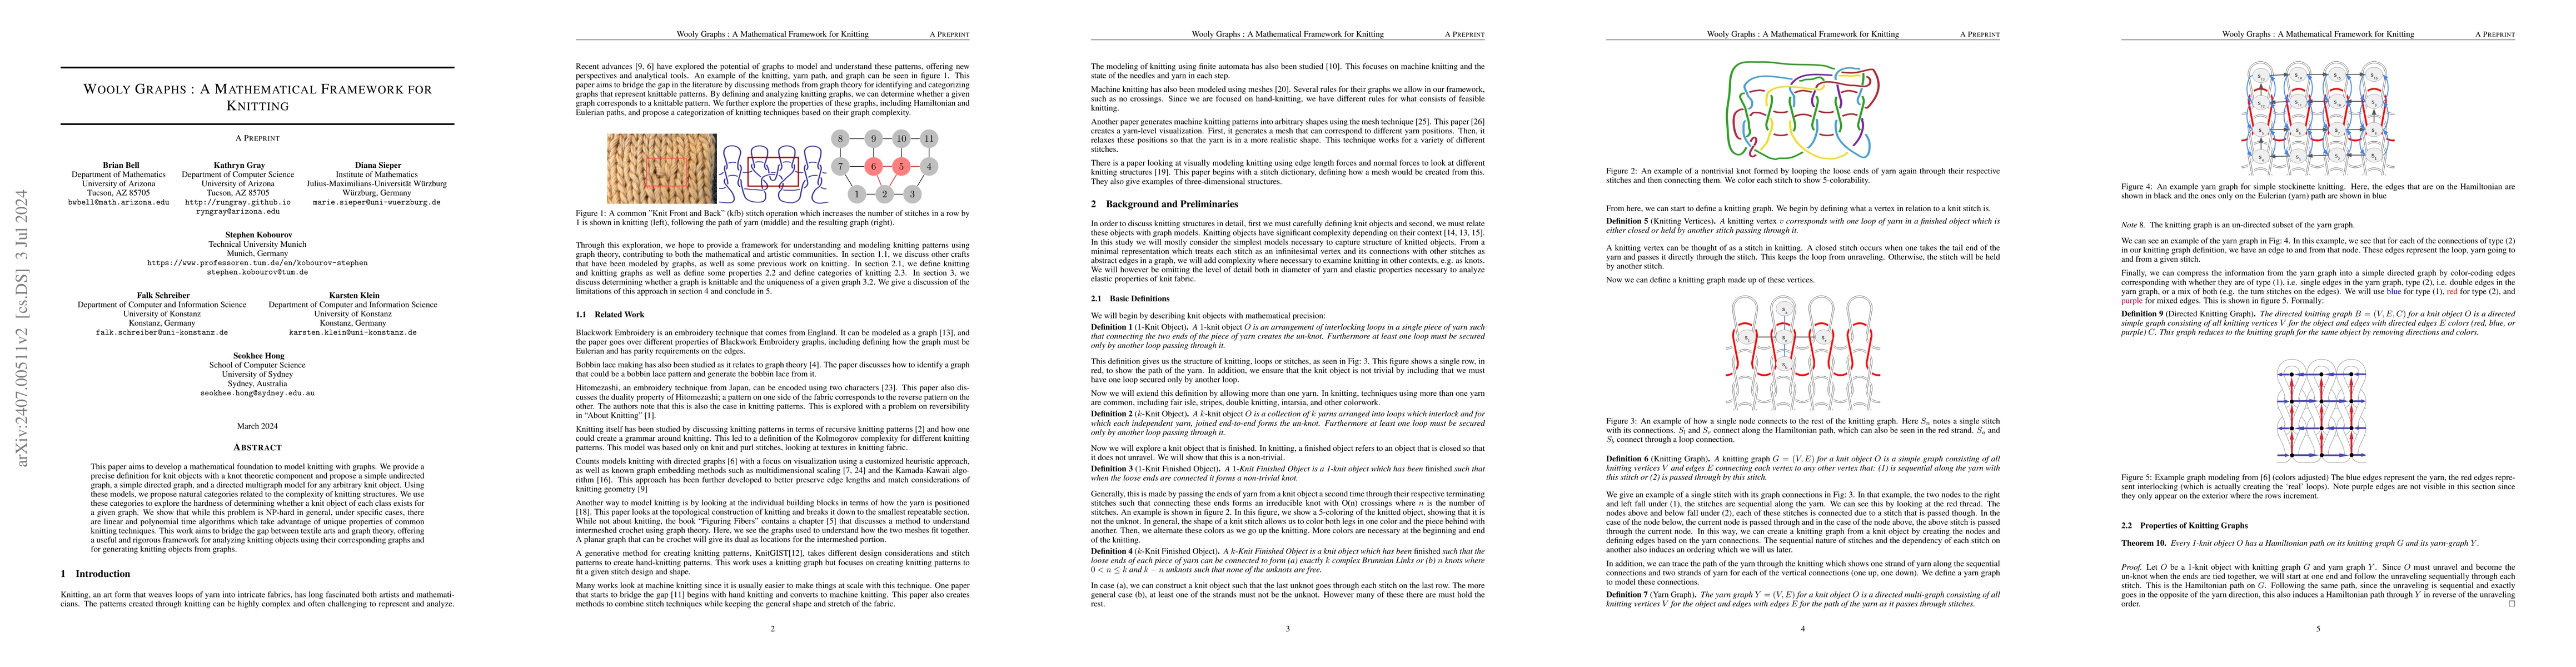
This paper aims to develop a mathematical foundation to model knitting with graphs. We provide a precise definition for knit objects with a knot theoretic component and propose a simple undirected g...
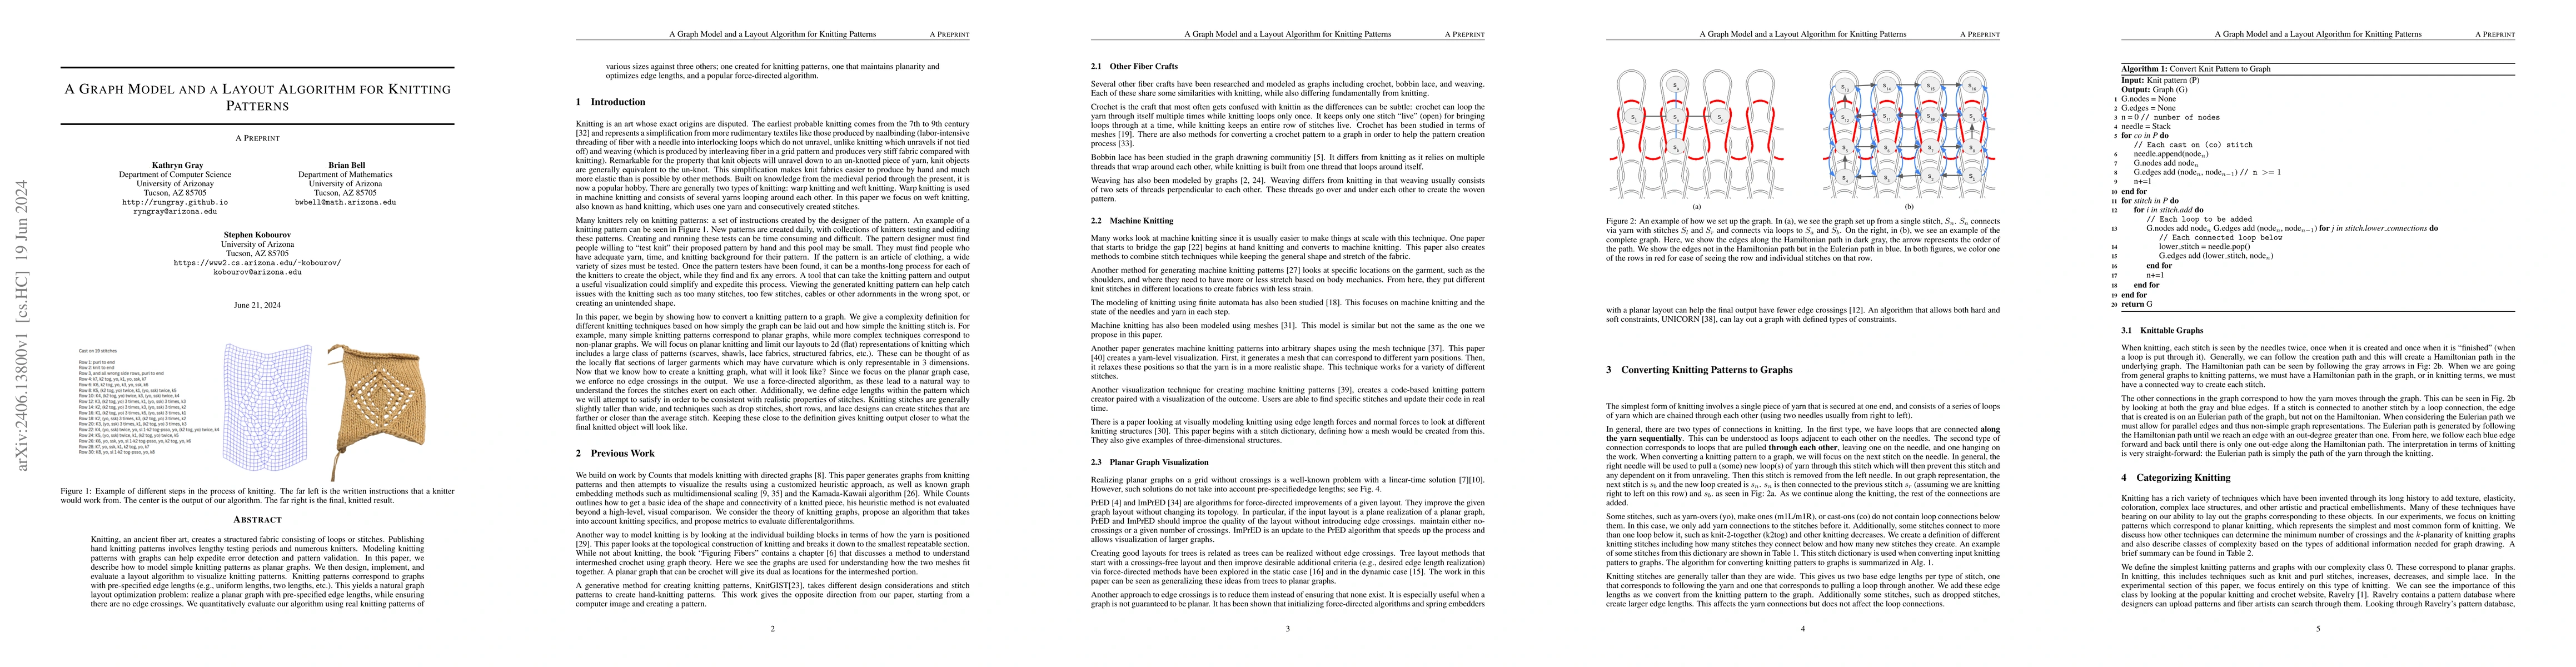
Knitting, an ancient fiber art, creates a structured fabric consisting of loops or stitches. Publishing hand knitting patterns involves lengthy testing periods and numerous knitters. Modeling knitti...
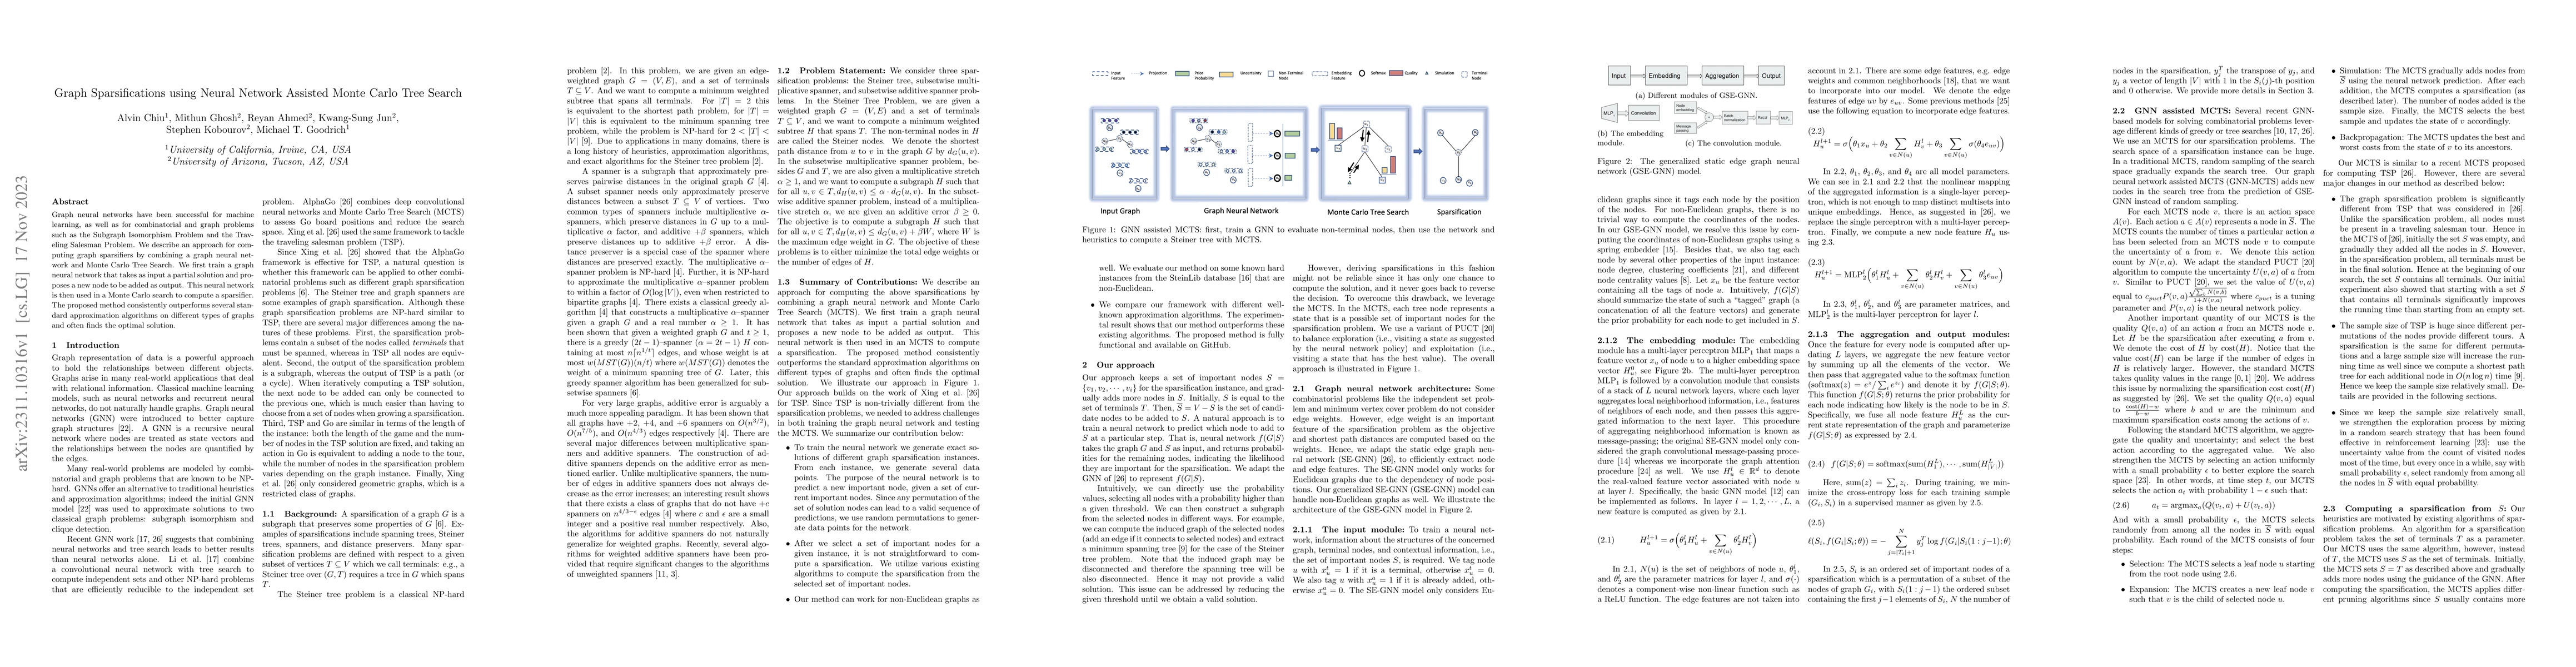
Graph neural networks have been successful for machine learning, as well as for combinatorial and graph problems such as the Subgraph Isomorphism Problem and the Traveling Salesman Problem. We descr...
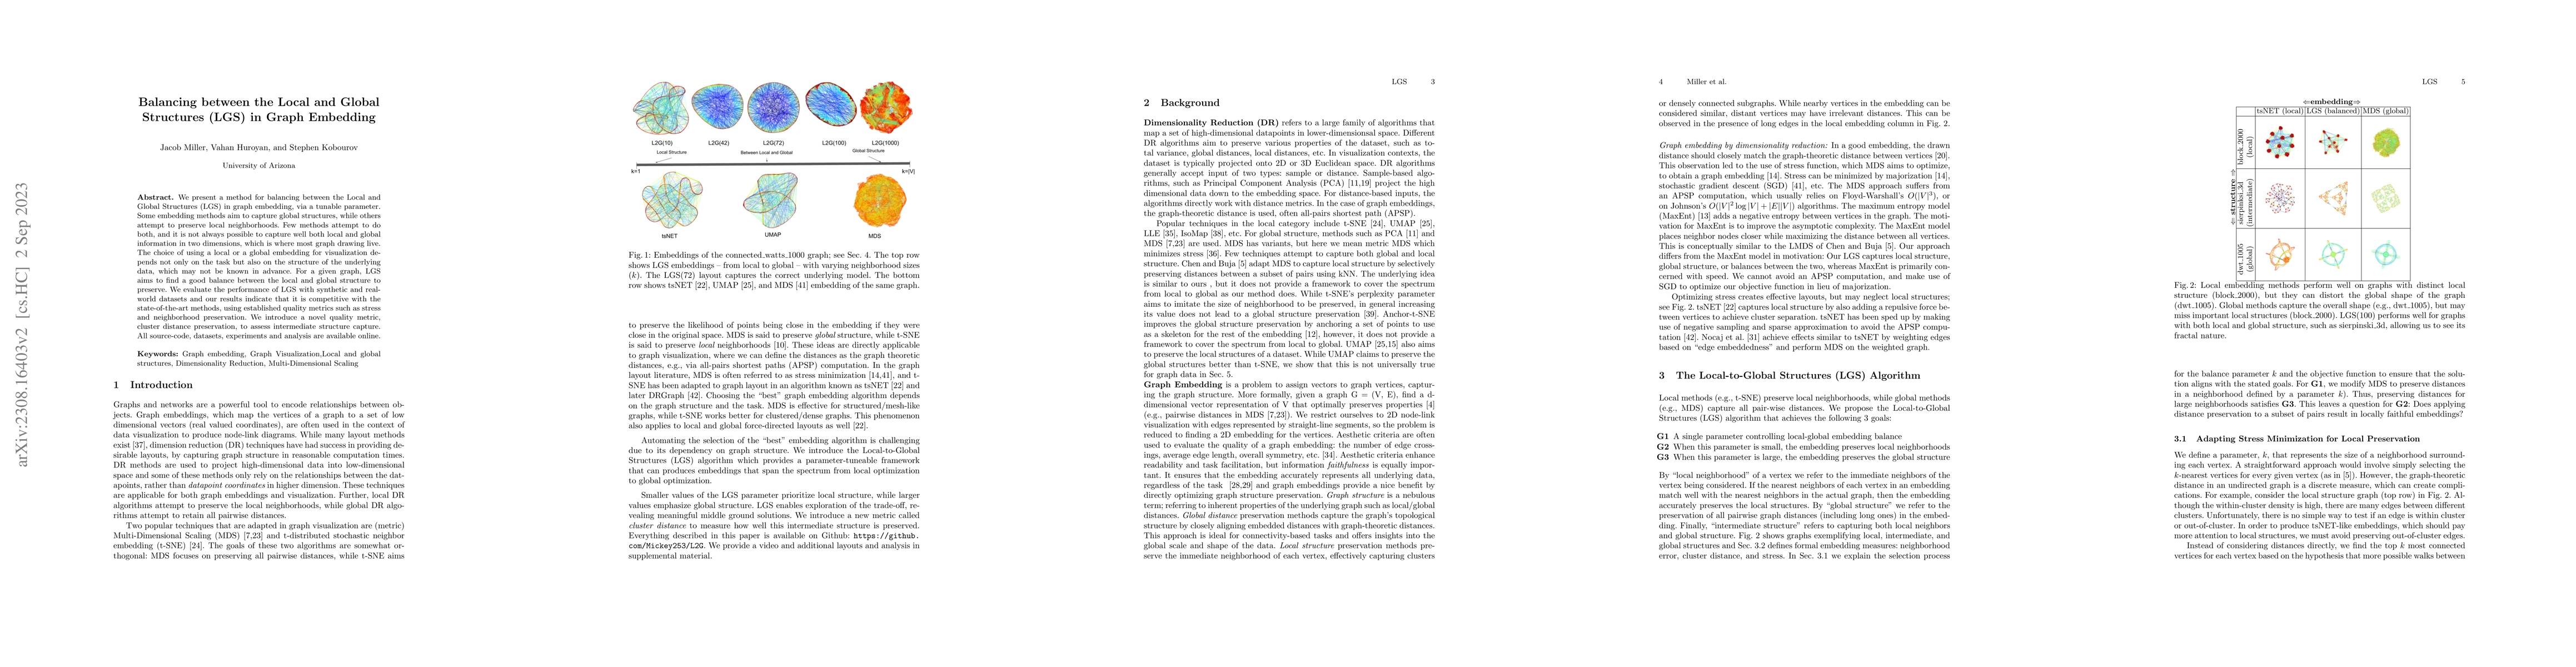
We present a method for balancing between the Local and Global Structures (LGS) in graph embedding, via a tunable parameter. Some embedding methods aim to capture global structures, while others att...
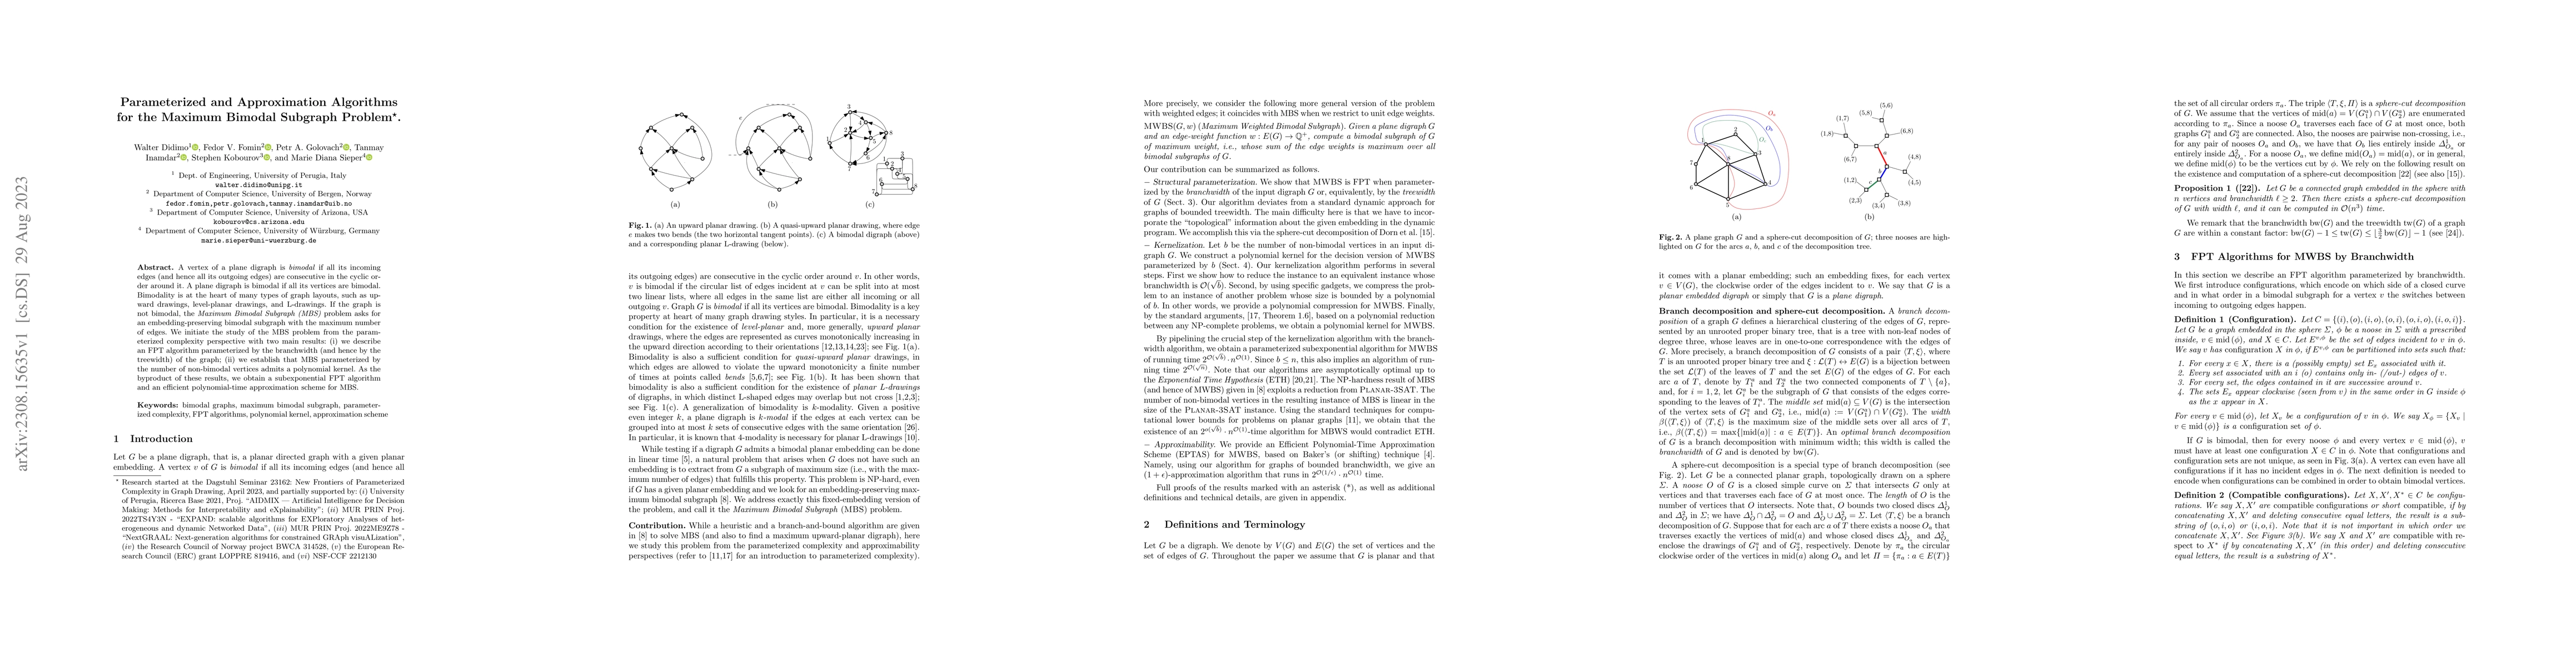
A vertex of a plane digraph is bimodal if all its incoming edges (and hence all its outgoing edges) are consecutive in the cyclic order around it. A plane digraph is bimodal if all its vertices are ...
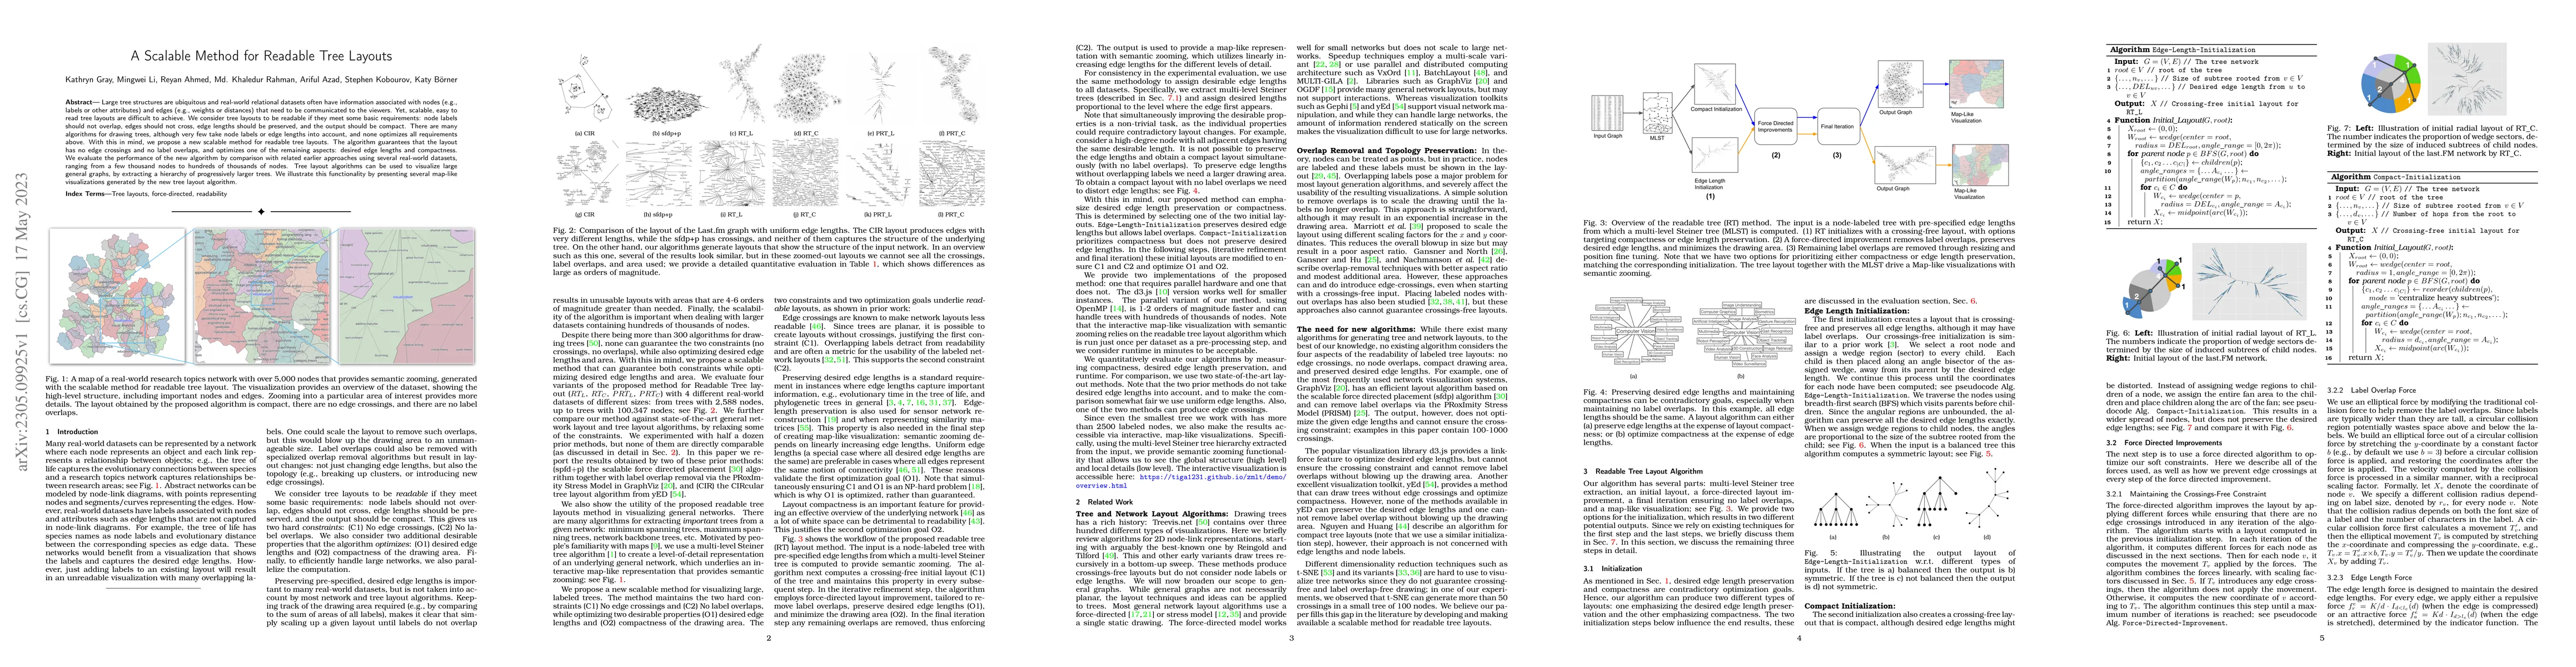
Large tree structures are ubiquitous and real-world relational datasets often have information associated with nodes (e.g., labels or other attributes) and edges (e.g., weights or distances) that ne...
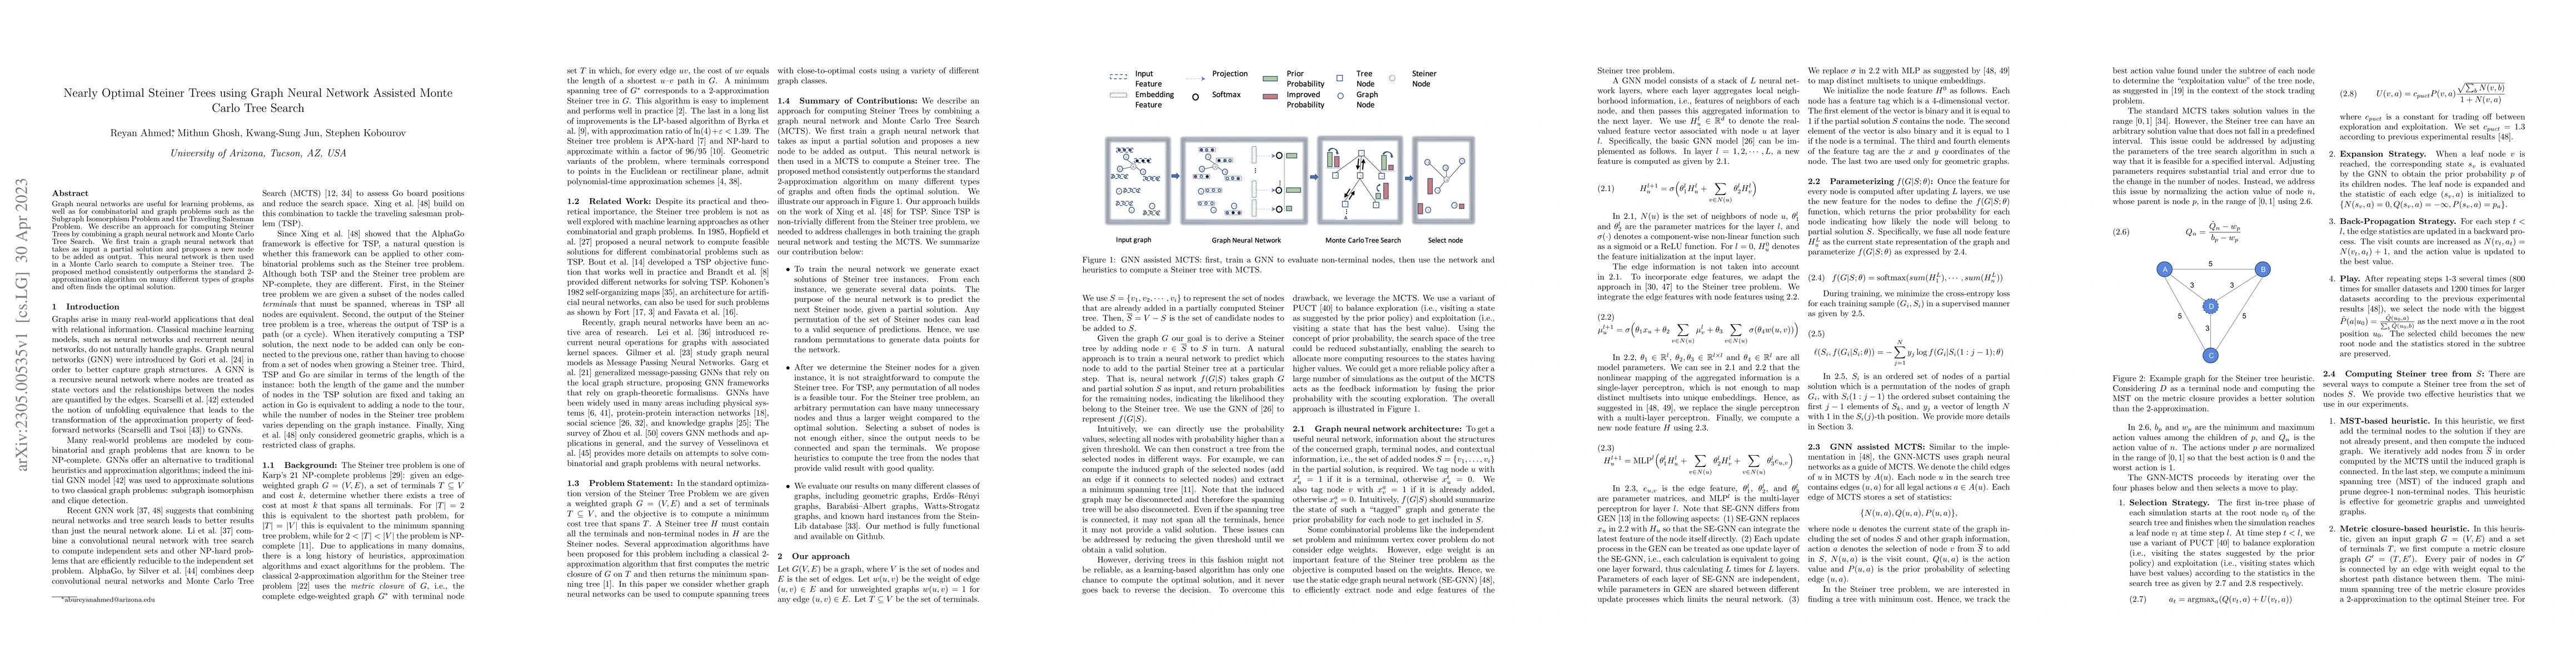
Graph neural networks are useful for learning problems, as well as for combinatorial and graph problems such as the Subgraph Isomorphism Problem and the Traveling Salesman Problem. We describe an ap...
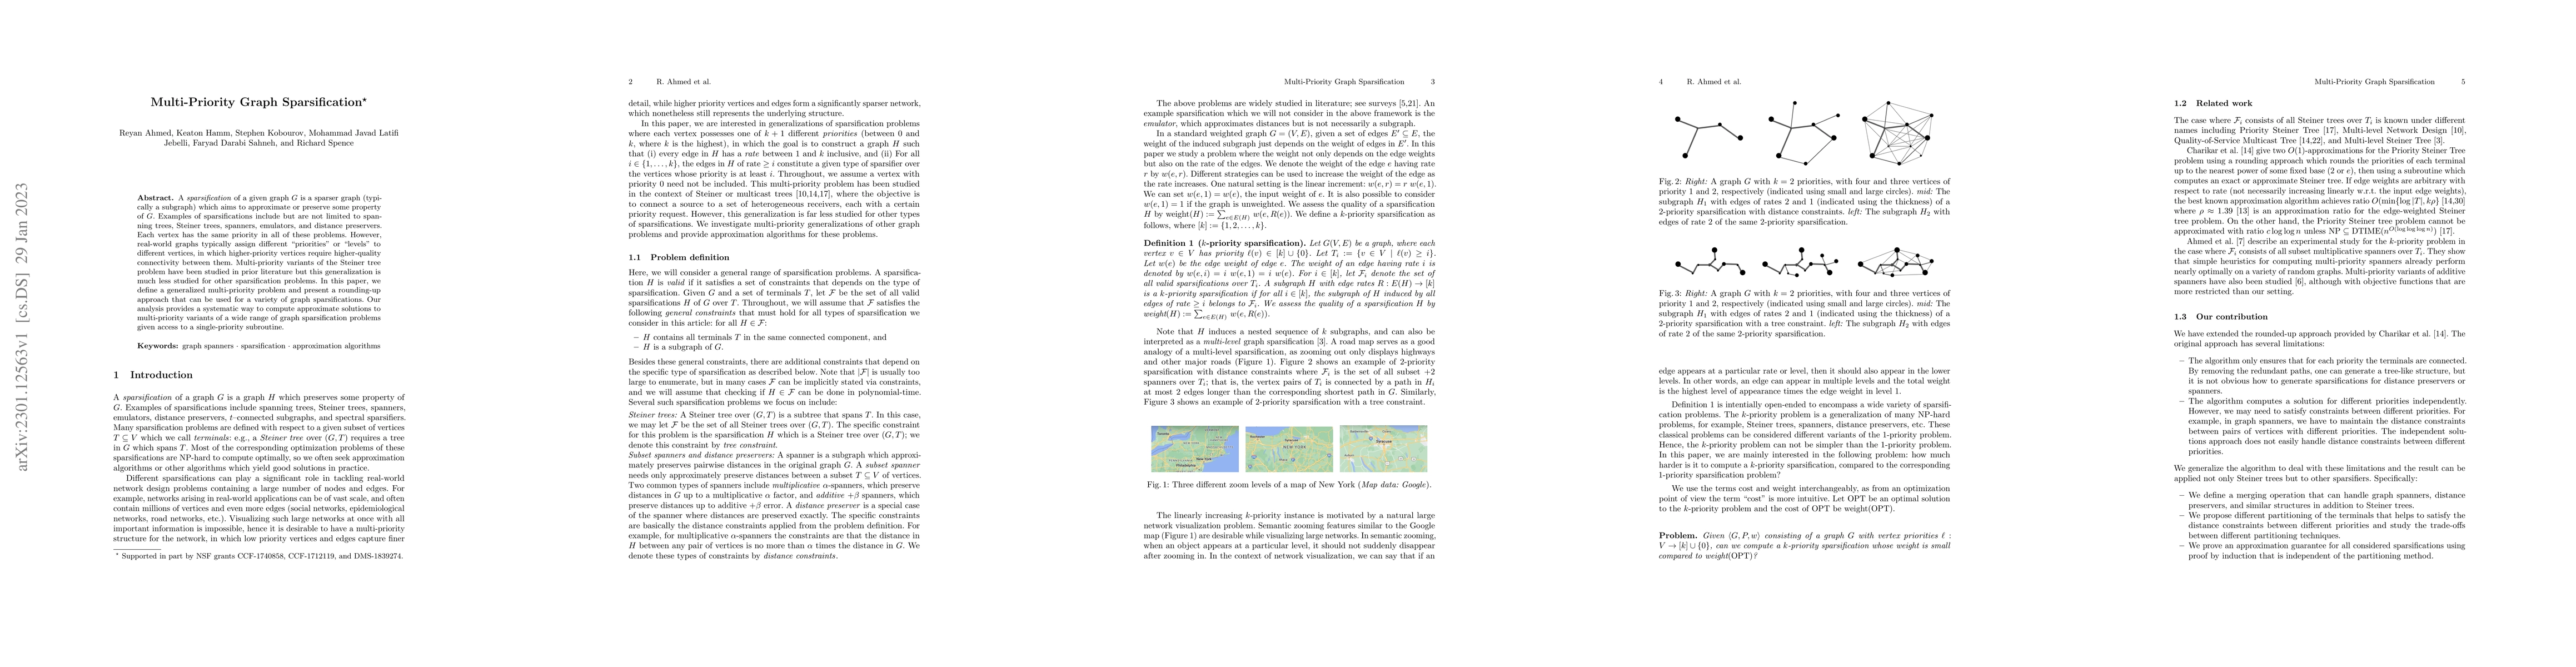
A \emph{sparsification} of a given graph $G$ is a sparser graph (typically a subgraph) which aims to approximate or preserve some property of $G$. Examples of sparsifications include but are not lim...
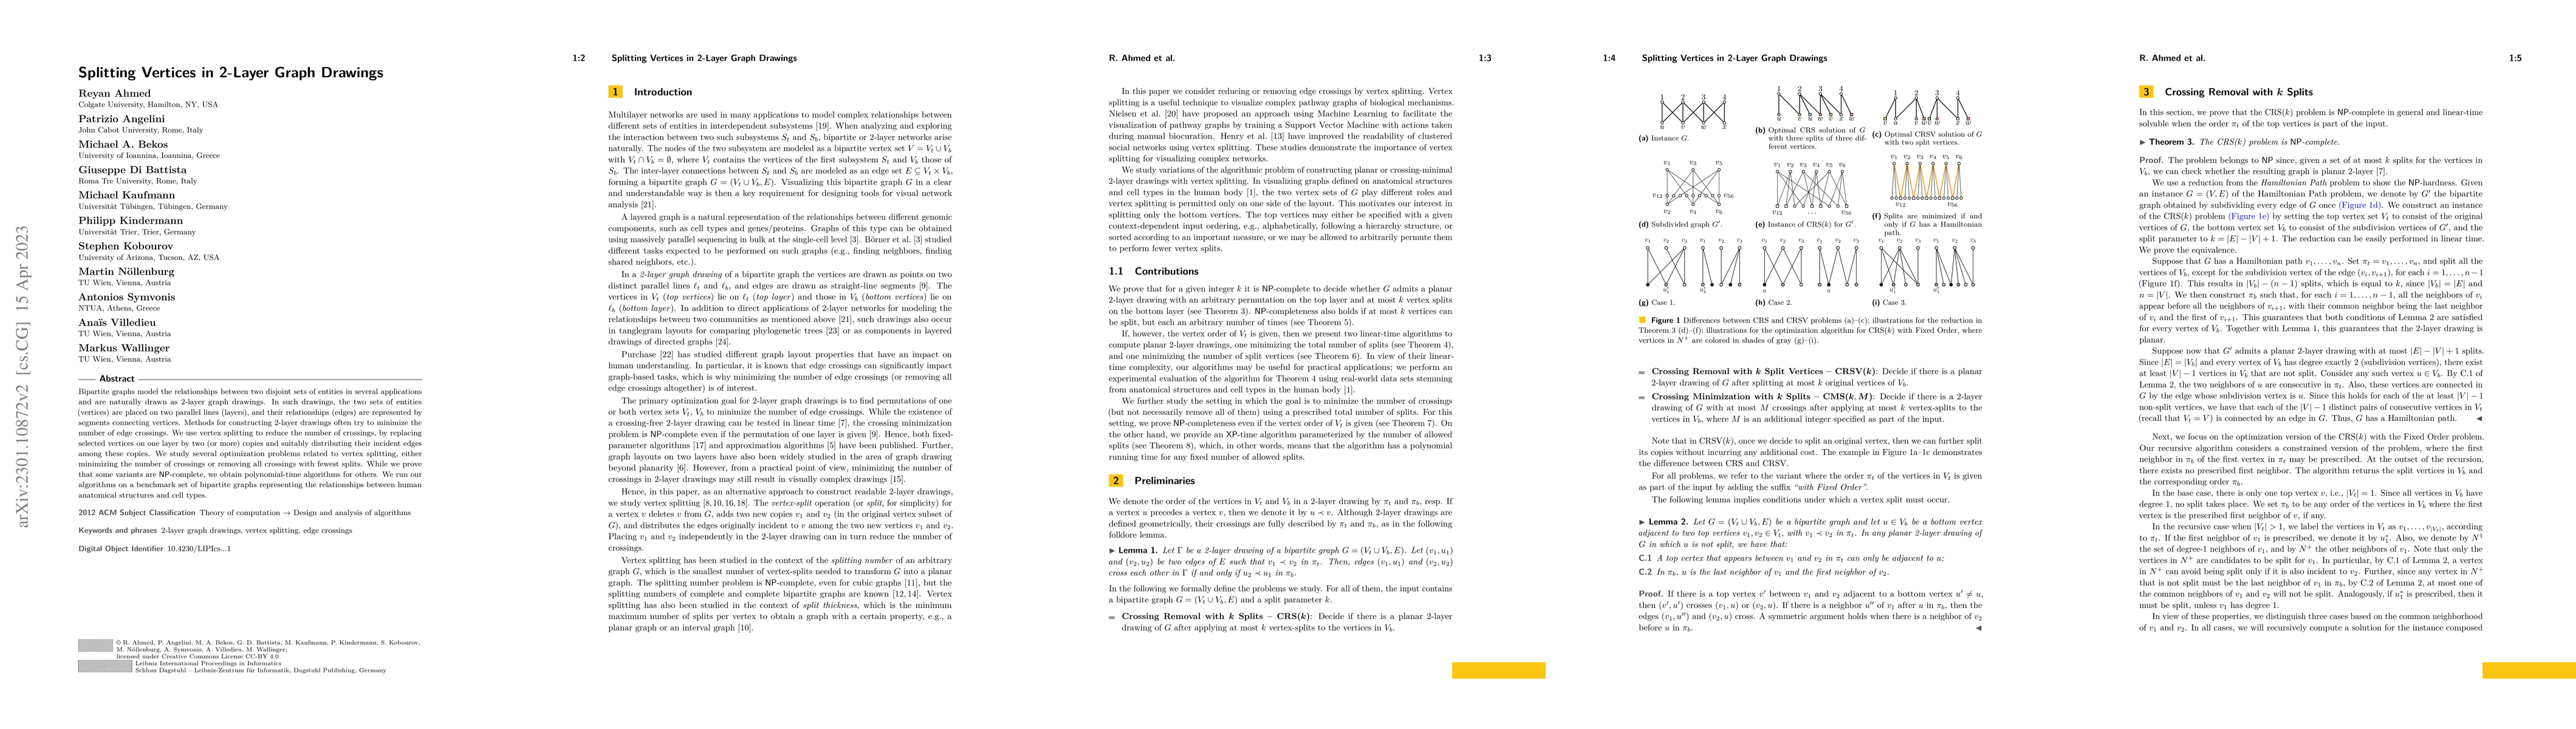
Bipartite graphs model the relationships between two disjoint sets of entities in several applications and are naturally drawn as 2-layer graph drawings. In such drawings, the two sets of entities (...
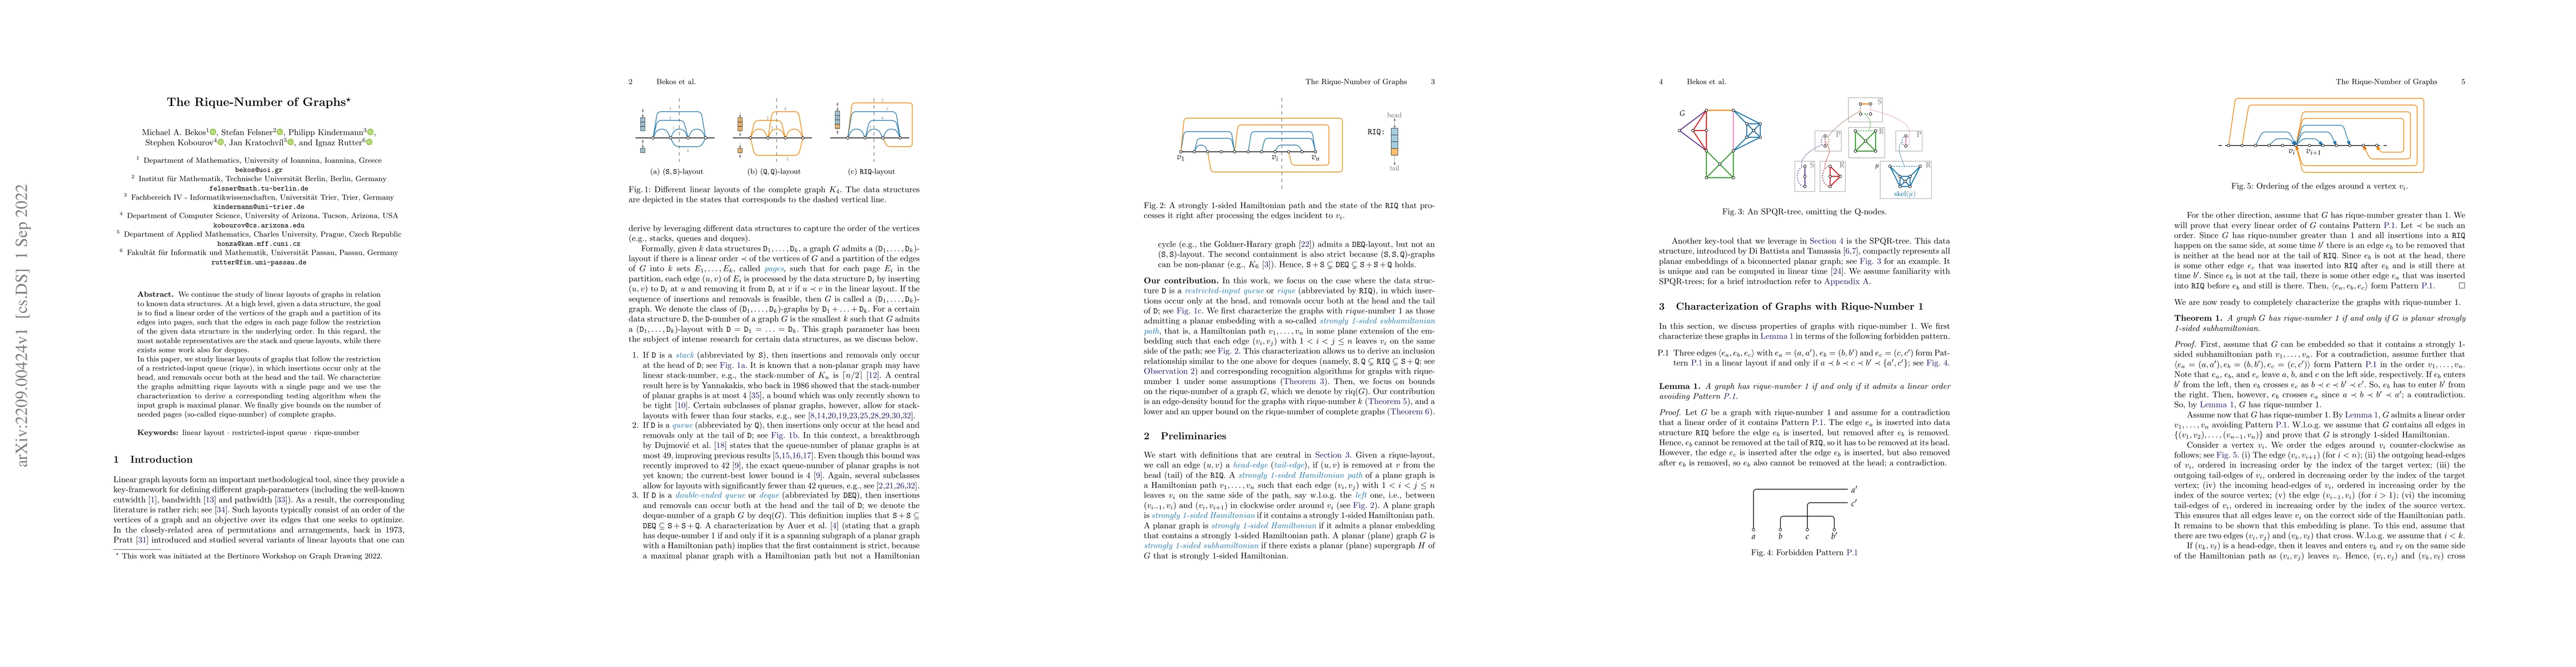
We continue the study of linear layouts of graphs in relation to known data structures. At a high level, given a data structure, the goal is to find a linear order of the vertices of the graph and a...
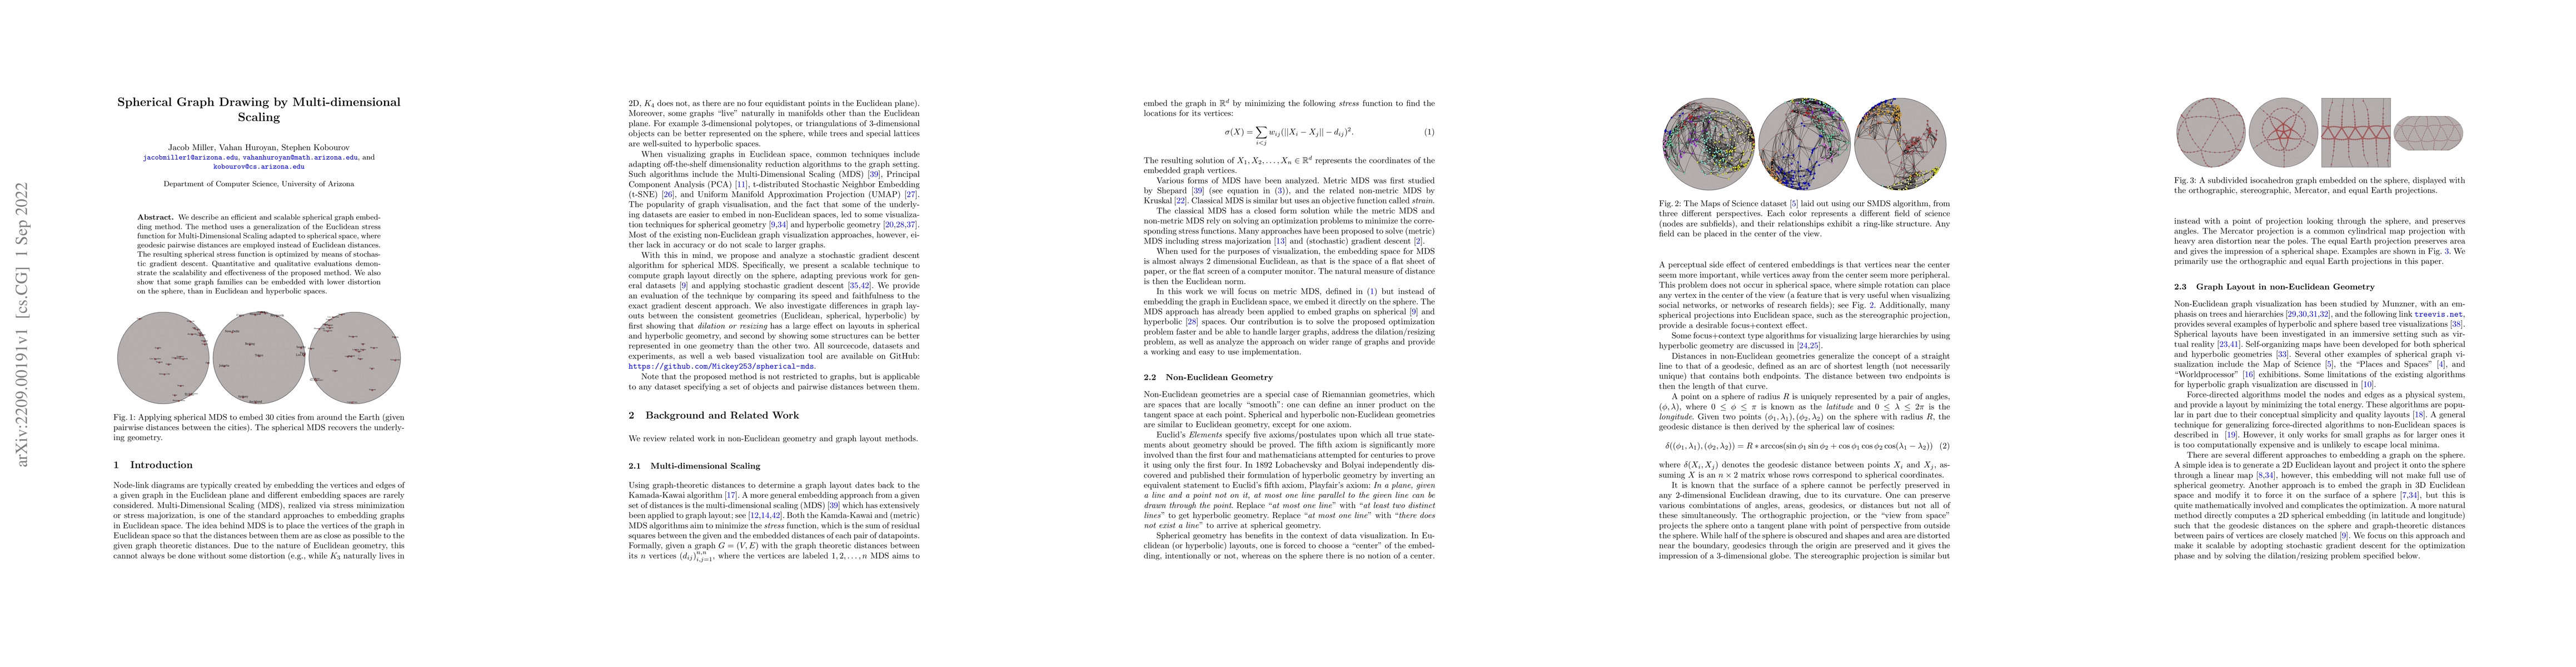
We describe an efficient and scalable spherical graph embedding method. The method uses a generalization of the Euclidean stress function for Multi-Dimensional Scaling adapted to spherical space, wh...
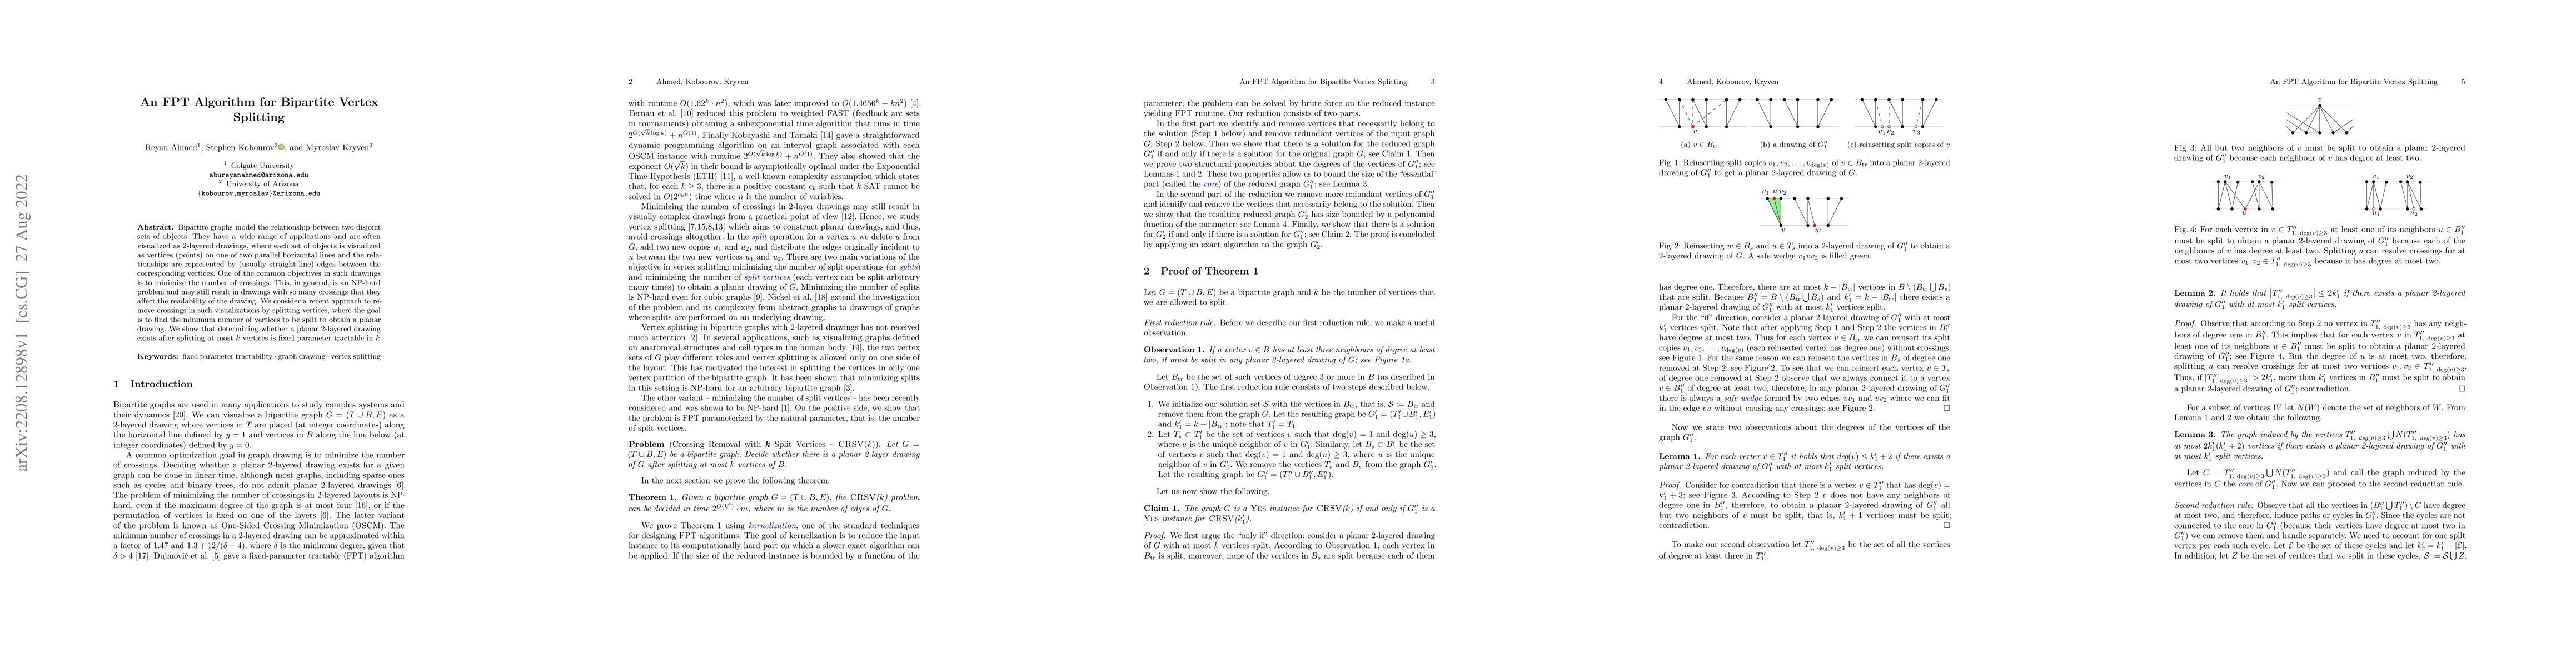
Bipartite graphs model the relationship between two disjoint sets of objects. They have a wide range of applications and are often visualized as a 2-layered drawing, where each set of objects is vis...
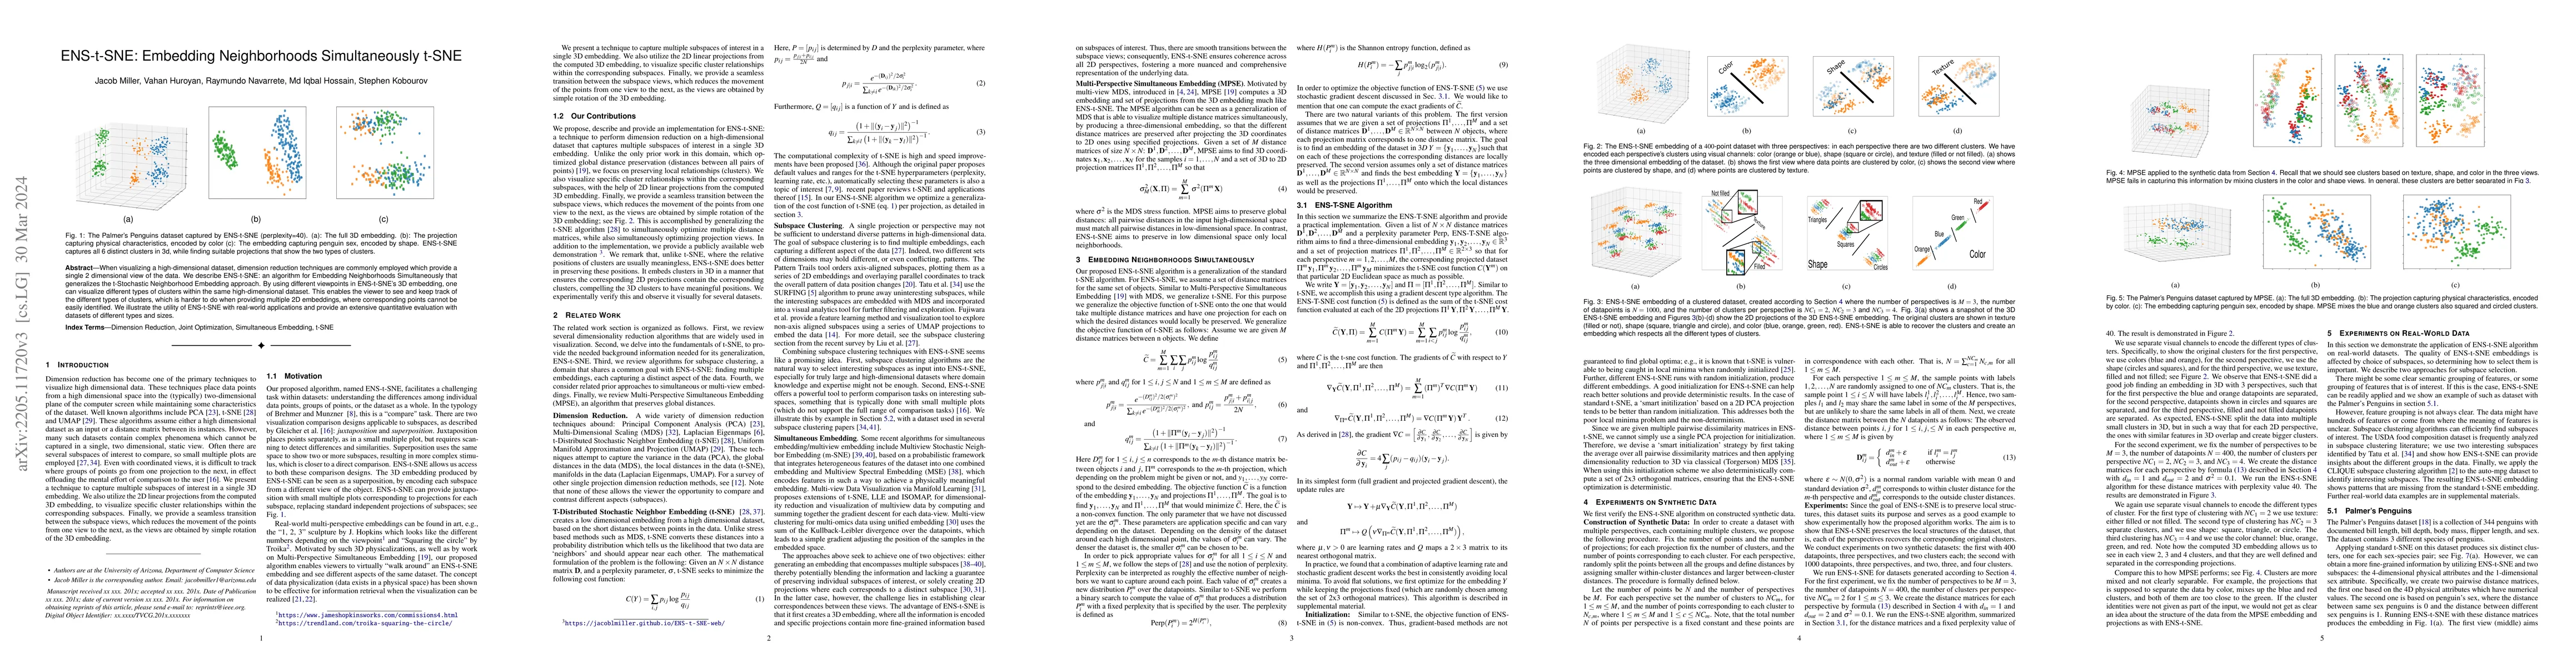
When visualizing a high-dimensional dataset, dimension reduction techniques are commonly employed which provide a single 2-dimensional view of the data. We describe ENS-t-SNE: an algorithm for Embed...
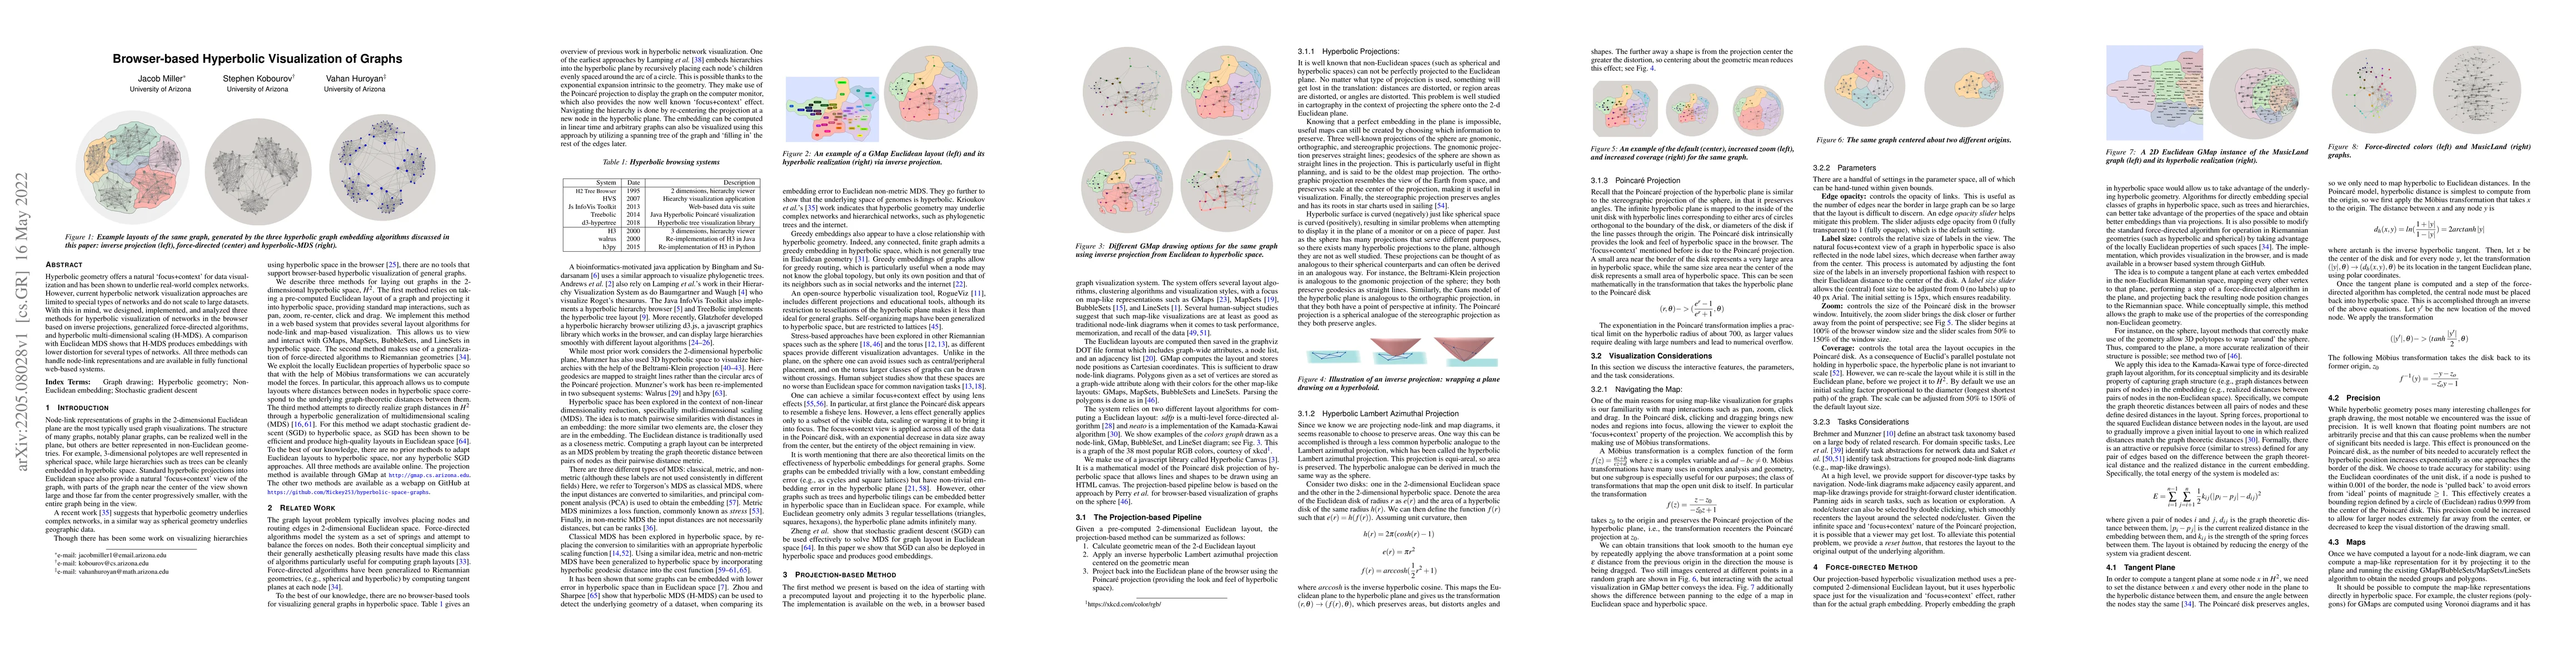
Hyperbolic geometry offers a natural focus + context for data visualization and has been shown to underlie real-world complex networks. However, current hyperbolic network visualization approaches a...
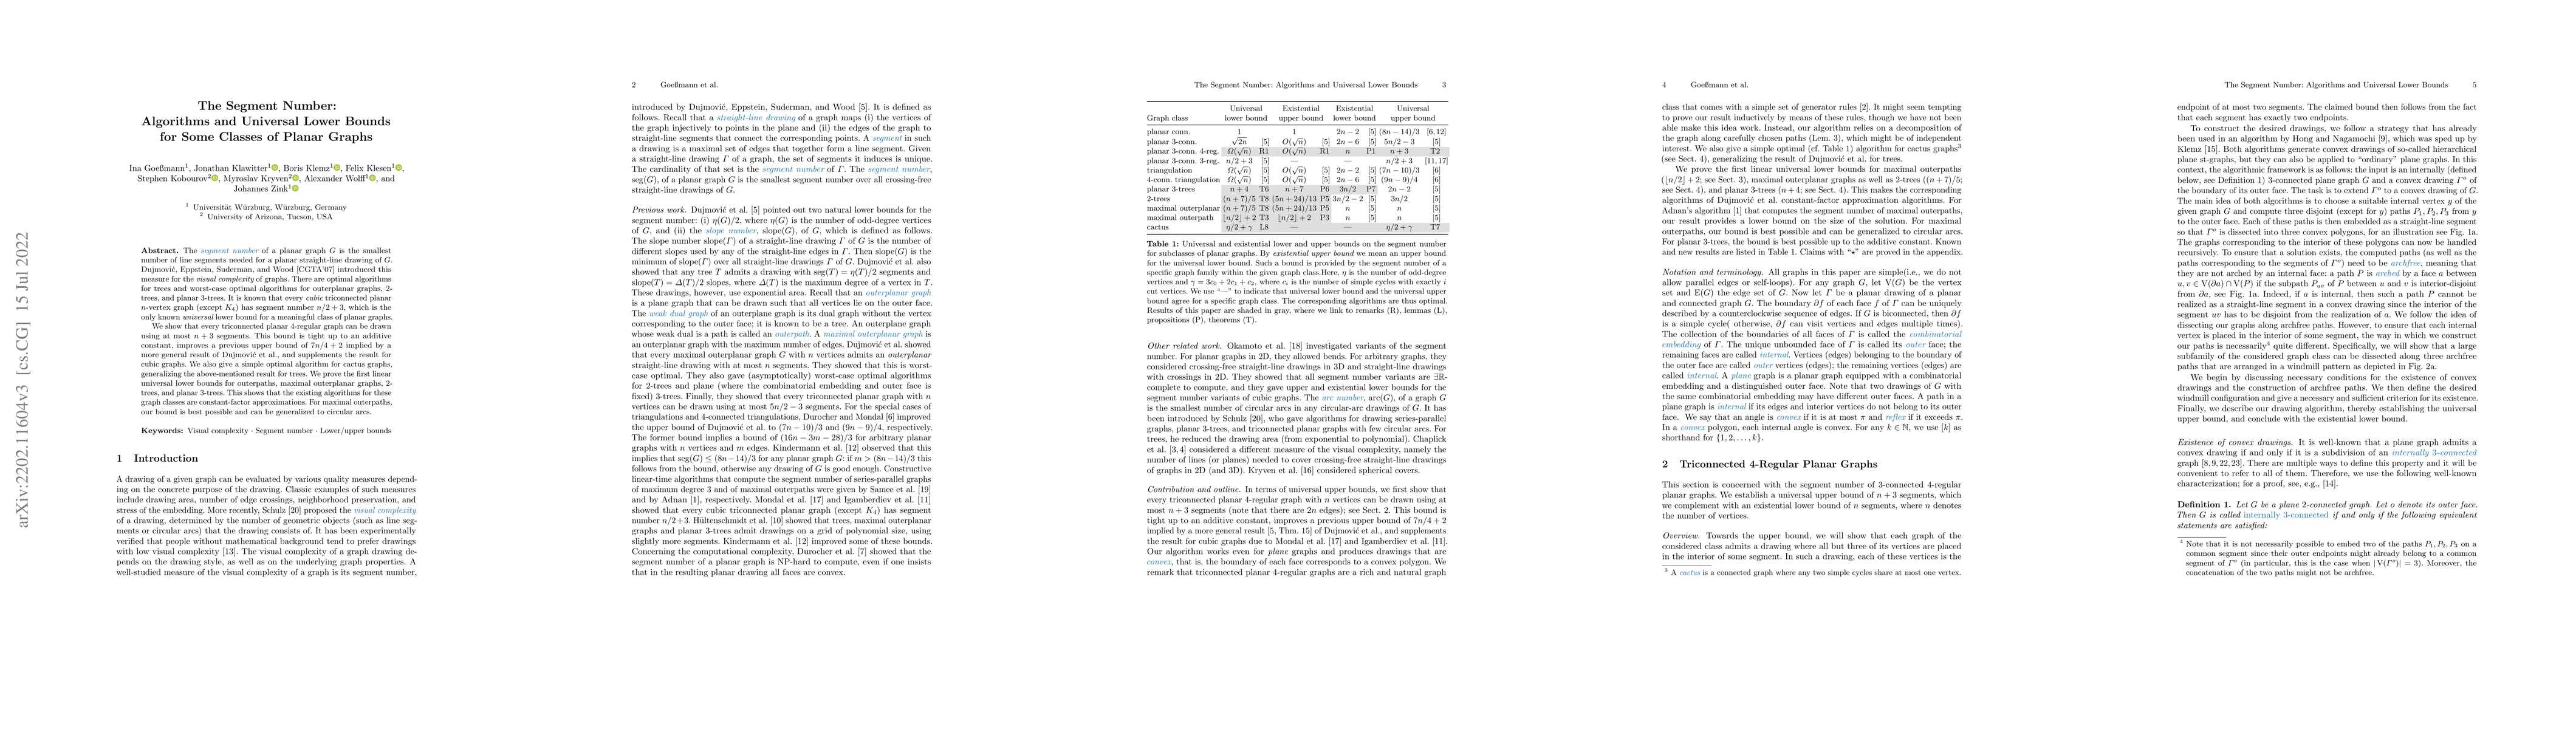
The segment number of a planar graph $G$ is the smallest number of line segments needed for a planar straight-line drawing of $G$. Dujmovi\'c, Eppstein, Suderman, and Wood [CGTA'07] introduced this ...
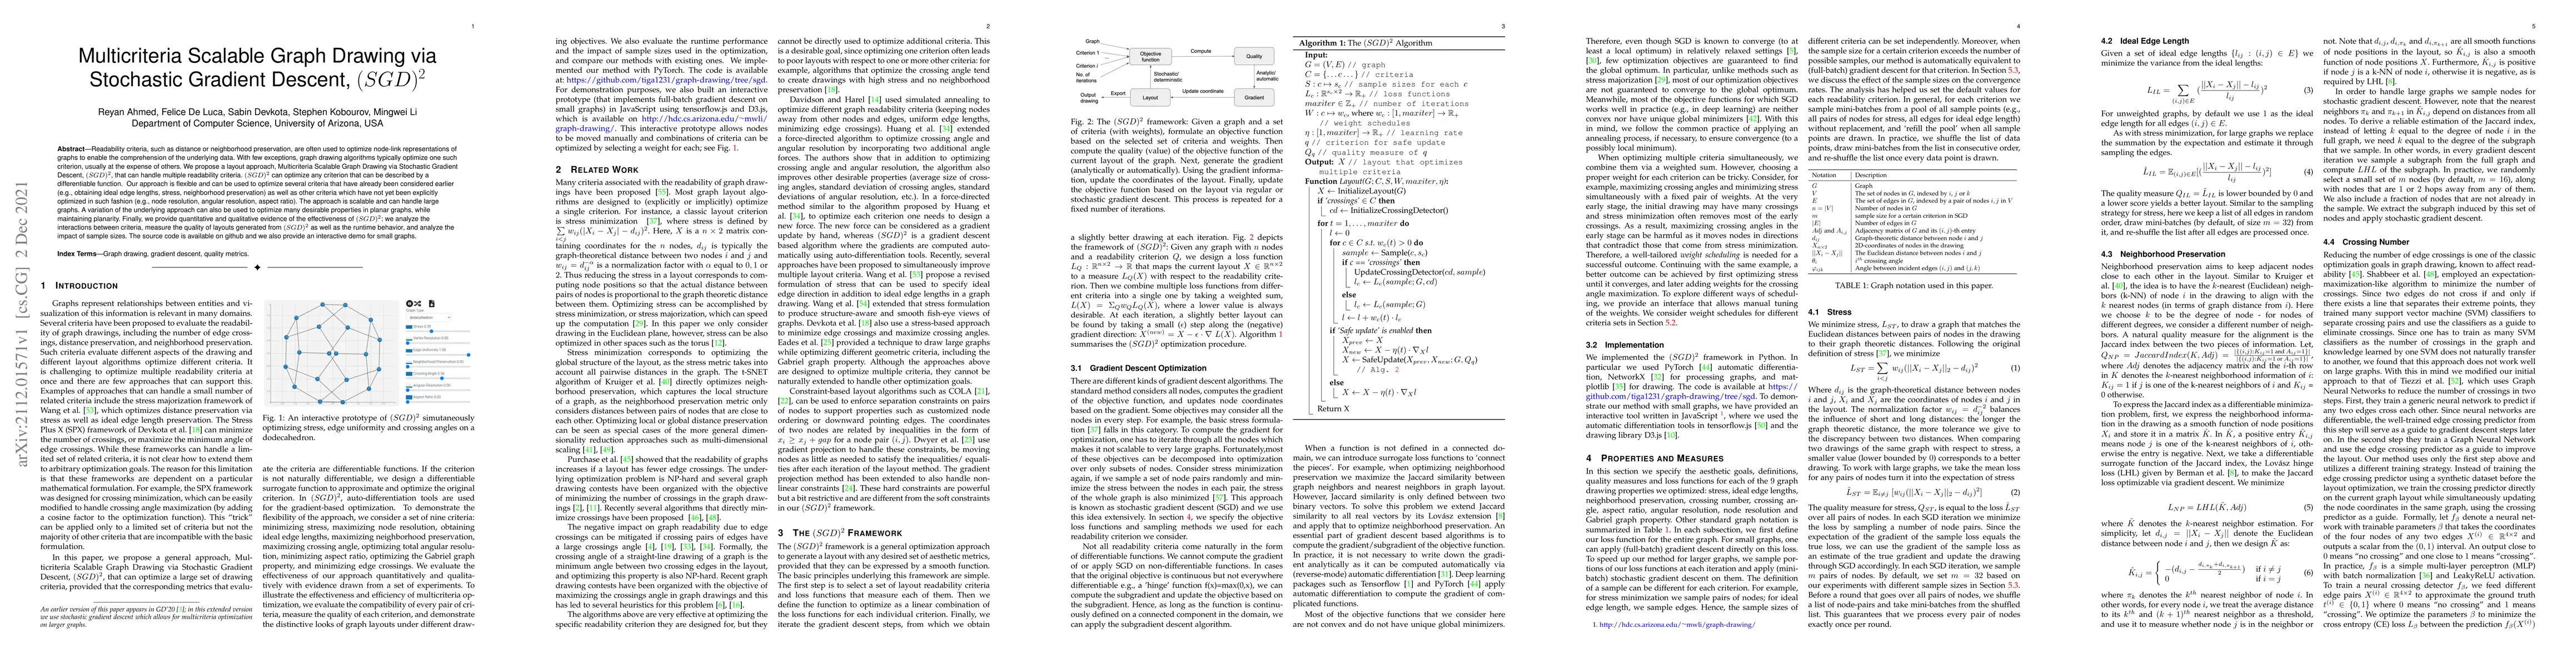
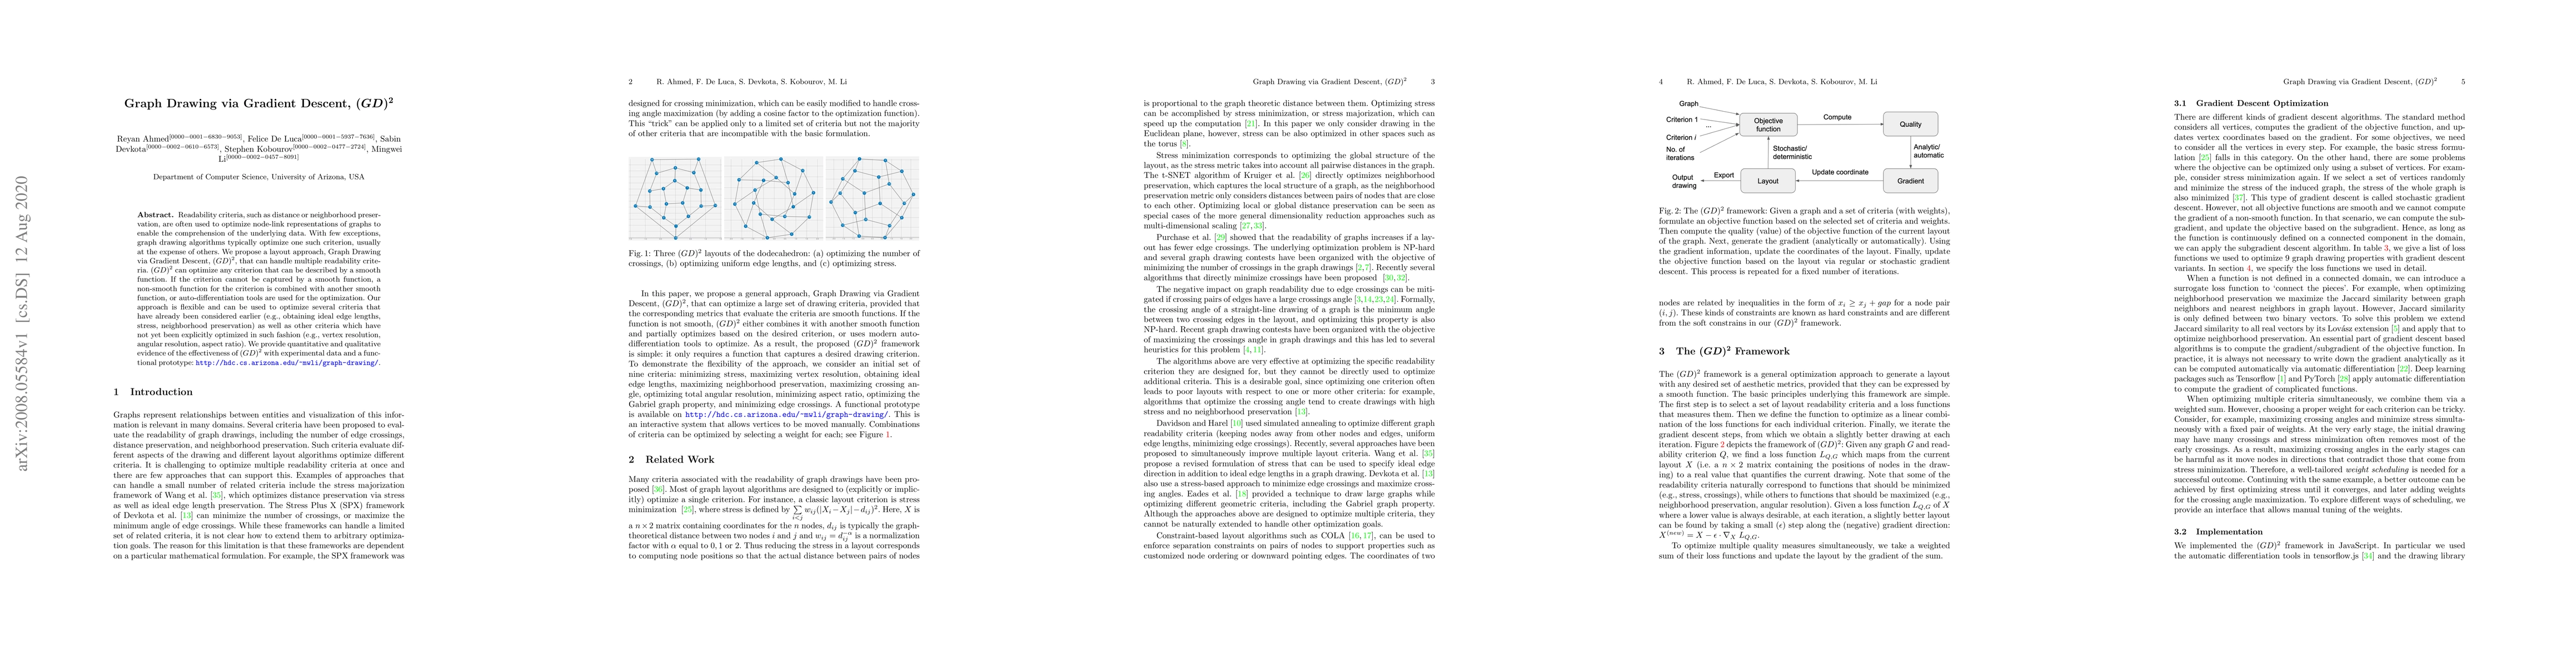
Readability criteria, such as distance or neighborhood preservation, are often used to optimize node-link representations of graphs to enable the comprehension of the underlying data. With few excep...
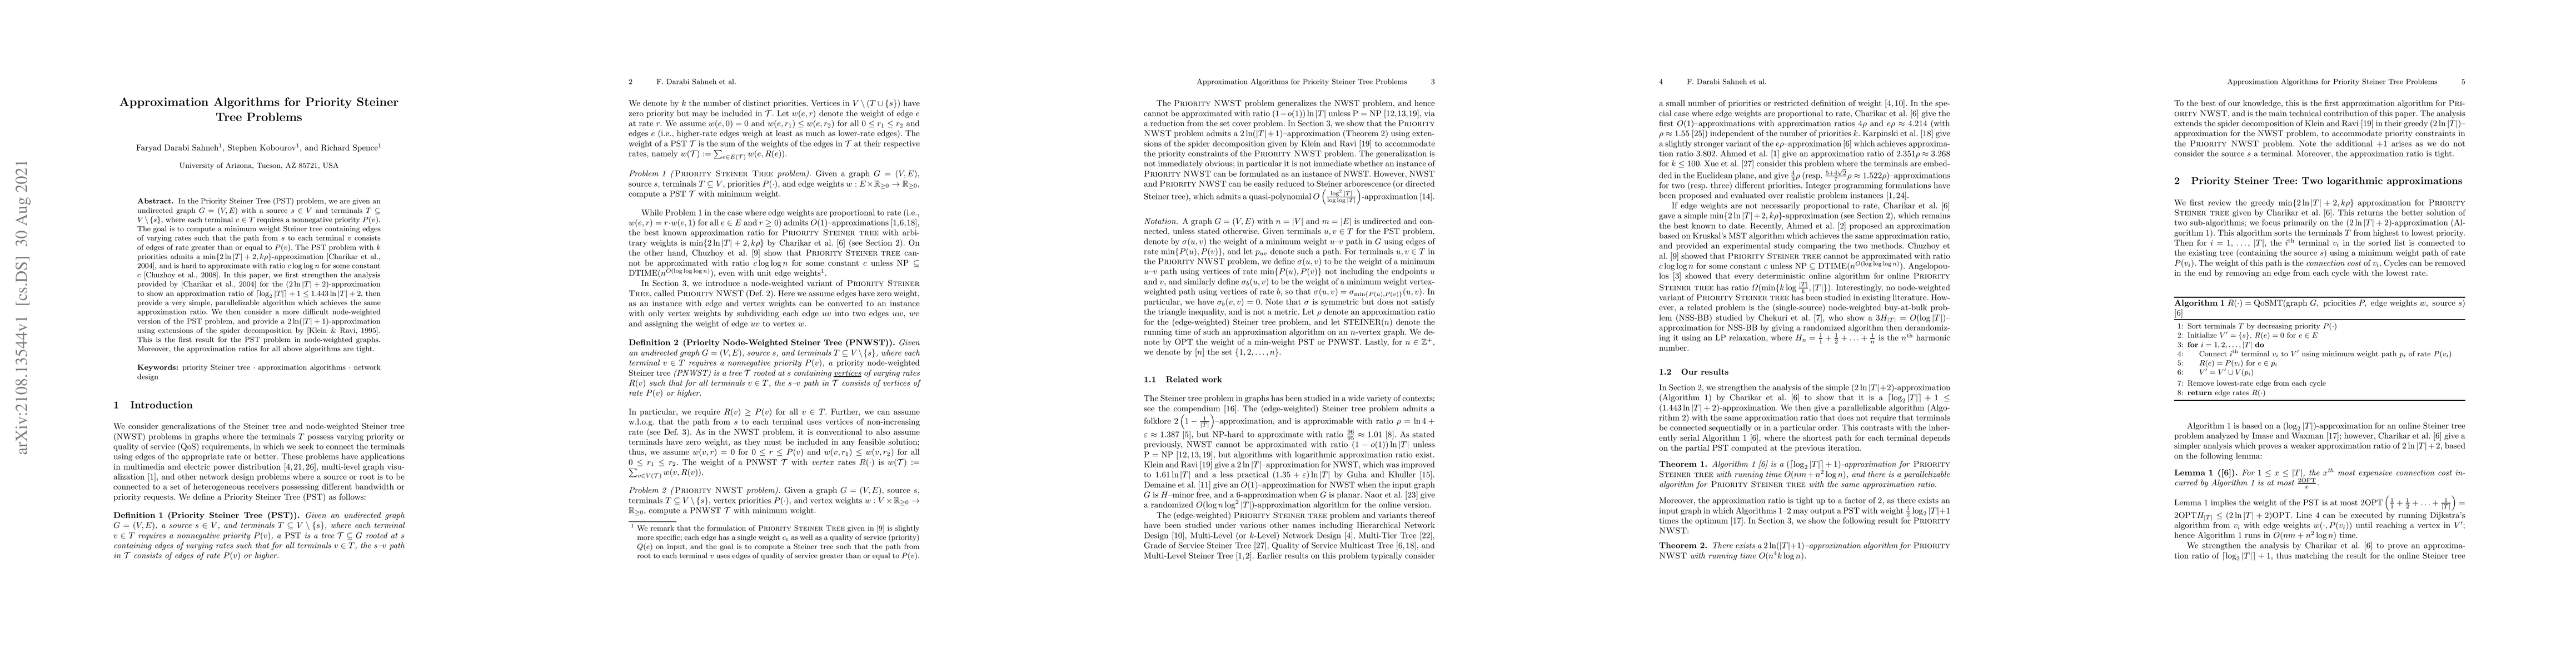
In the Priority Steiner Tree (PST) problem, we are given an undirected graph $G=(V,E)$ with a source $s \in V$ and terminals $T \subseteq V \setminus \{s\}$, where each terminal $v \in T$ requires a...
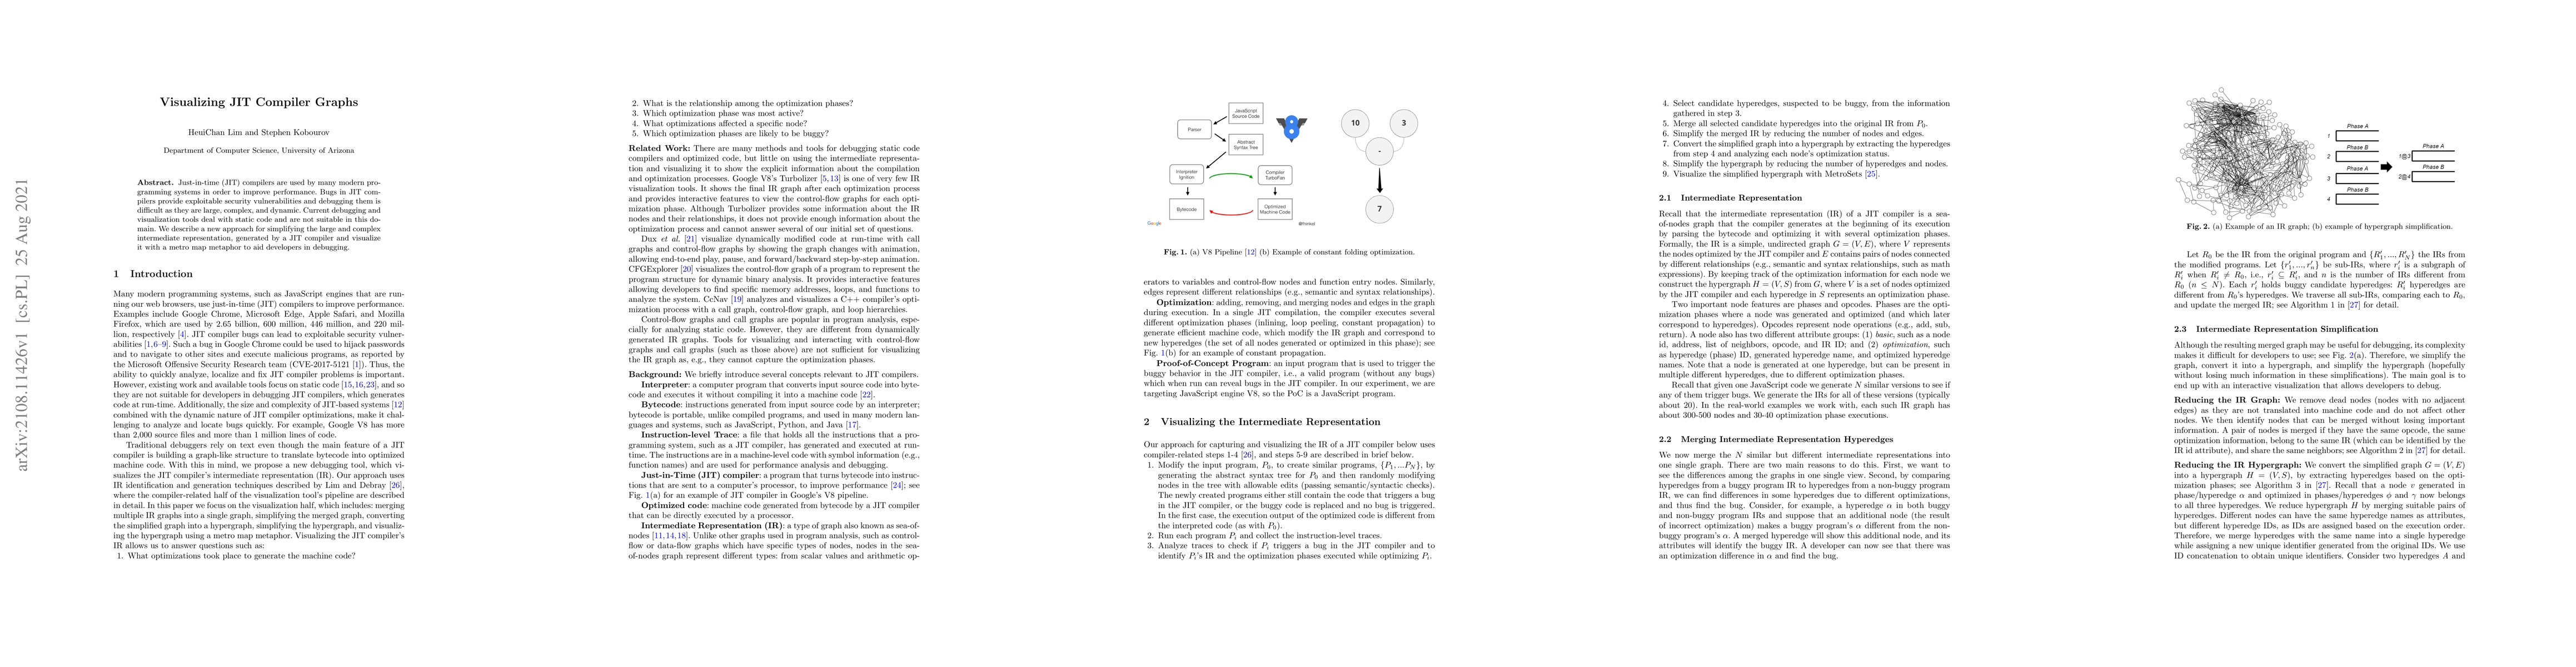
Just-in-time (JIT) compilers are used by many modern programming systems in order to improve performance. Bugs in JIT compilers provide exploitable security vulnerabilities and debugging them is dif...
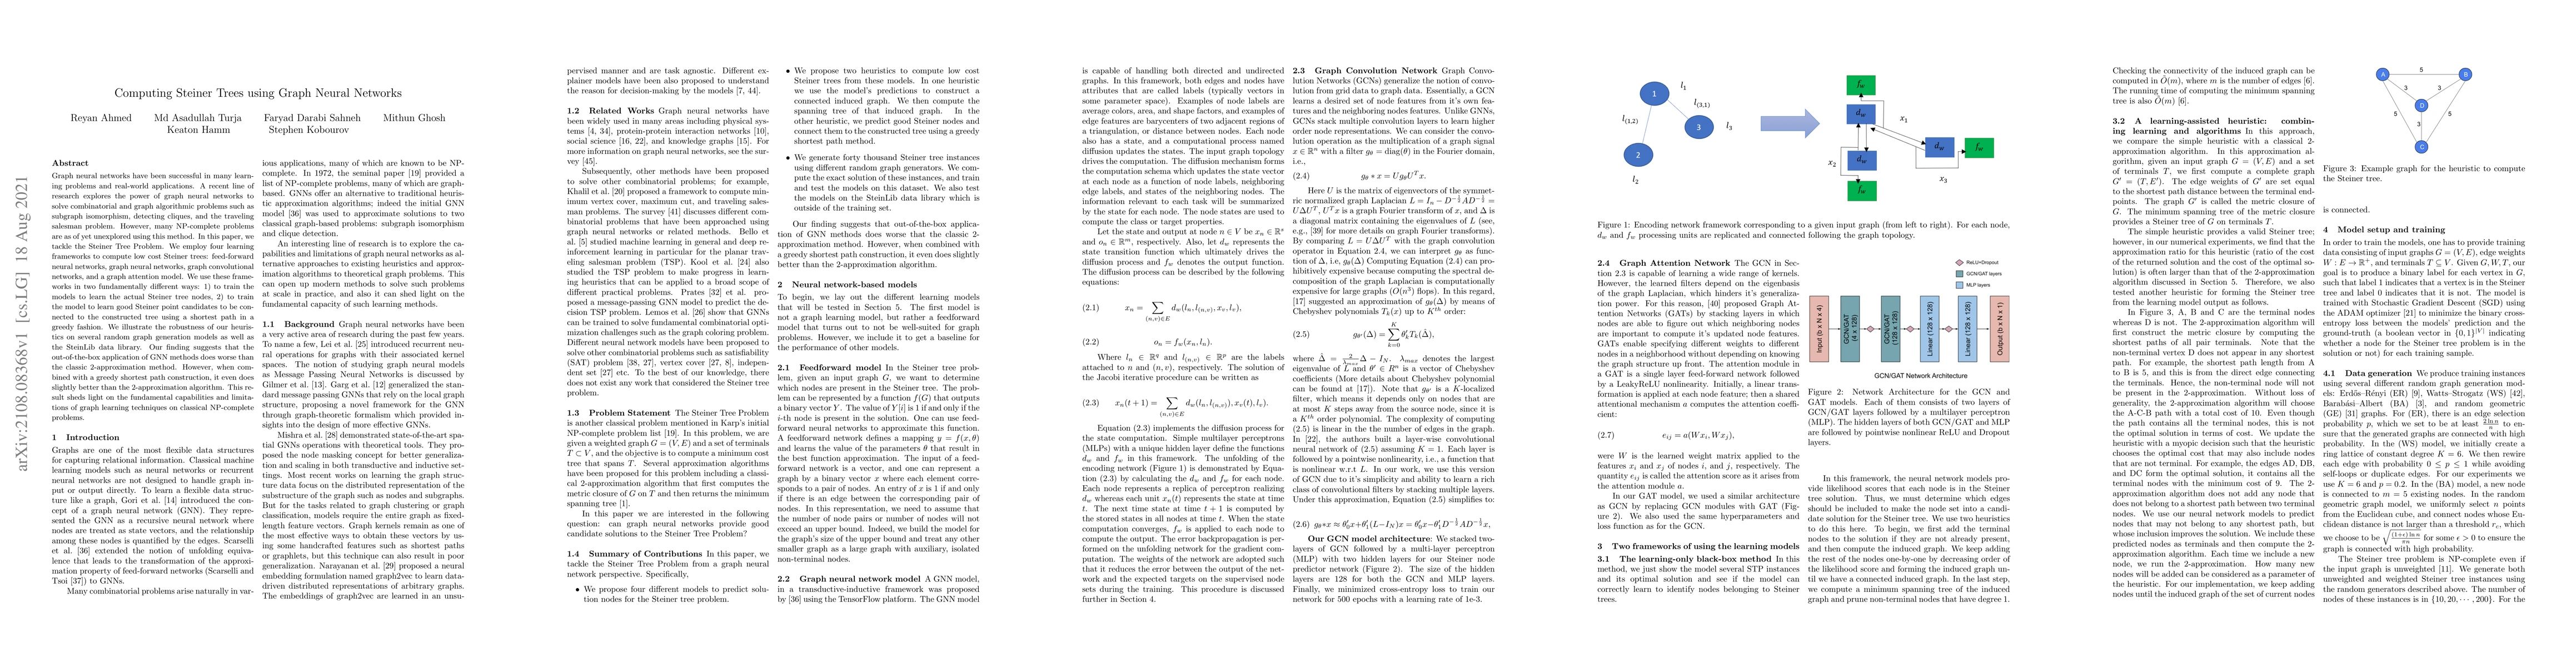
Graph neural networks have been successful in many learning problems and real-world applications. A recent line of research explores the power of graph neural networks to solve combinatorial and gra...
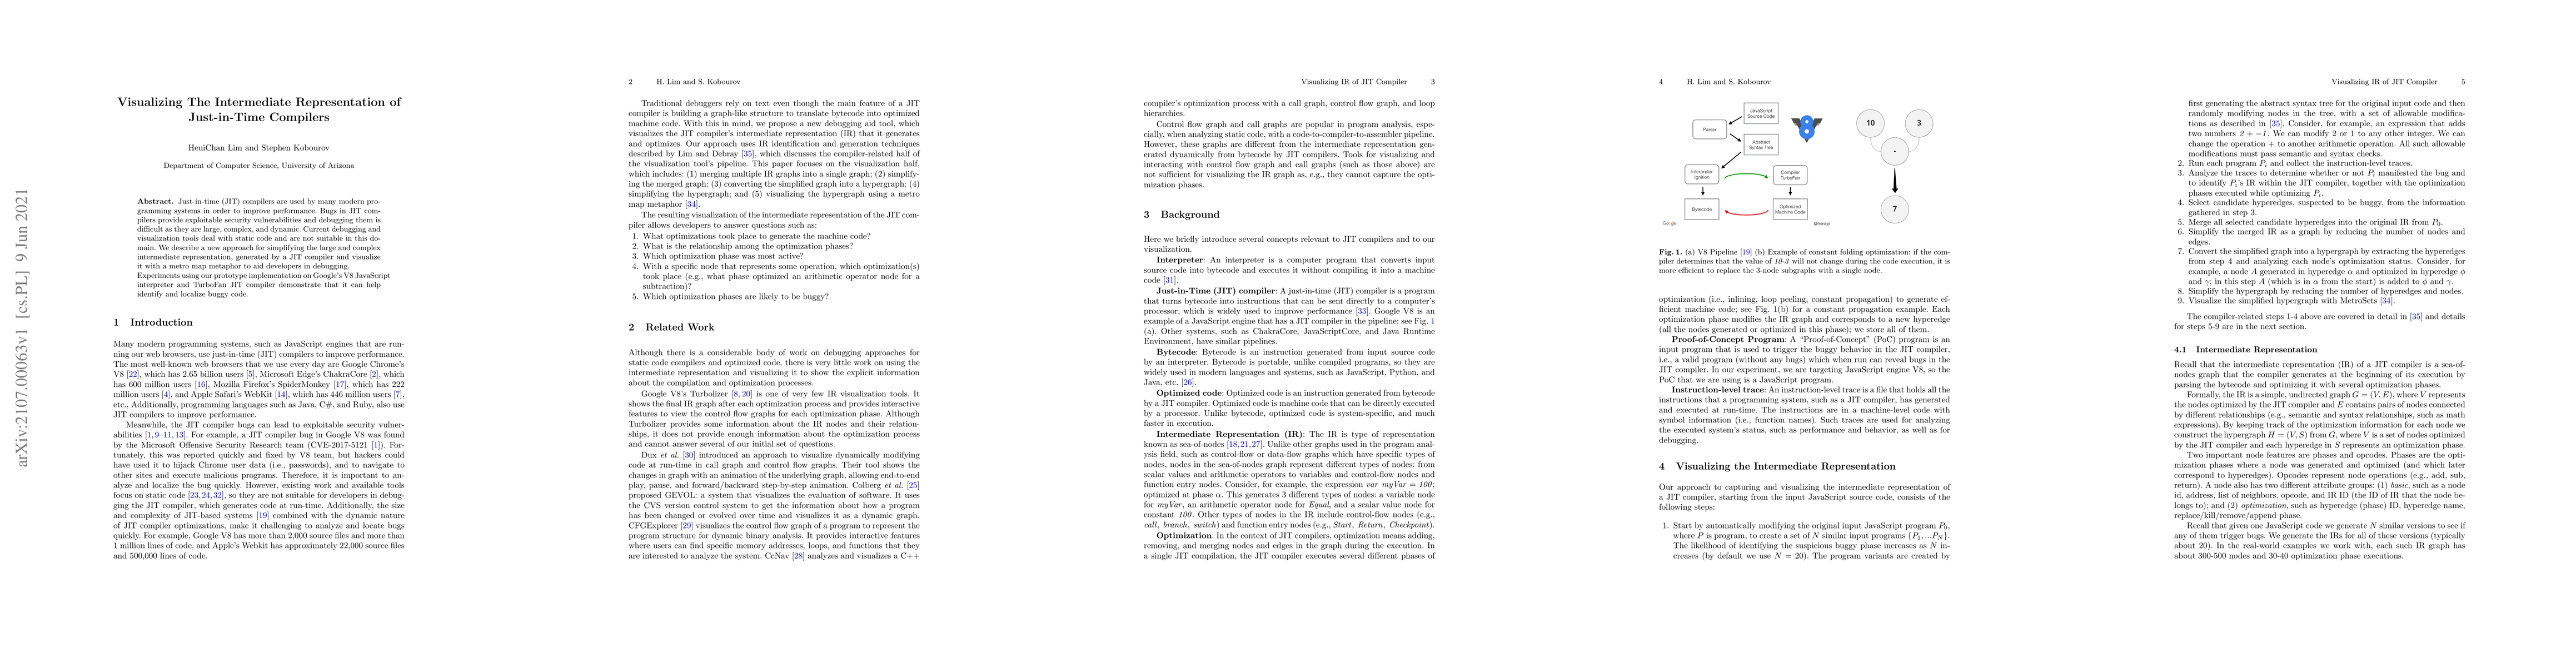
Just-in-Time (JIT) compilers are used by many modern programming systems in order to improve performance. Bugs in JIT compilers provide exploitable security vulnerabilities and debugging them is dif...
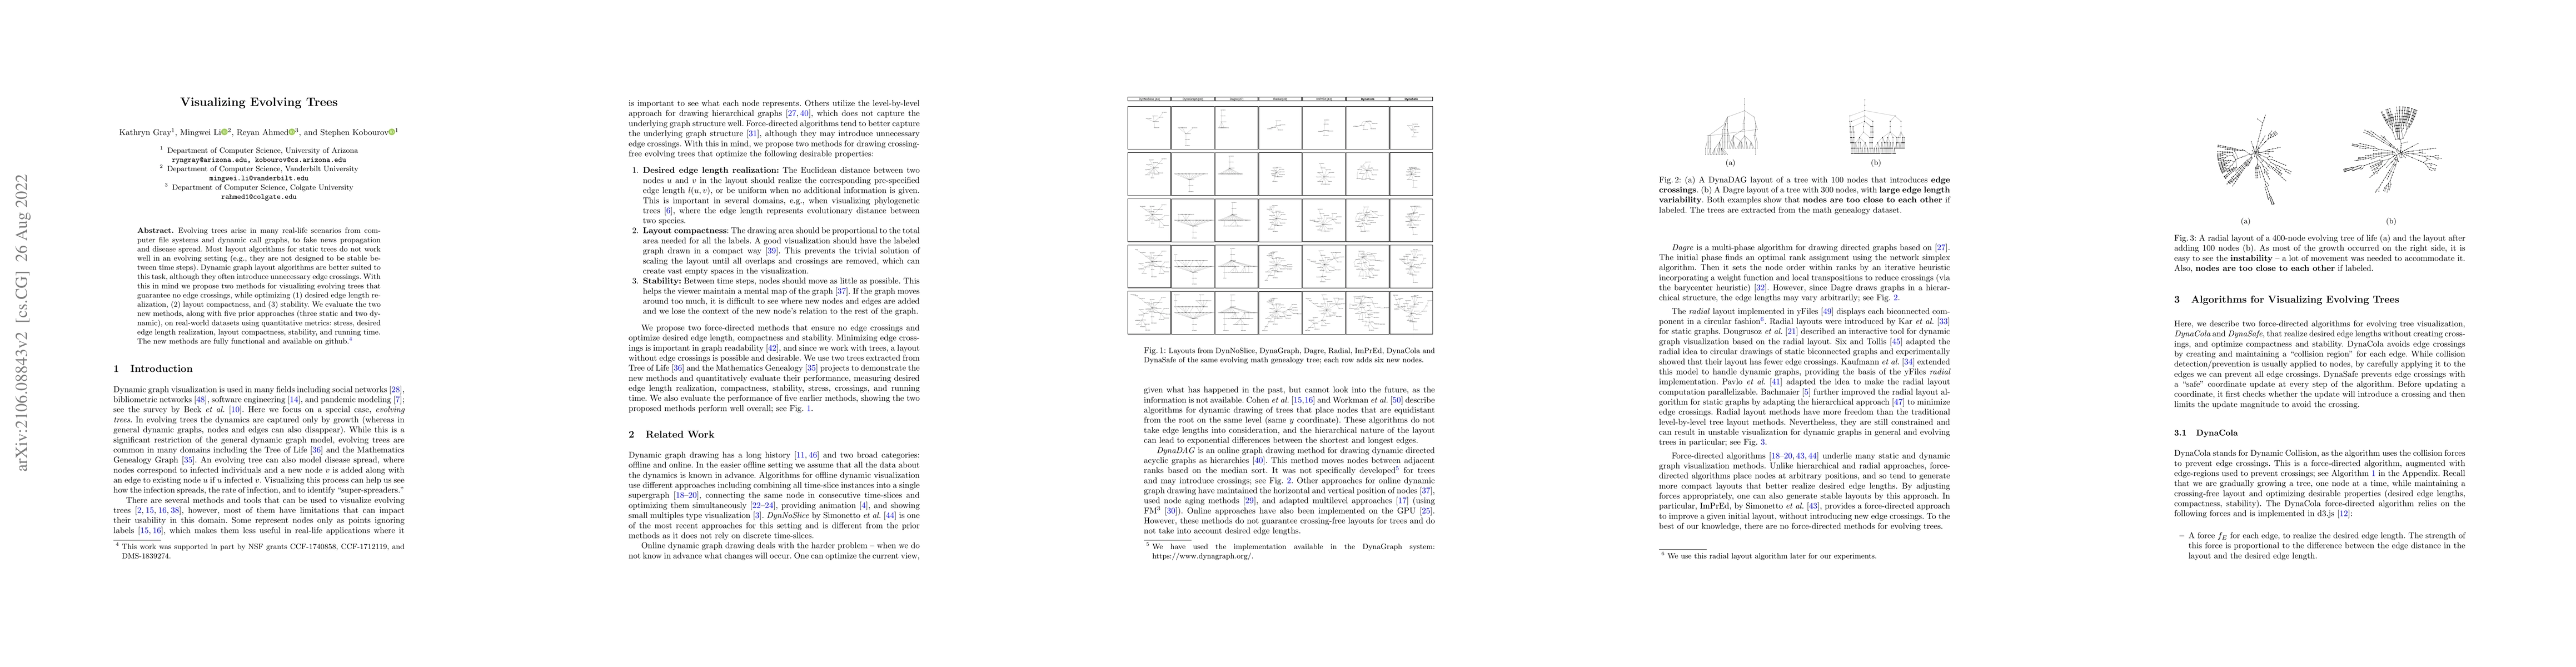
Evolving trees arise in many real-life scenarios from computer file systems and dynamic call graphs, to fake news propagation and disease spread. Most layout algorithms for static trees do not work ...
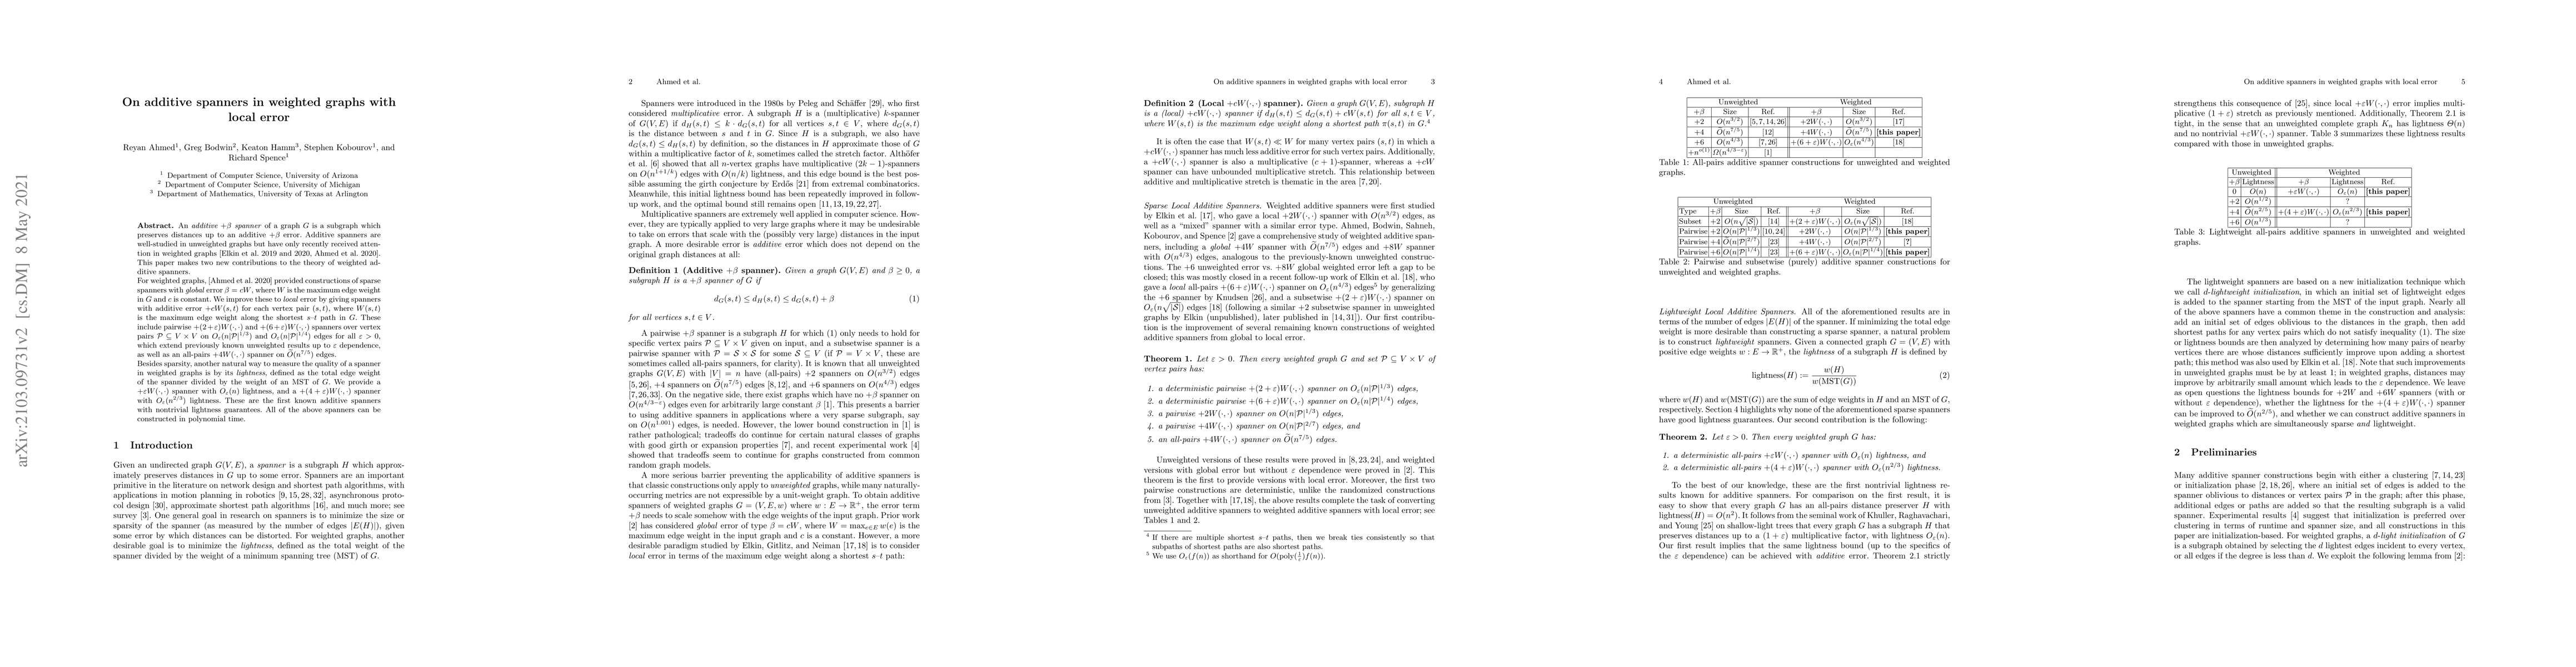
An \emph{additive $+\beta$ spanner} of a graph $G$ is a subgraph which preserves distances up to an additive $+\beta$ error. Additive spanners are well-studied in unweighted graphs but have only rec...
Given a graph $G = (V,E)$, a subgraph $H$ is an \emph{additive $+\beta$ spanner} if $\dist_H(u,v) \le \dist_G(u,v) + \beta$ for all $u, v \in V$. A \emph{pairwise spanner} is a spanner for which the...
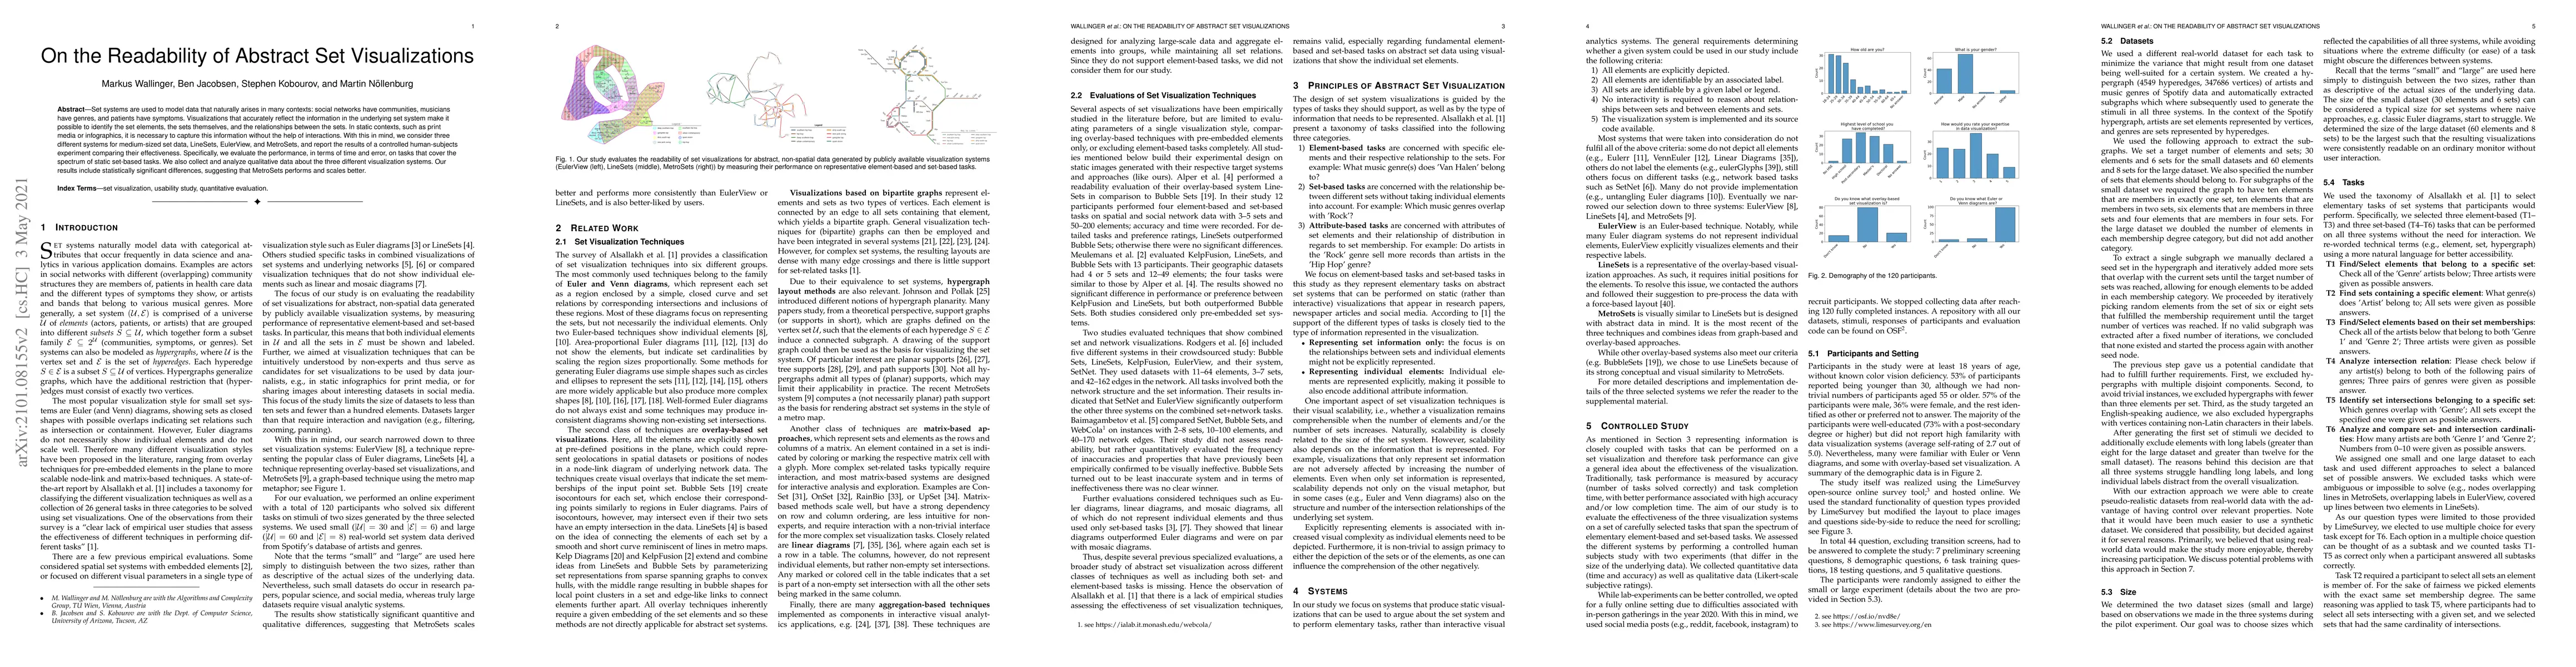
Set systems are used to model data that naturally arises in many contexts: social networks have communities, musicians have genres, and patients have symptoms. Visualizations that accurately reflect...
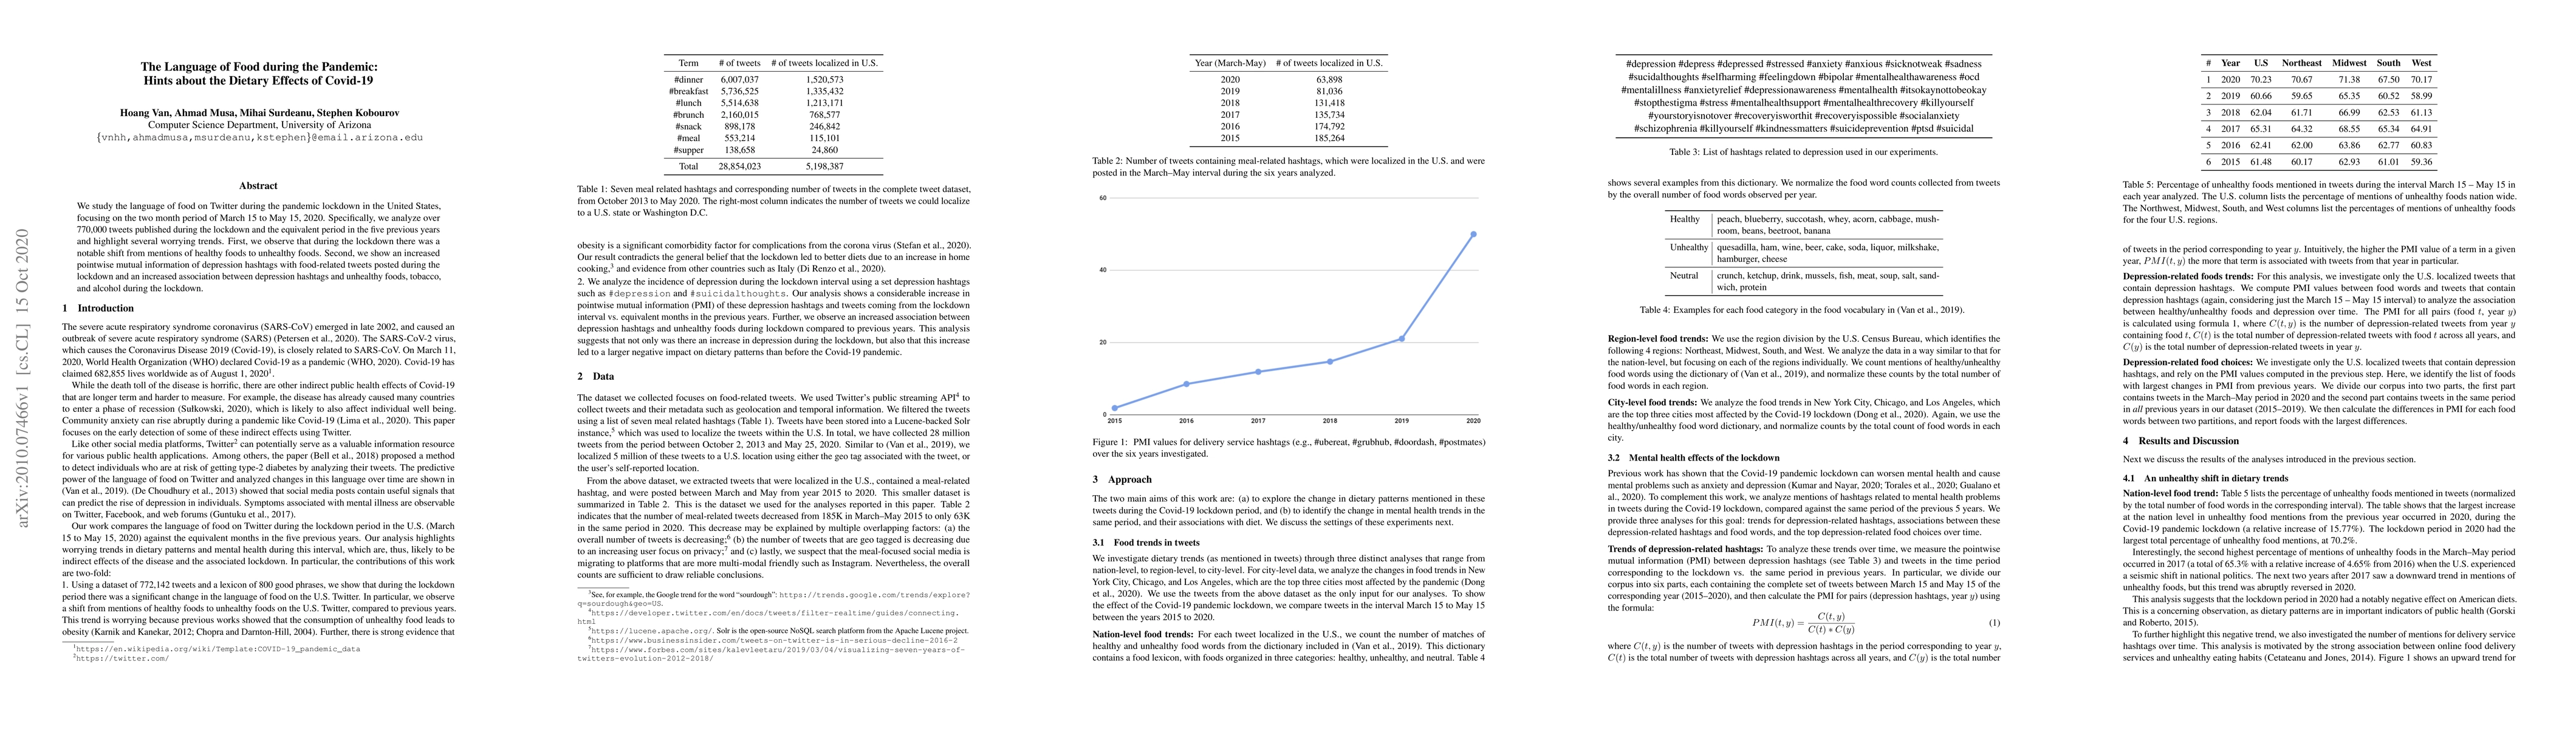
We study the language of food on Twitter during the pandemic lockdown in the United States, focusing on the two month period of March 15 to May 15, 2020. Specifically, we analyze over770,000 tweets ...
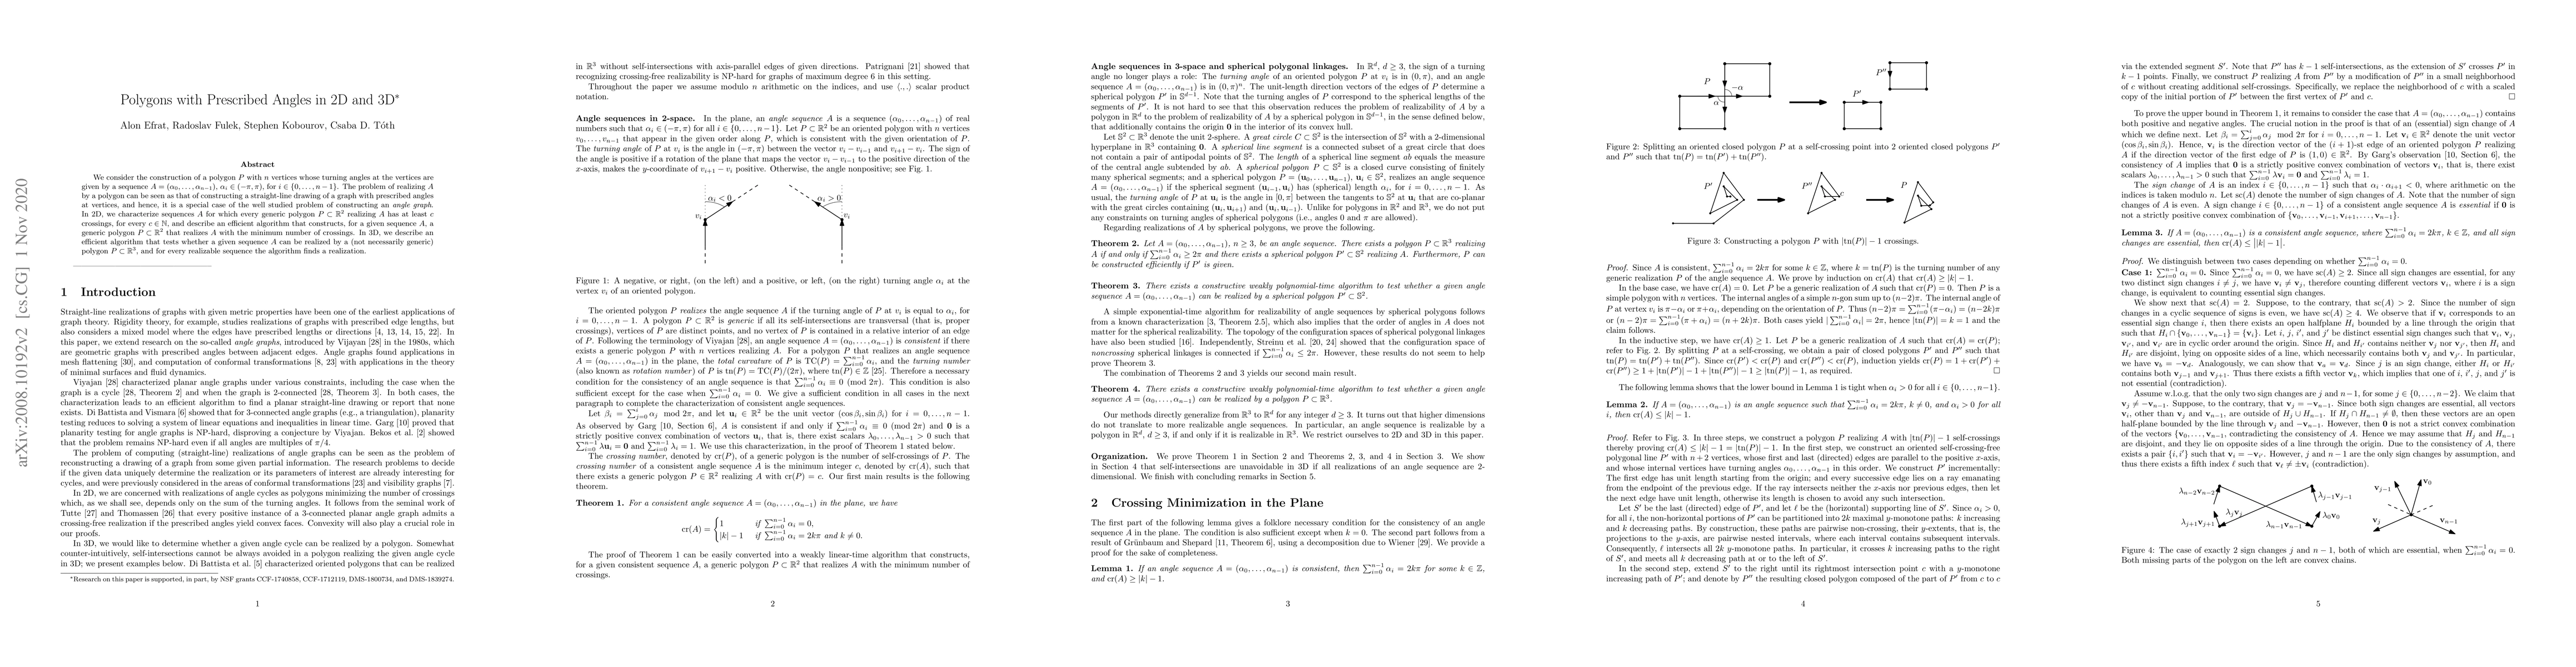
We consider the construction of a polygon $P$ with $n$ vertices whose turning angles at the vertices are given by a sequence $A=(\alpha_0,\ldots, \alpha_{n-1})$, $\alpha_i\in (-\pi,\pi)$, for $i\in\...
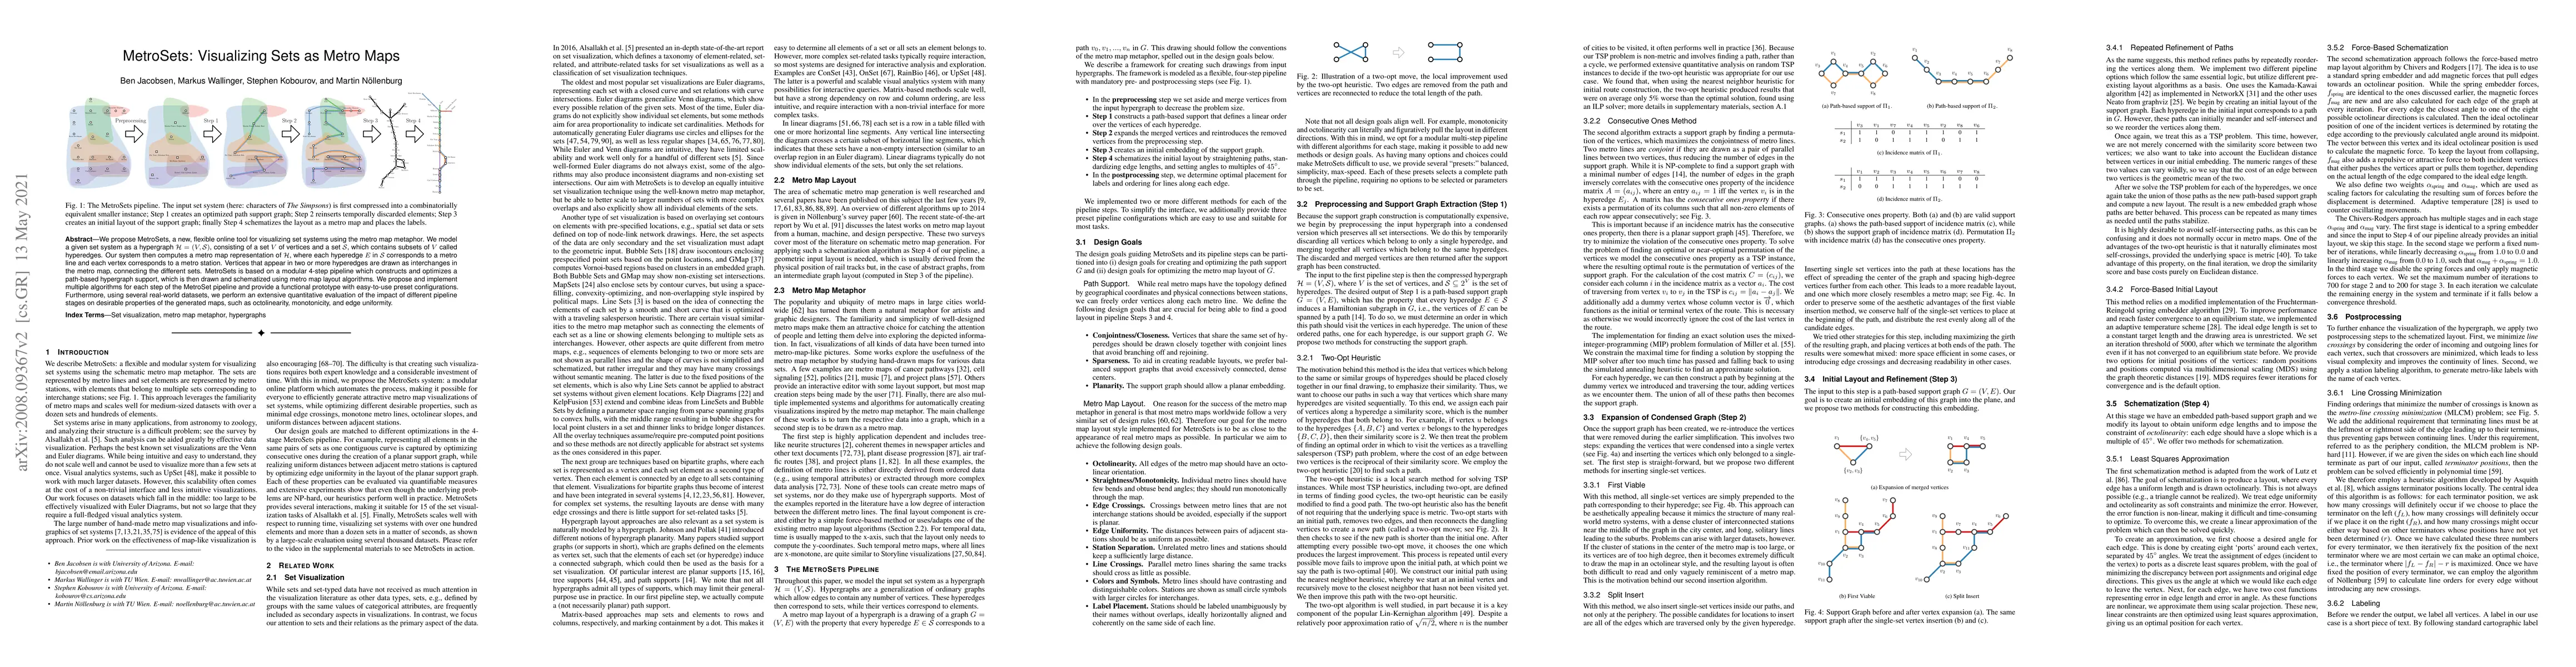
We propose MetroSets, a new, flexible online tool for visualizing set systems using the metro map metaphor. We model a given set system as a hypergraph $\mathcal{H} = (V, \mathcal{S})$, consisting o...
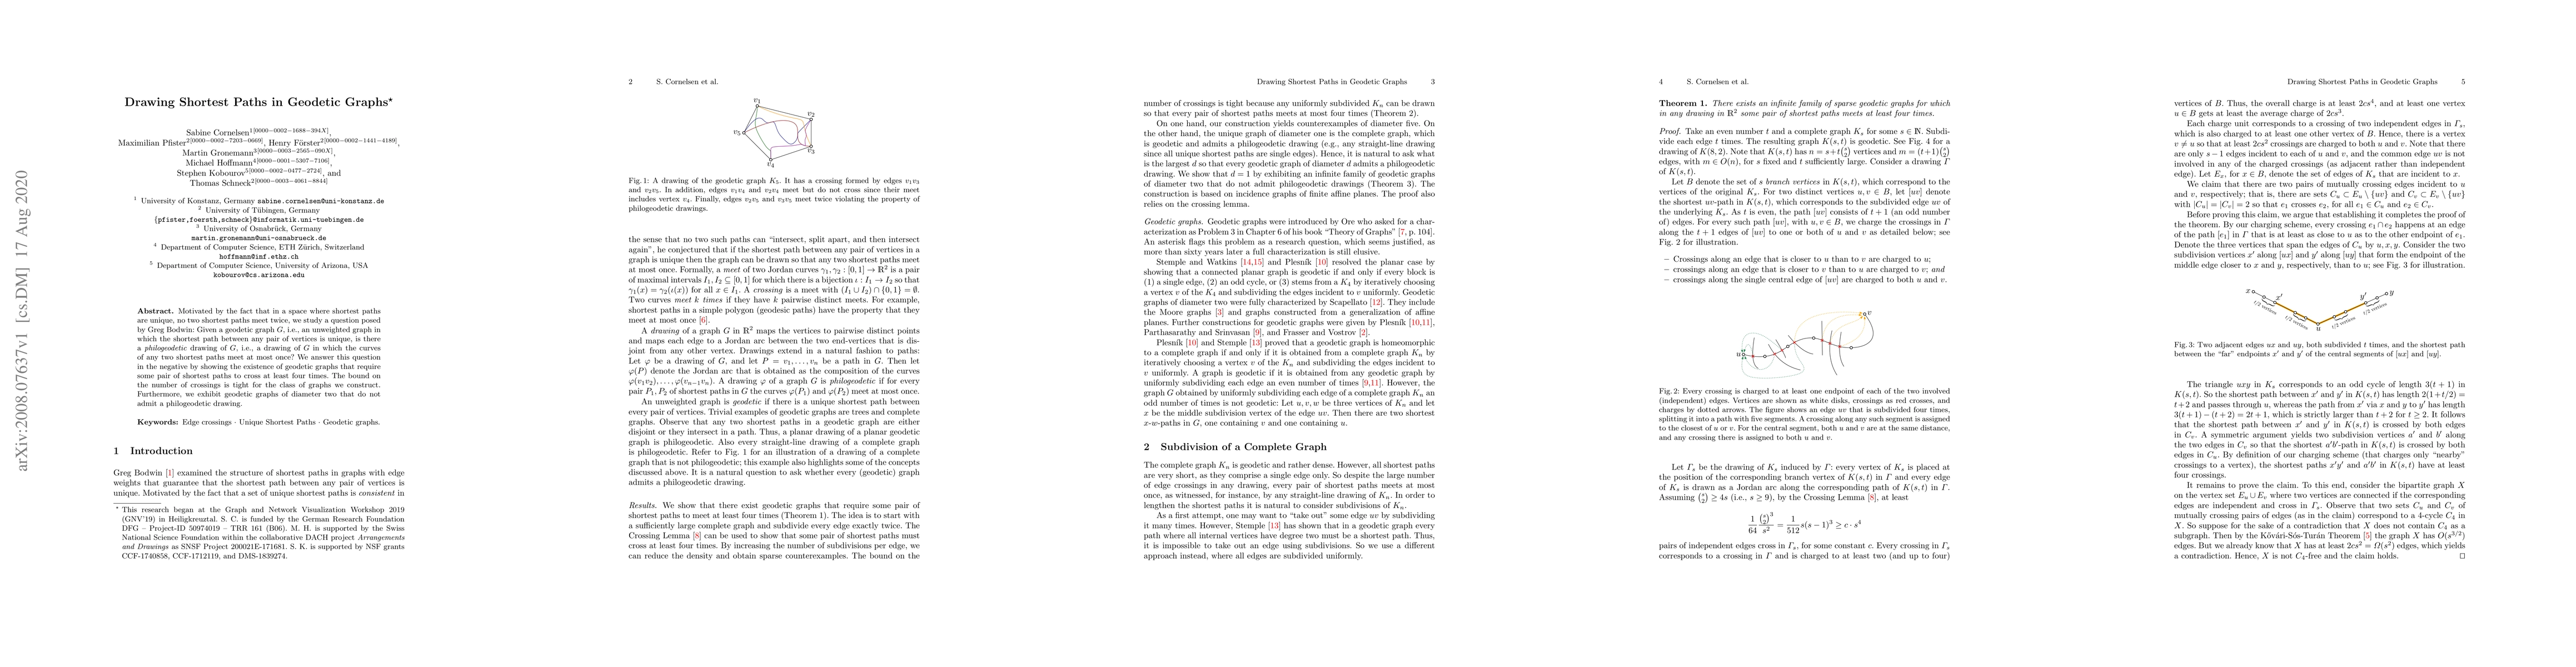
Motivated by the fact that in a space where shortest paths are unique, no two shortest paths meet twice, we study a question posed by Greg Bodwin: Given a geodetic graph $G$, i.e., an unweighted gra...
Readability criteria, such as distance or neighborhood preservation, are often used to optimize node-link representations of graphs to enable the comprehension of the underlying data. With few excep...
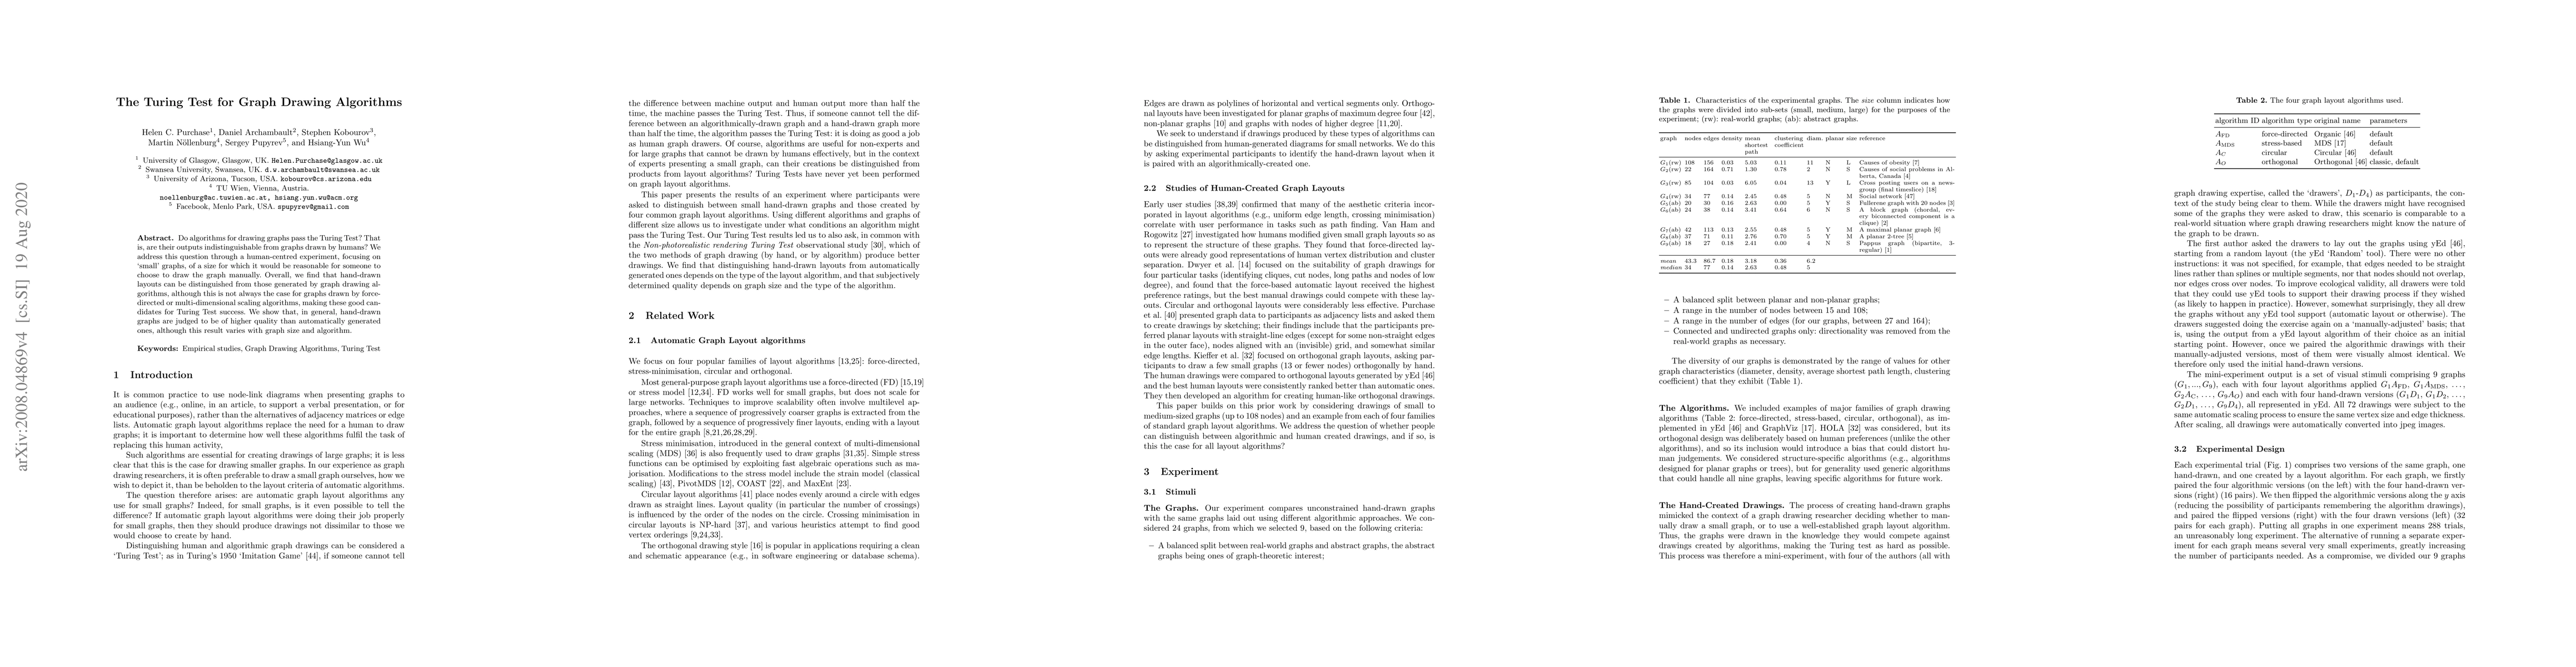
Do algorithms for drawing graphs pass the Turing Test? That is, are their outputs indistinguishable from graphs drawn by humans? We address this question through a human-centred experiment, focusing...
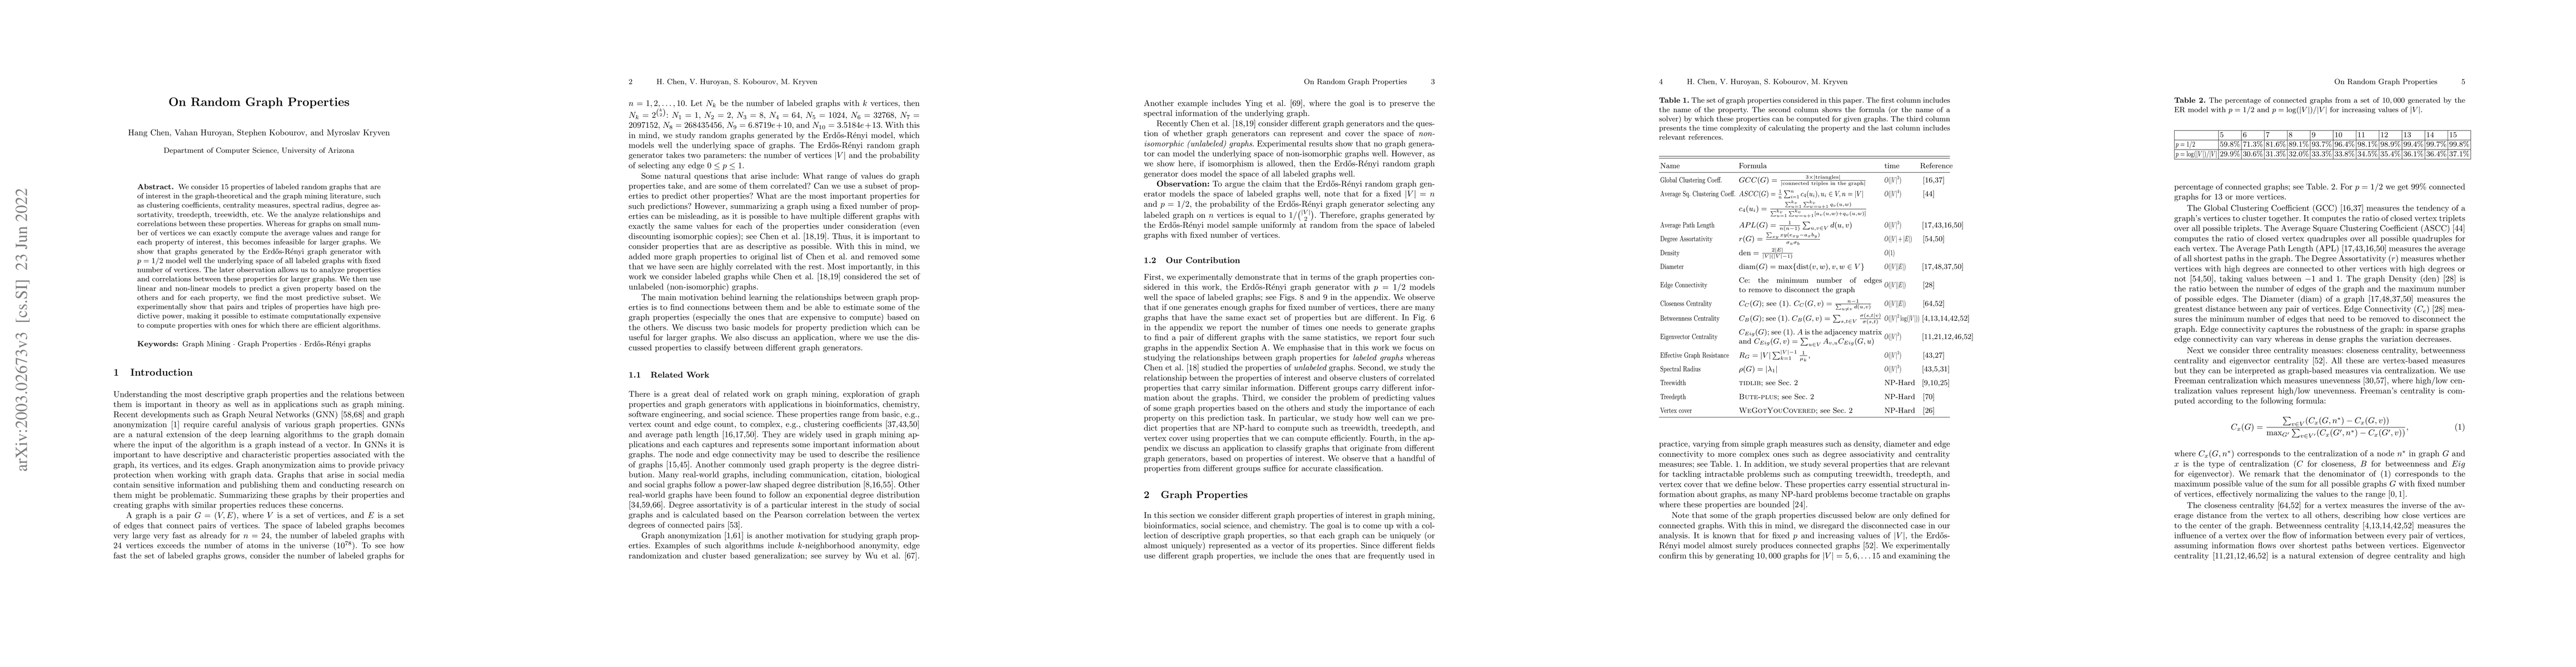
We consider 15 properties of labeled random graphs that are of interest in the graph-theoretical and the graph mining literature, such as clustering coefficients, centrality measures, spectral radiu...
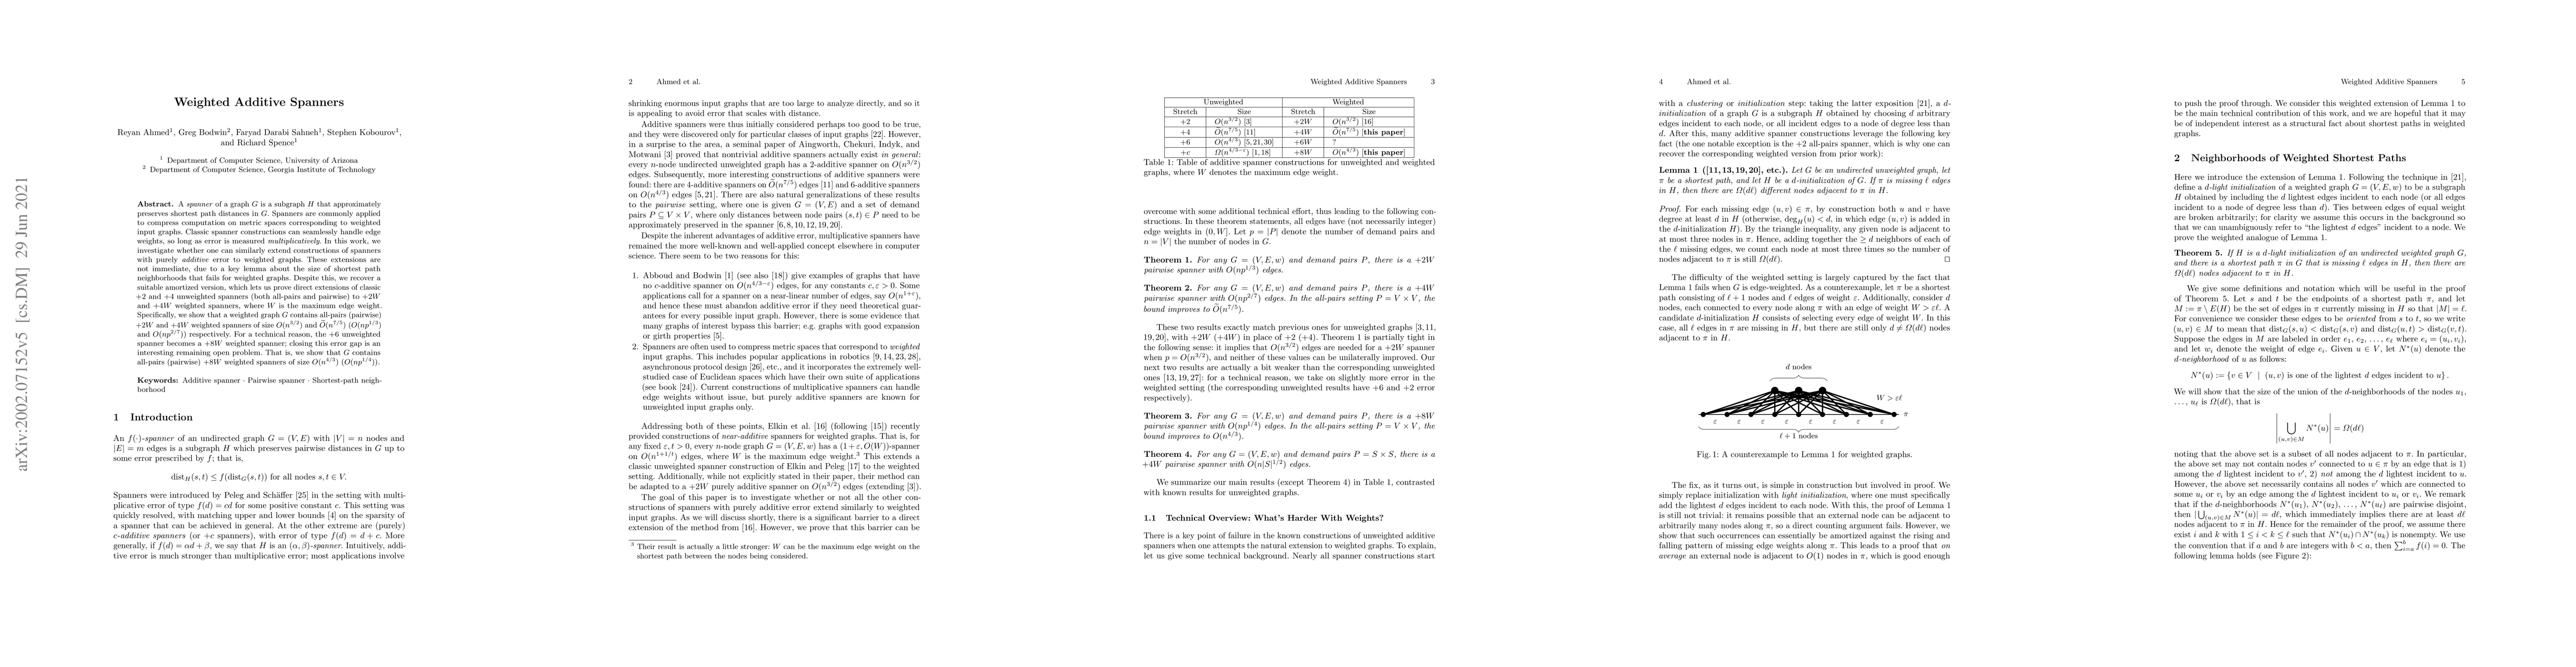
A \emph{spanner} of a graph $G$ is a subgraph $H$ that approximately preserves shortest path distances in $G$. Spanners are commonly applied to compress computation on metric spaces corresponding to...
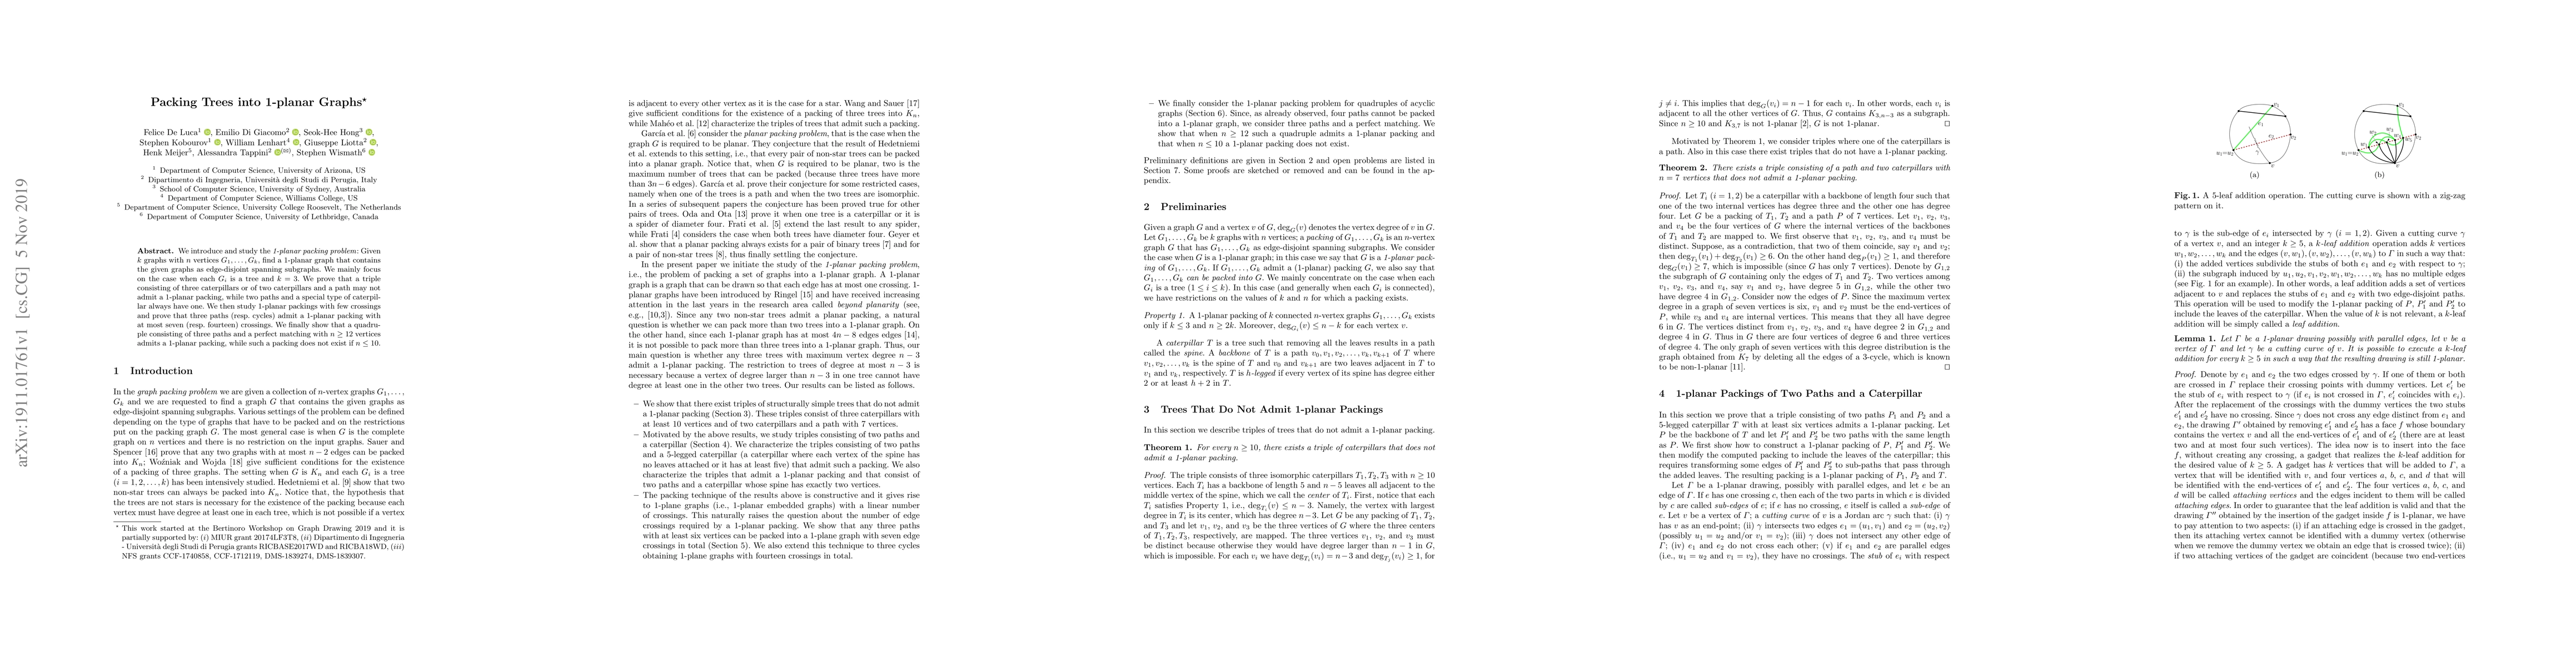
We introduce and study the 1-planar packing problem: Given $k$ graphs with $n$ vertices $G_1, \dots, G_k$, find a 1-planar graph that contains the given graphs as edge-disjoint spanning subgraphs. W...
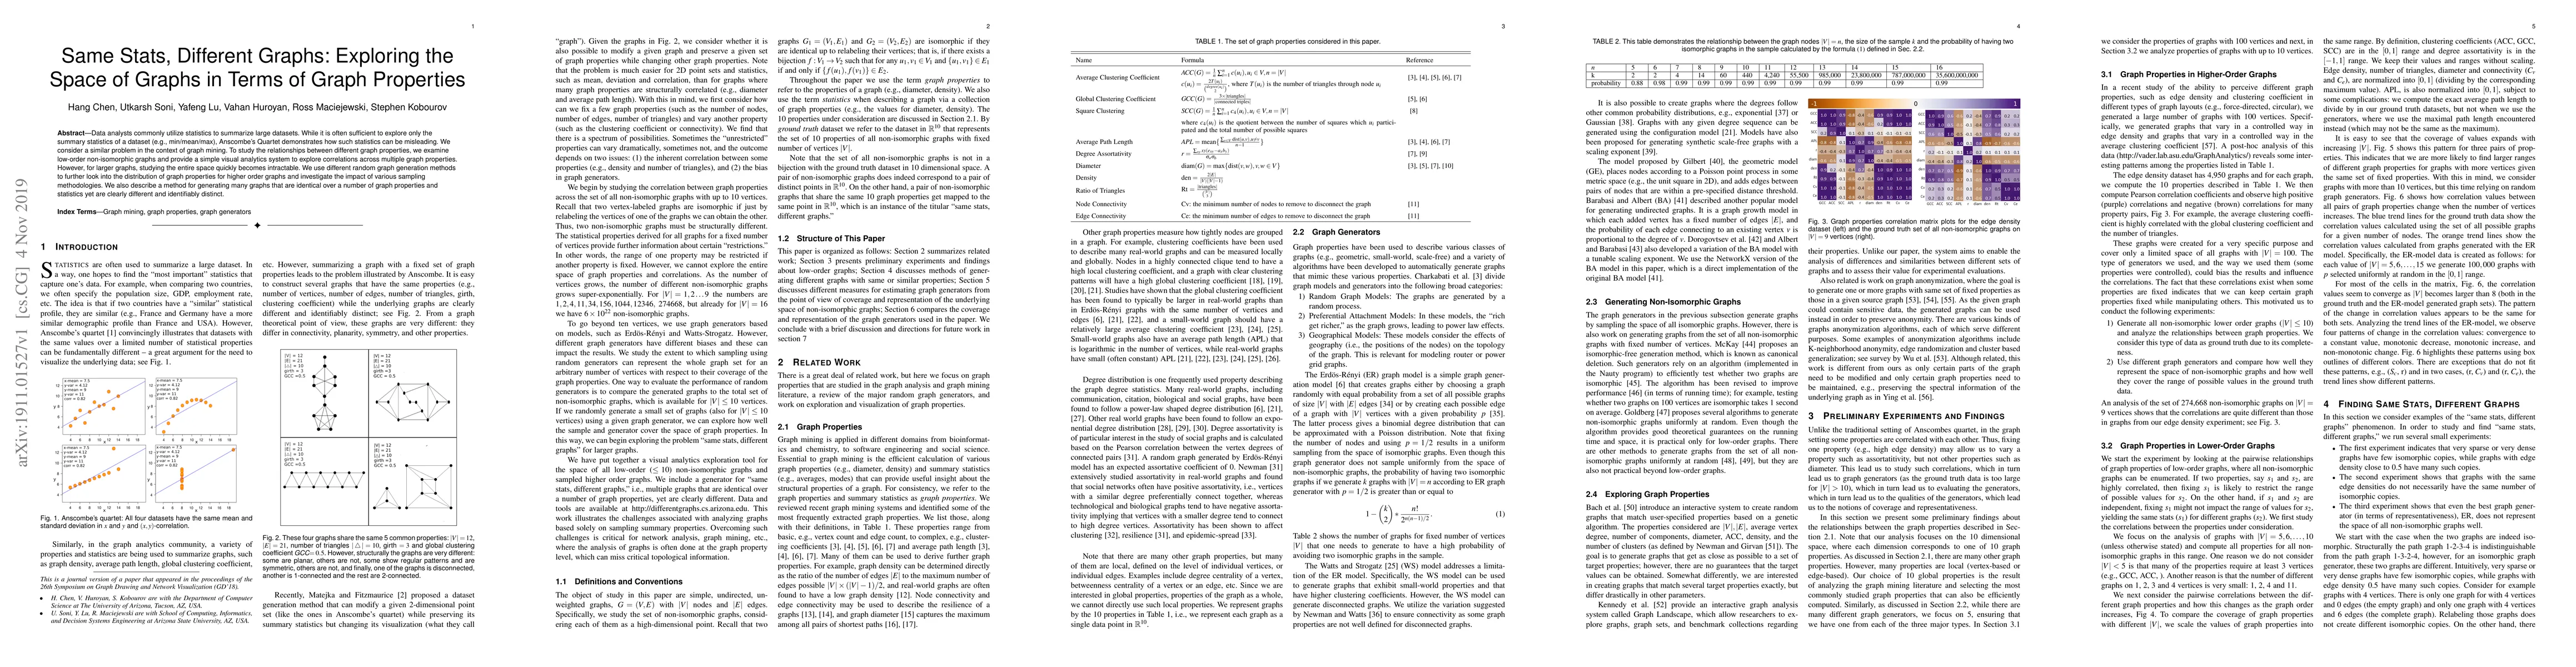
Data analysts commonly utilize statistics to summarize large datasets. While it is often sufficient to explore only the summary statistics of a dataset (e.g., min/mean/max), Anscombe's Quartet demon...
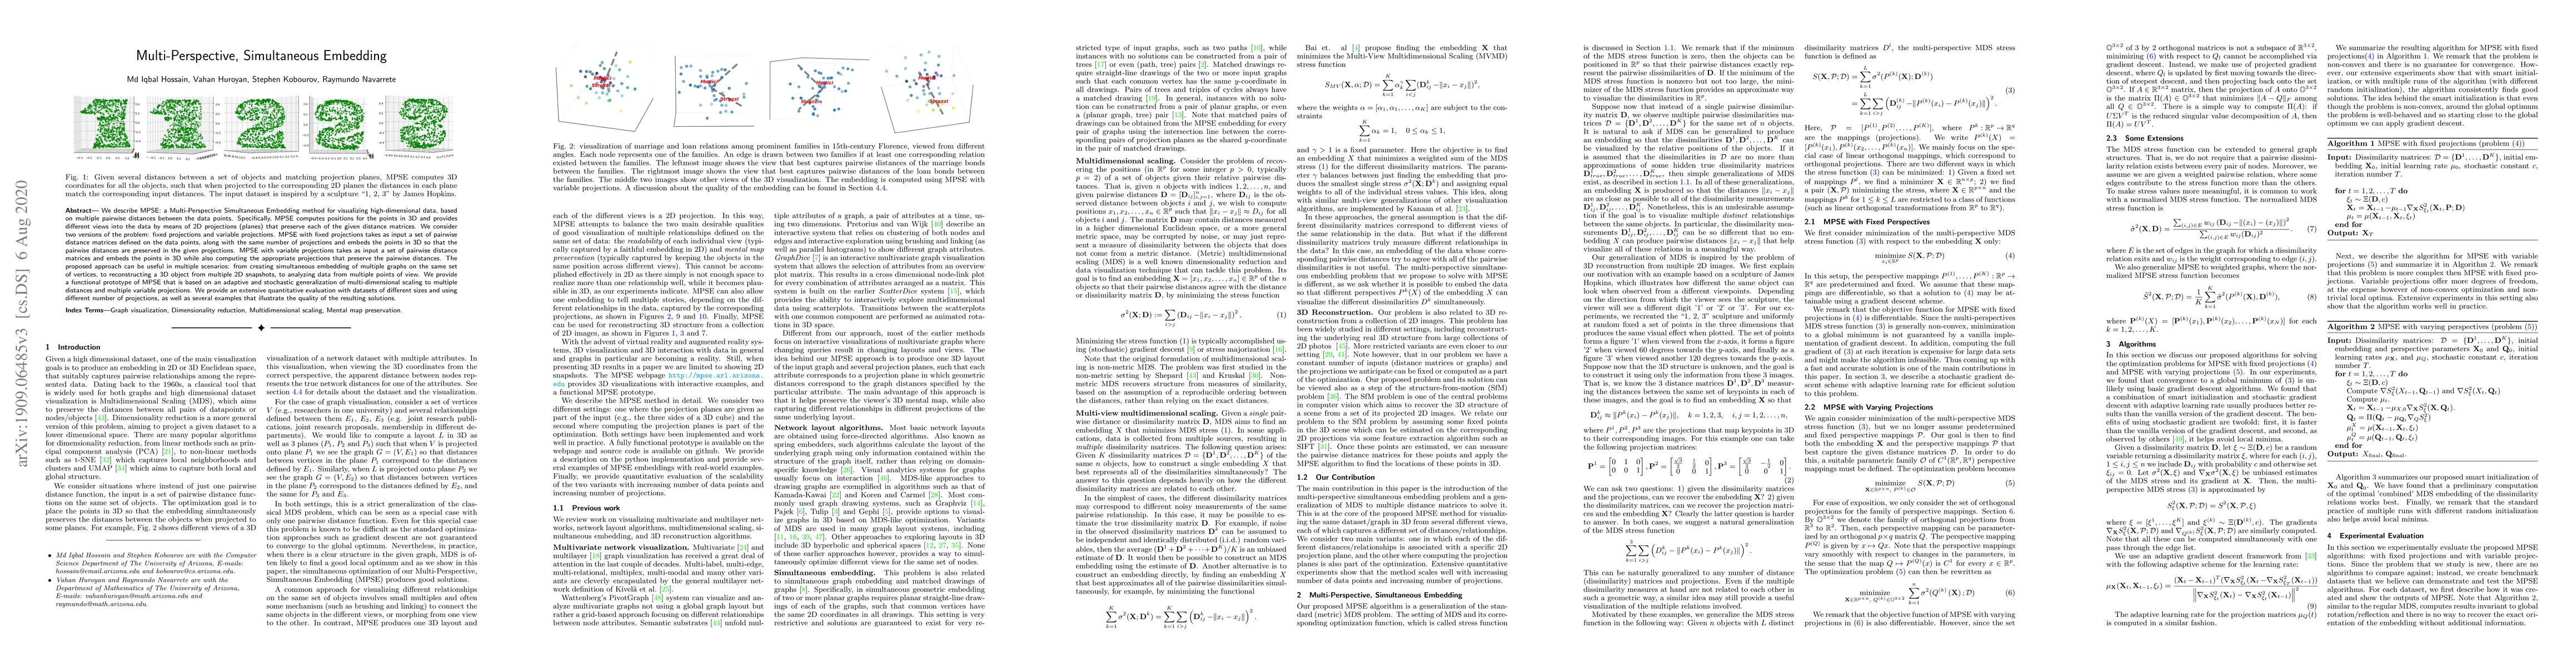
We describe MPSE: a Multi-Perspective Simultaneous Embedding method for visualizing high-dimensional data, based on multiple pairwise distances between the data points. Specifically, MPSE computes p...
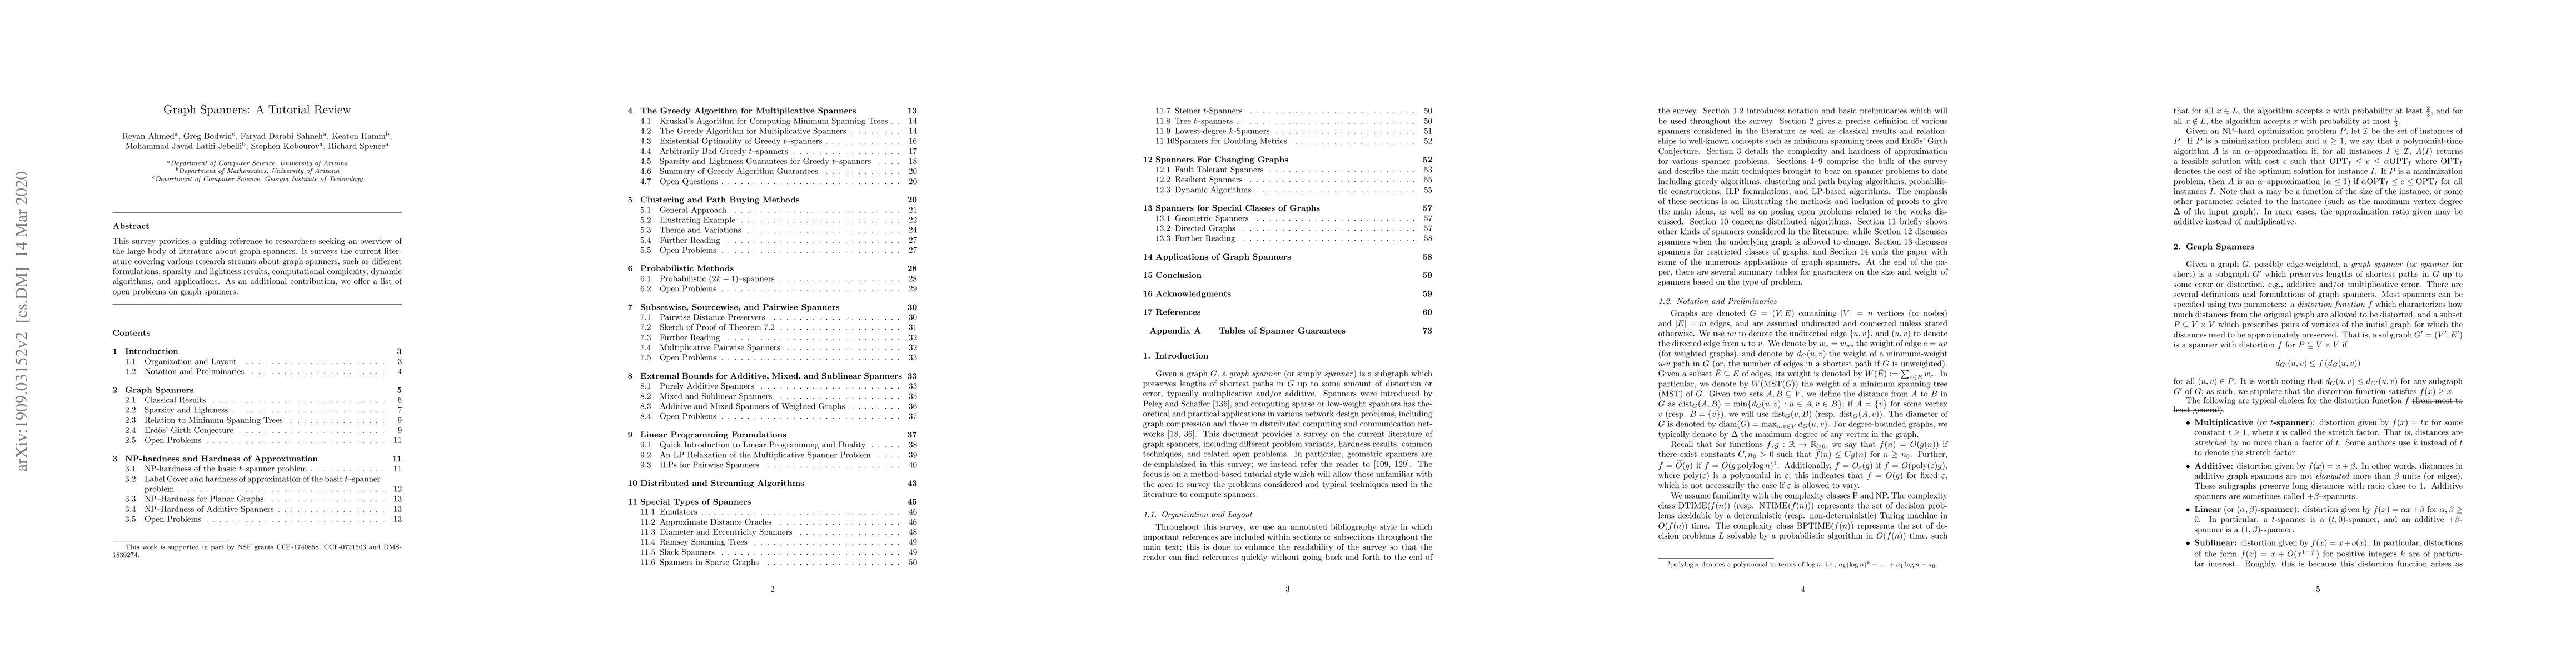
This tutorial review provides a guiding reference to researchers who want to have an overview of the large body of literature about graph spanners. It reviews the current literature covering various...
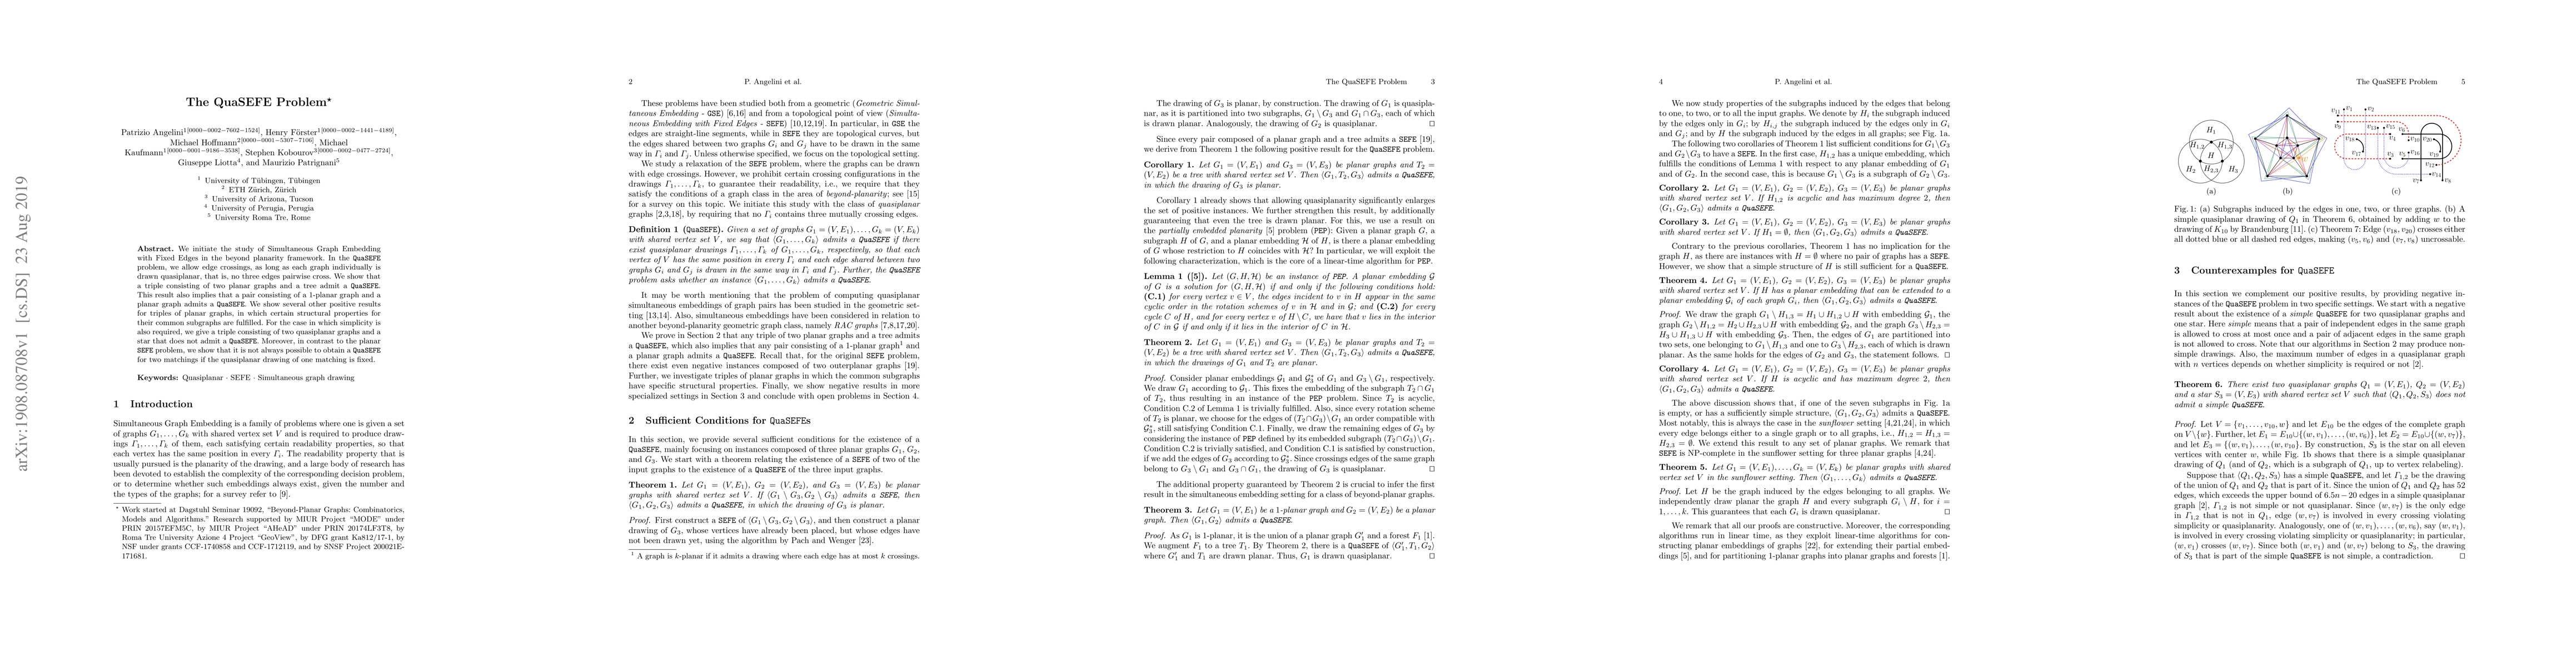
We initiate the study of Simultaneous Graph Embedding with Fixed Edges in the beyond planarity framework. In the QuaSEFE problem, we allow edge crossings, as long as each graph individually is drawn...
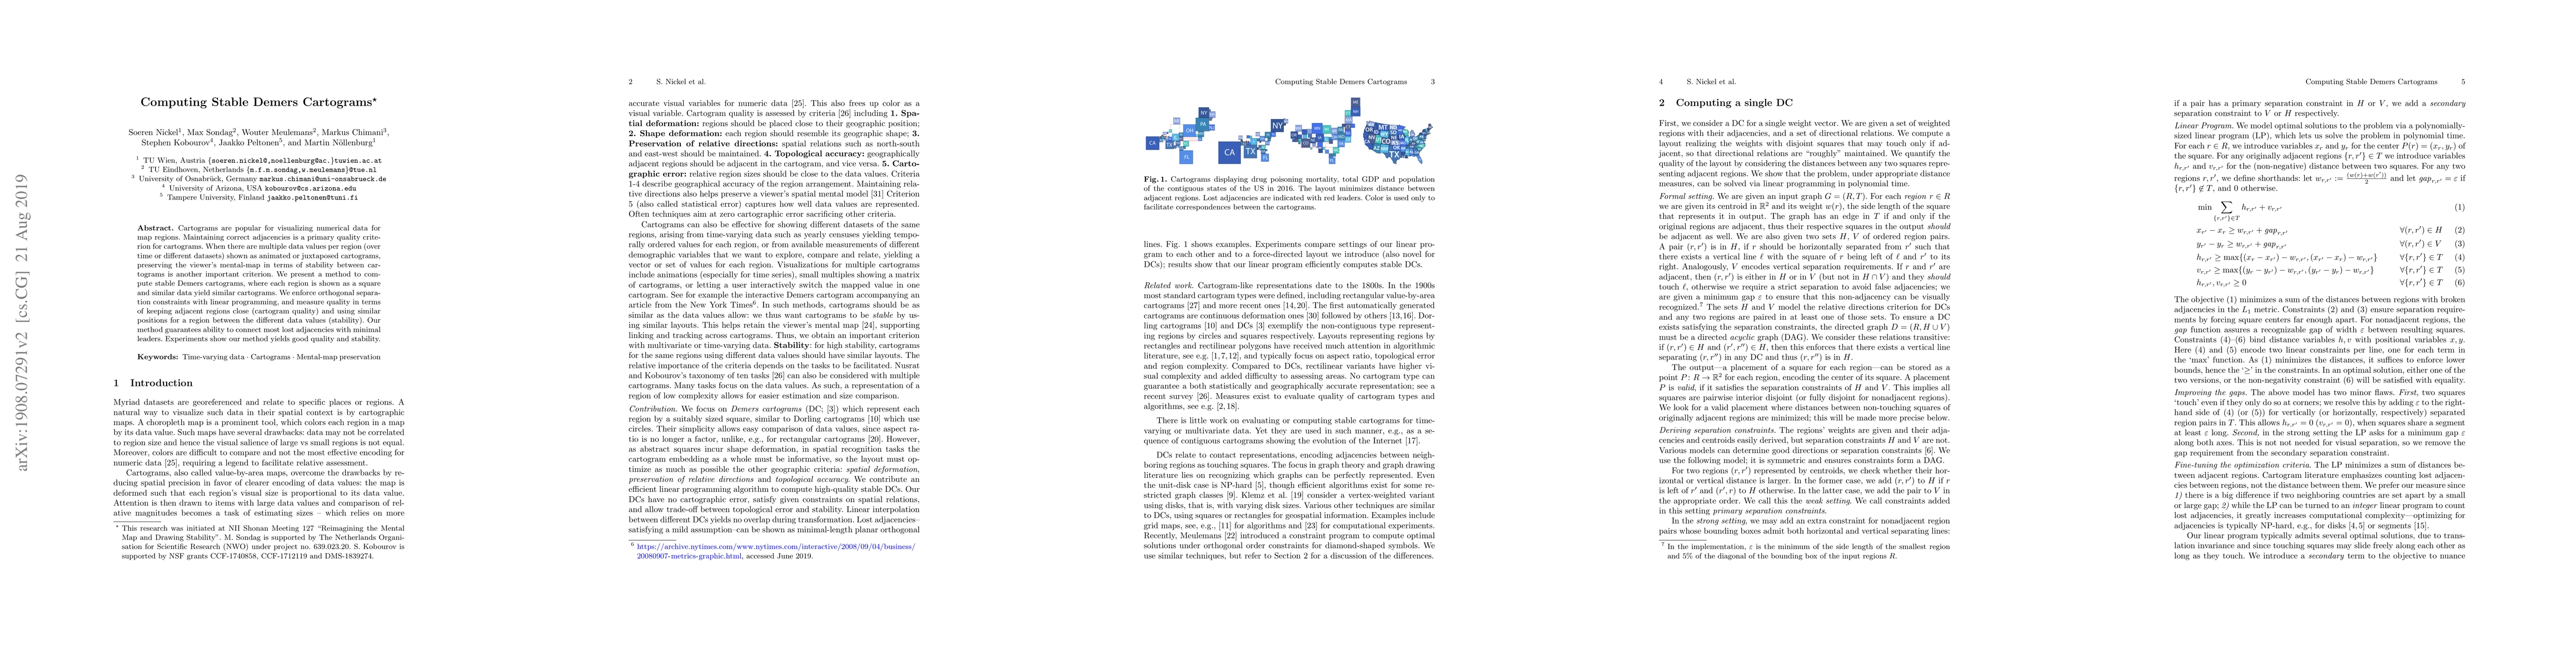
Cartograms are popular for visualizing numerical data for map regions. Maintaining correct adjacencies is a primary quality criterion for cartograms. When there are multiple data values per region (...
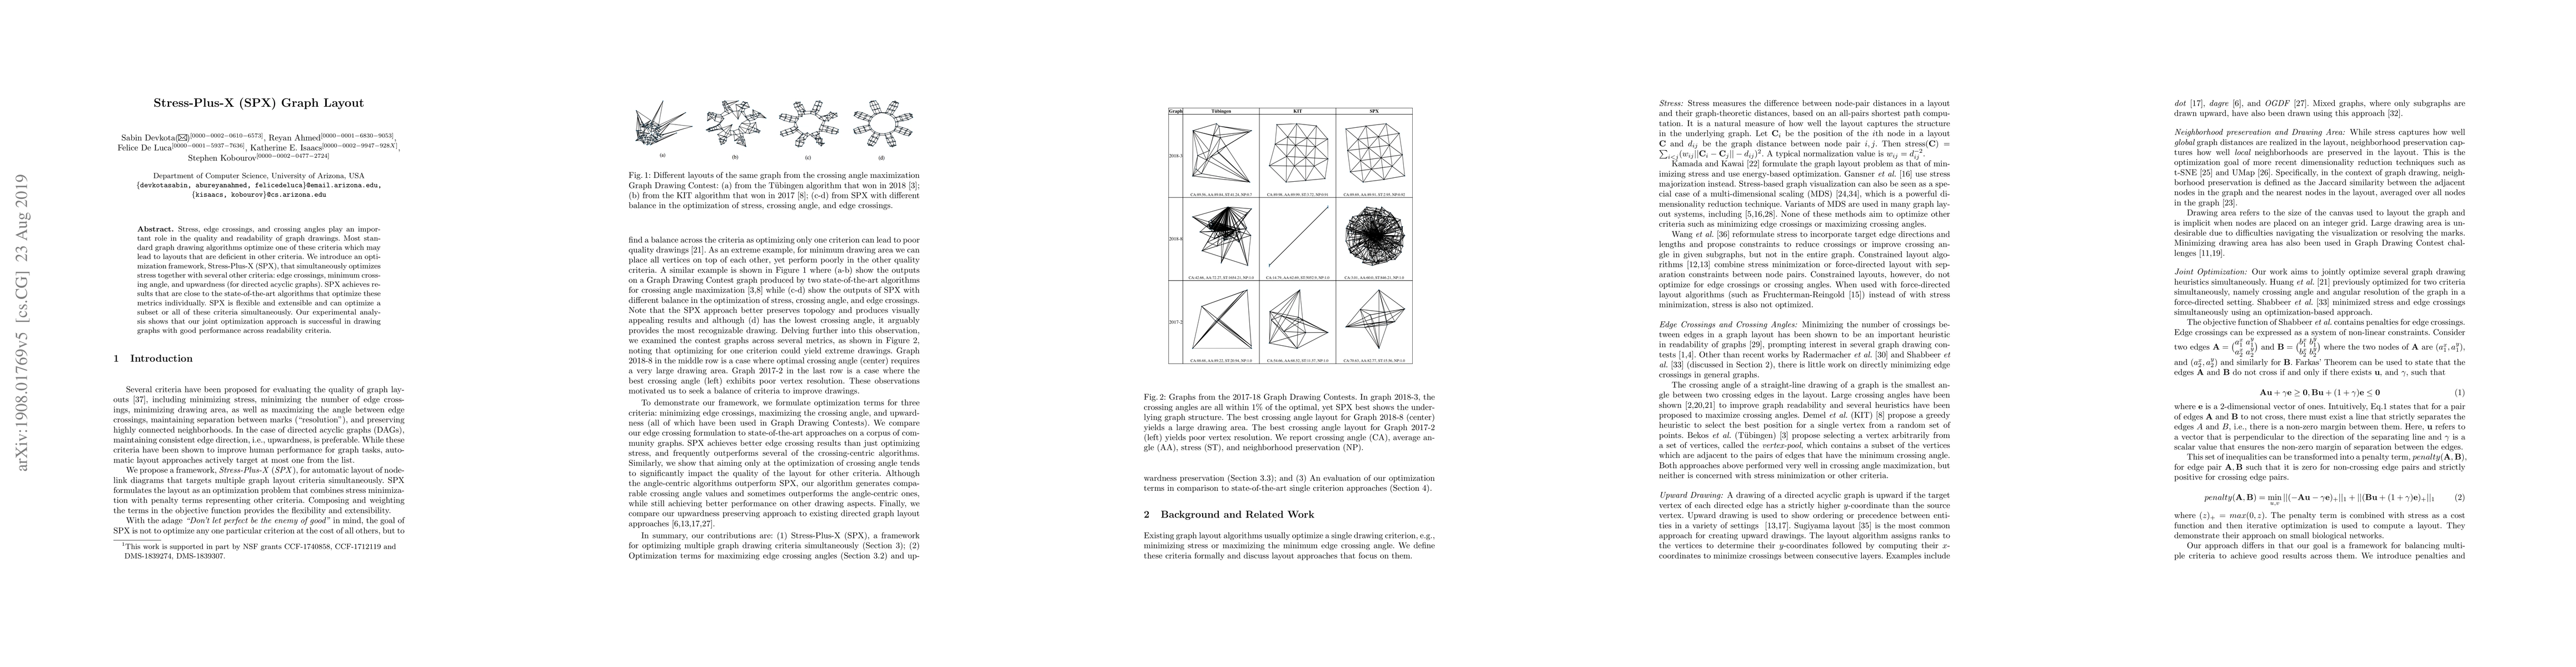
Stress, edge crossings, and crossing angles play an important role in the quality and readability of graph drawings. Most standard graph drawing algorithms optimize one of these criteria which may l...
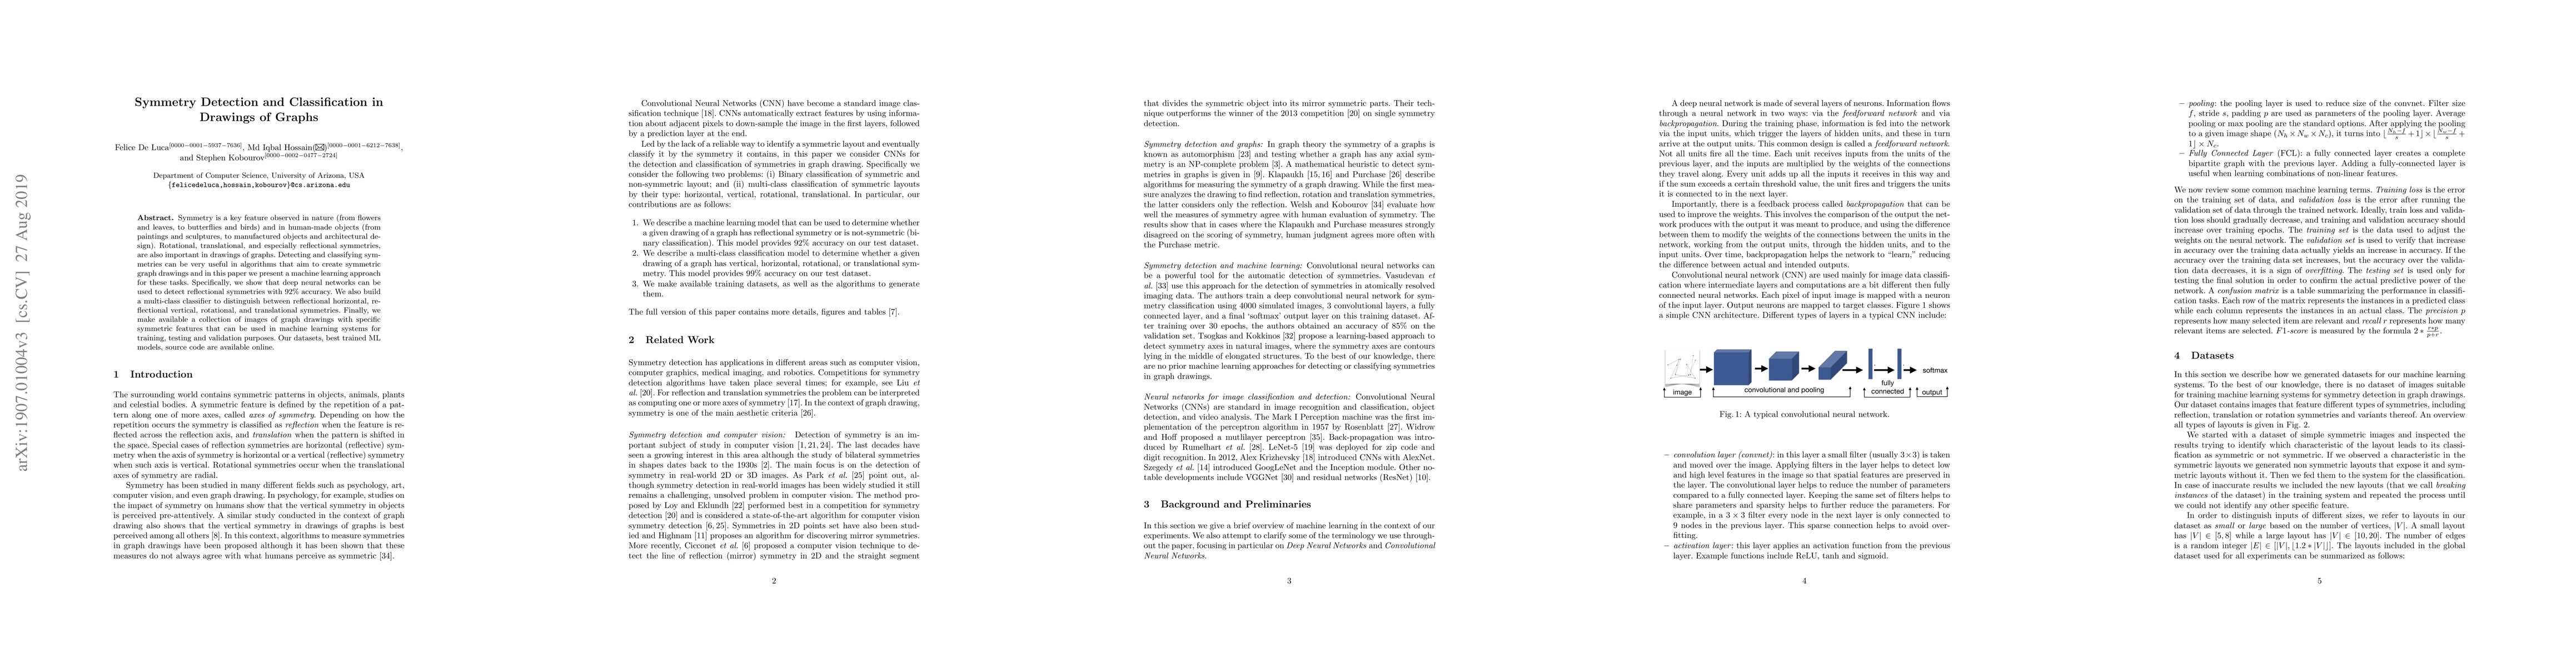
Symmetry is a key feature observed in nature (from flowers and leaves, to butterflies and birds) and in human-made objects (from paintings and sculptures, to manufactured objects and architectural d...
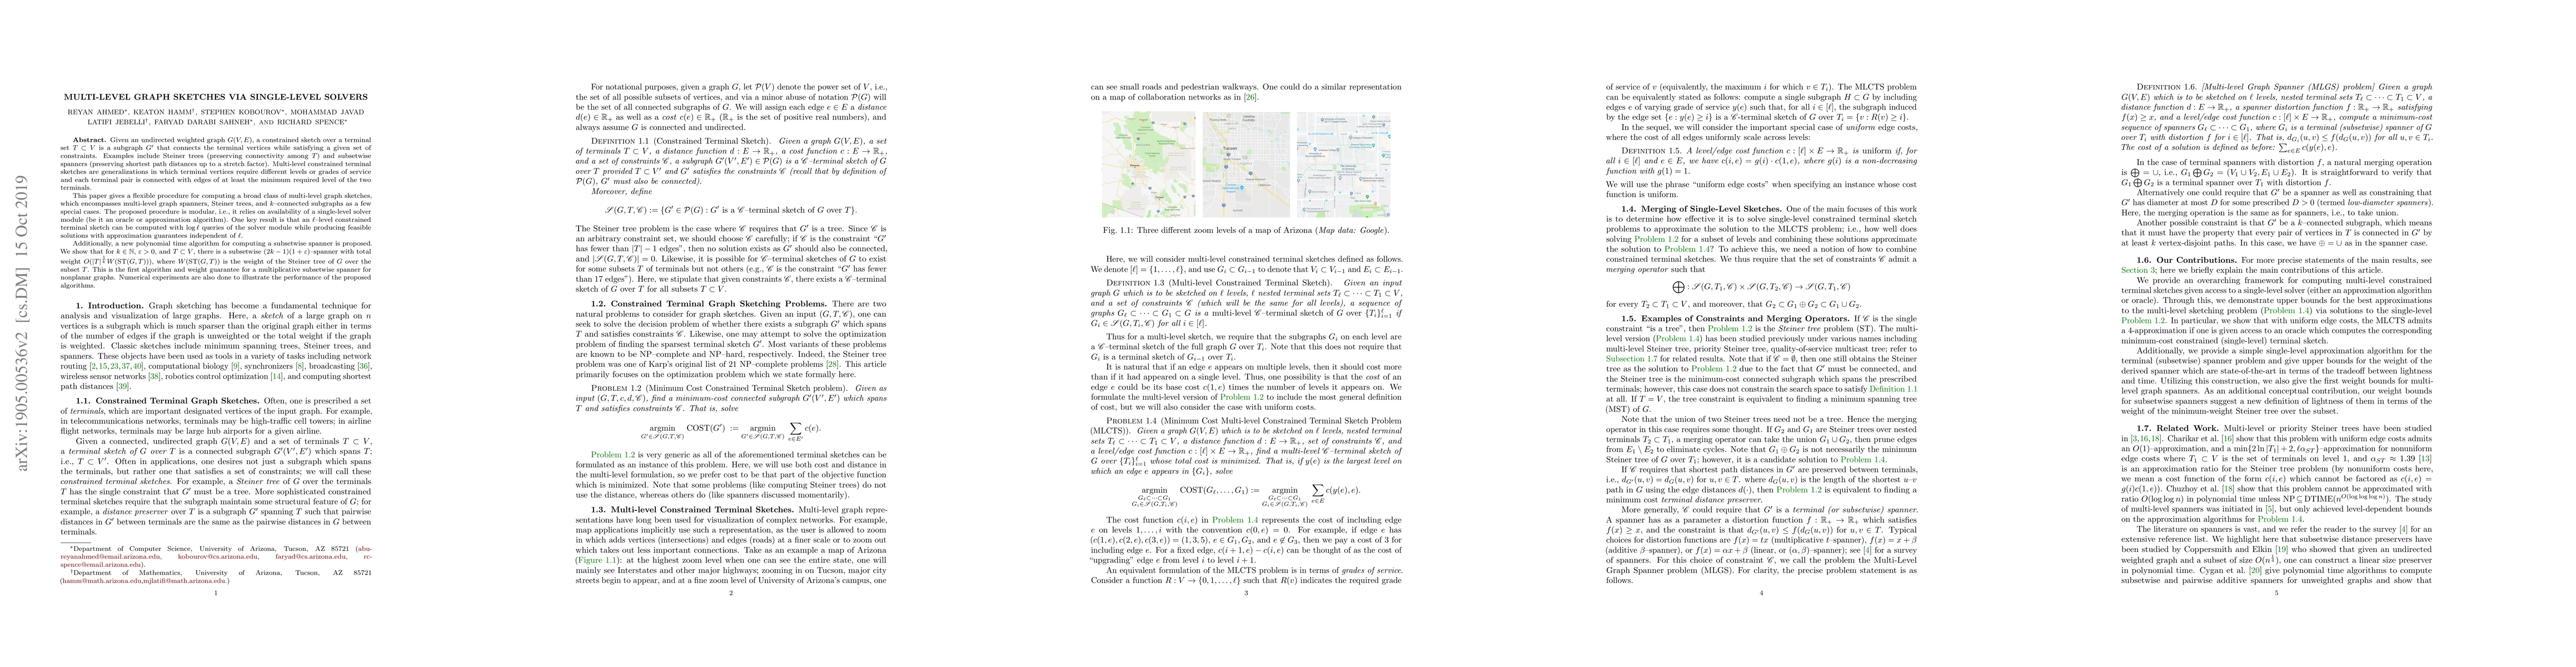
Given an undirected weighted graph $G(V,E)$, a constrained sketch over a terminal set $T\subset V$ is a subgraph $G'$ that connects the terminal vertices while satisfying a given set of constraints....
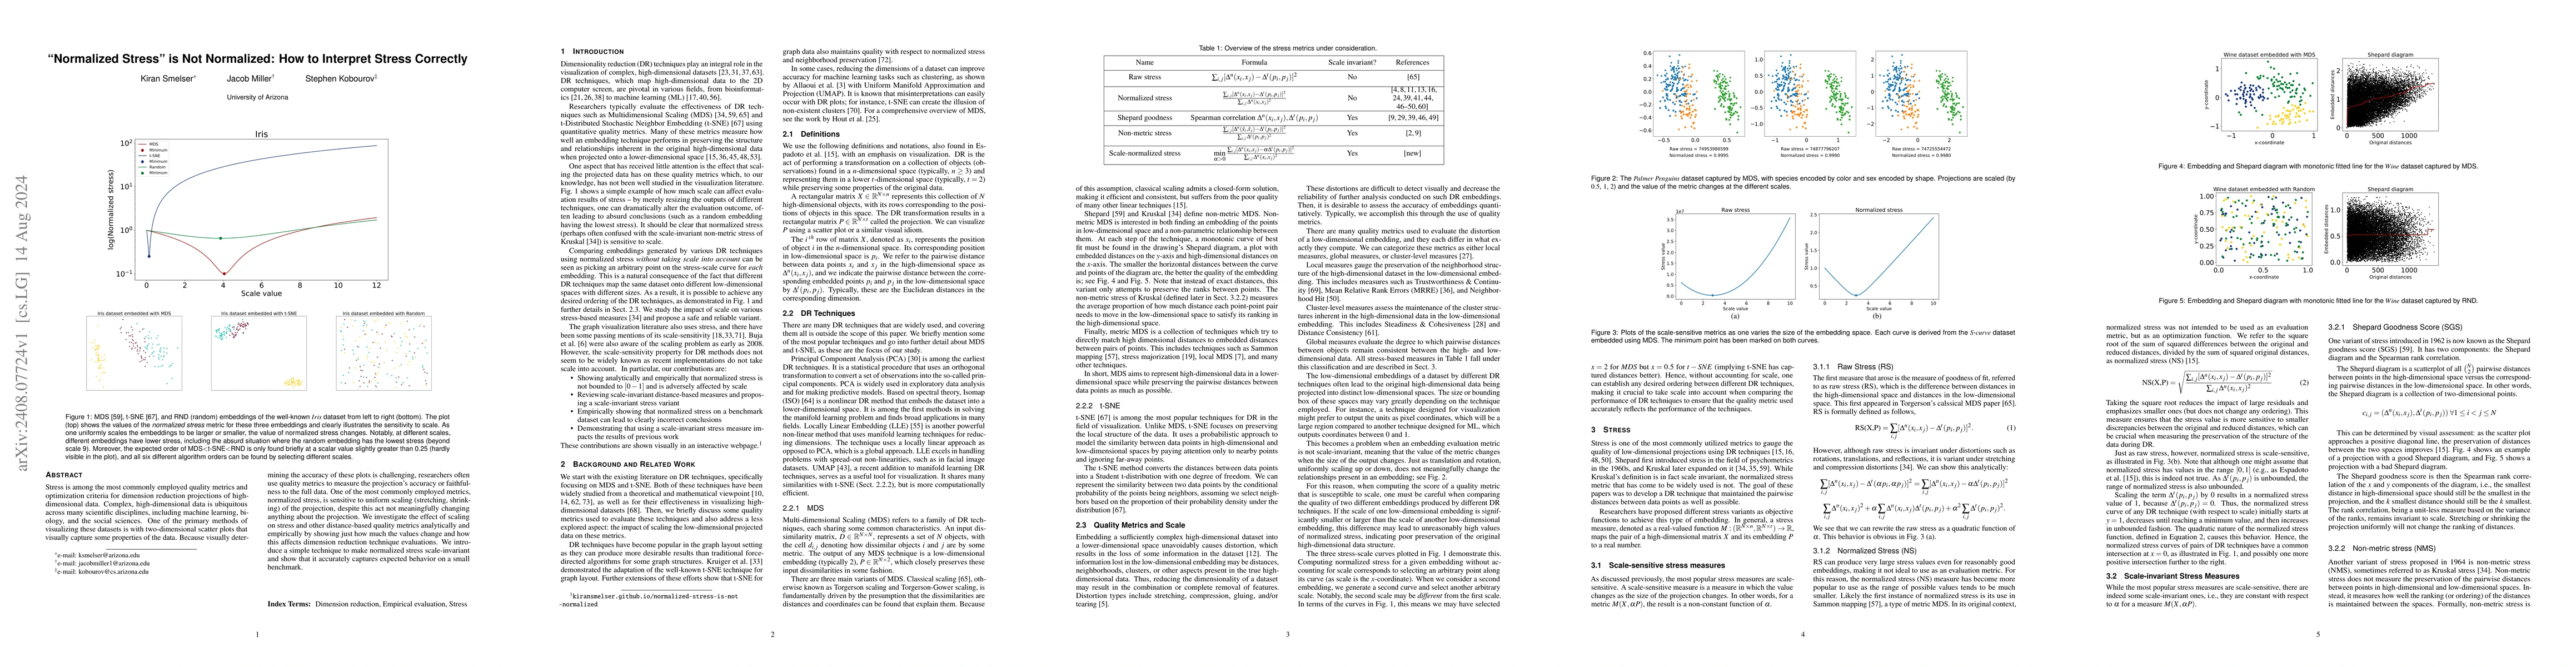
Stress is among the most commonly employed quality metrics and optimization criteria for dimension reduction projections of high dimensional data. Complex, high dimensional data is ubiquitous across m...
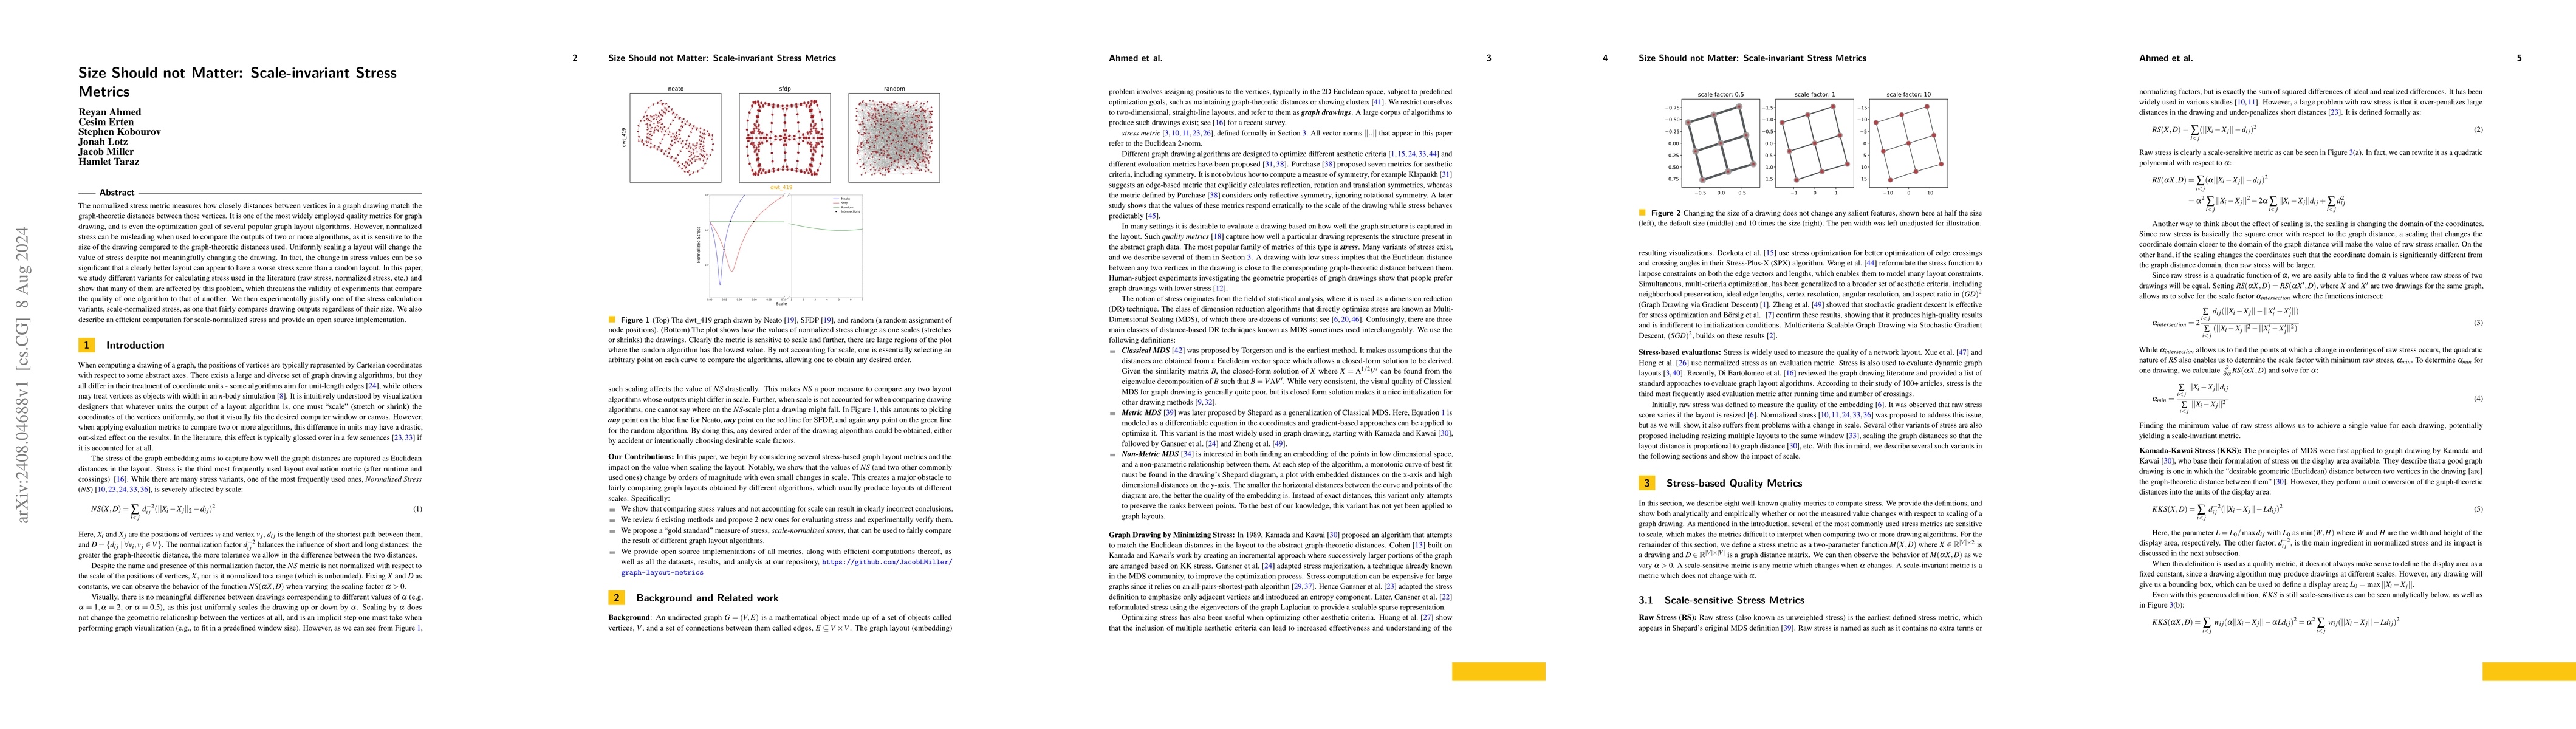
The normalized stress metric measures how closely distances between vertices in a graph drawing match the graph-theoretic distances between those vertices. It is one of the most widely employed qualit...
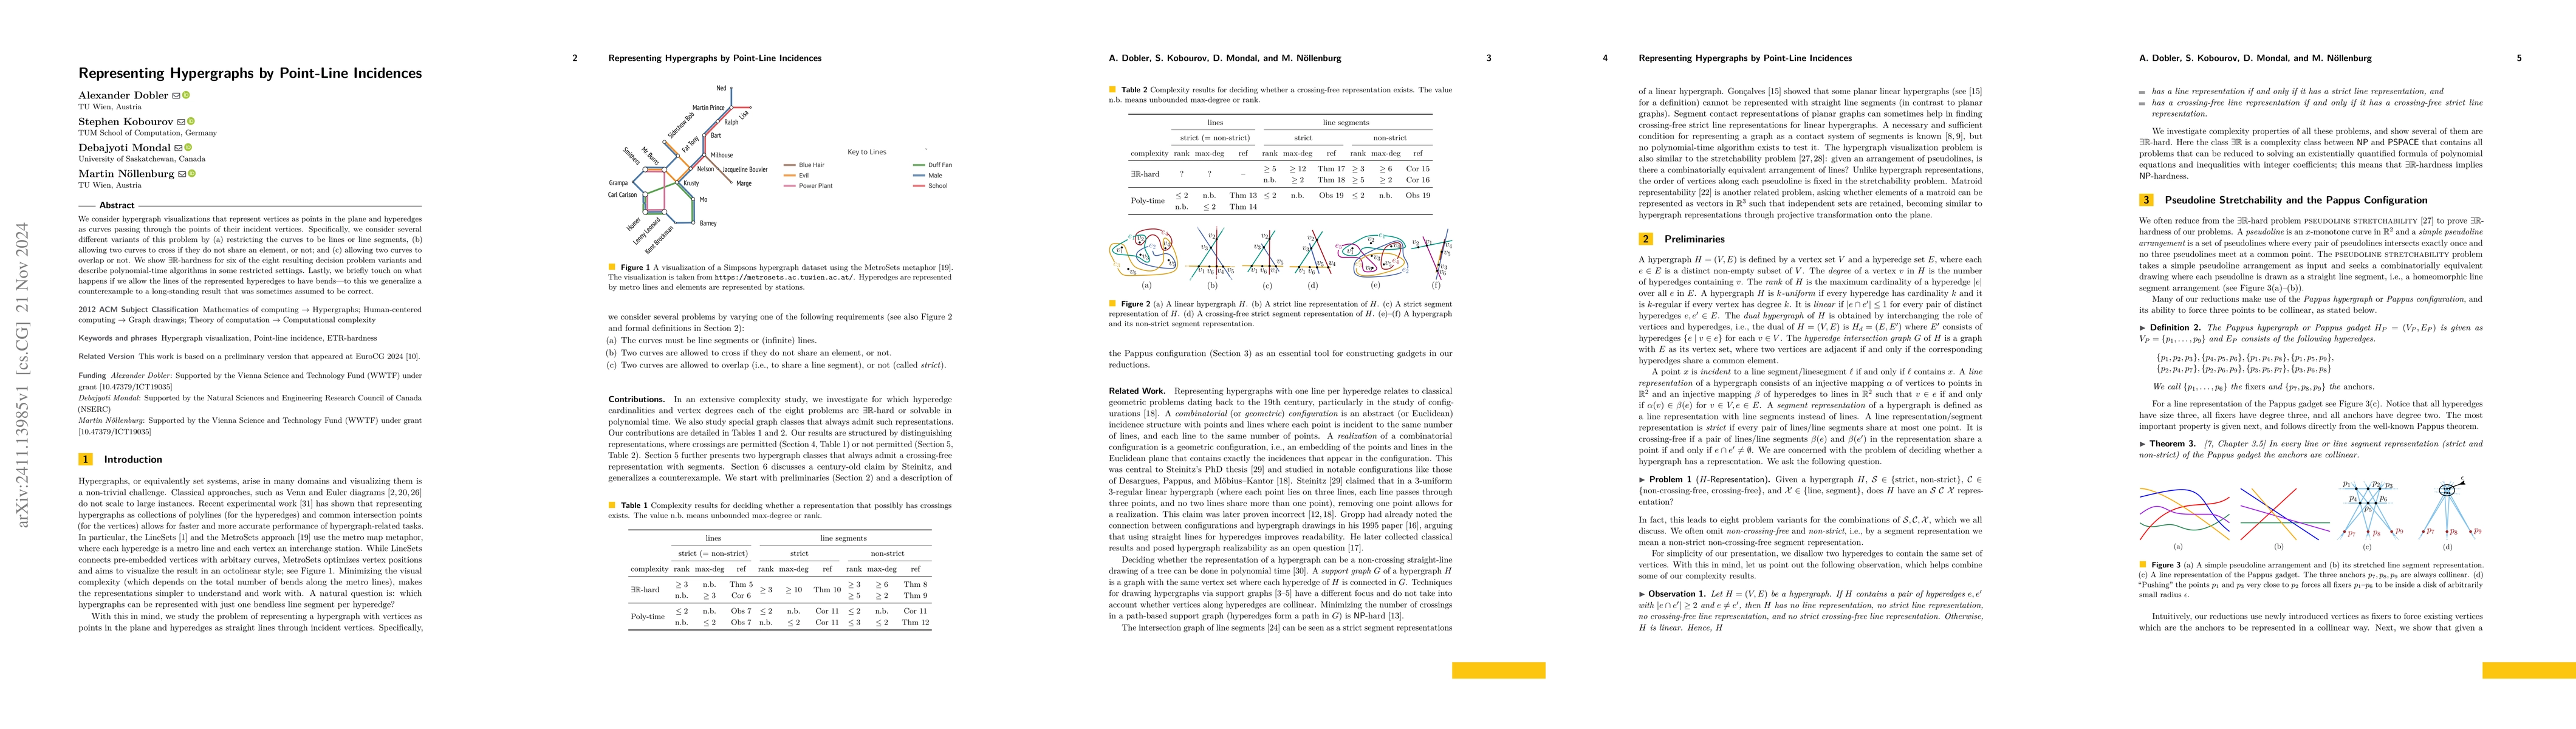
We consider hypergraph visualizations that represent vertices as points in the plane and hyperedges as curves passing through the points of their incident vertices. Specifically, we consider several d...
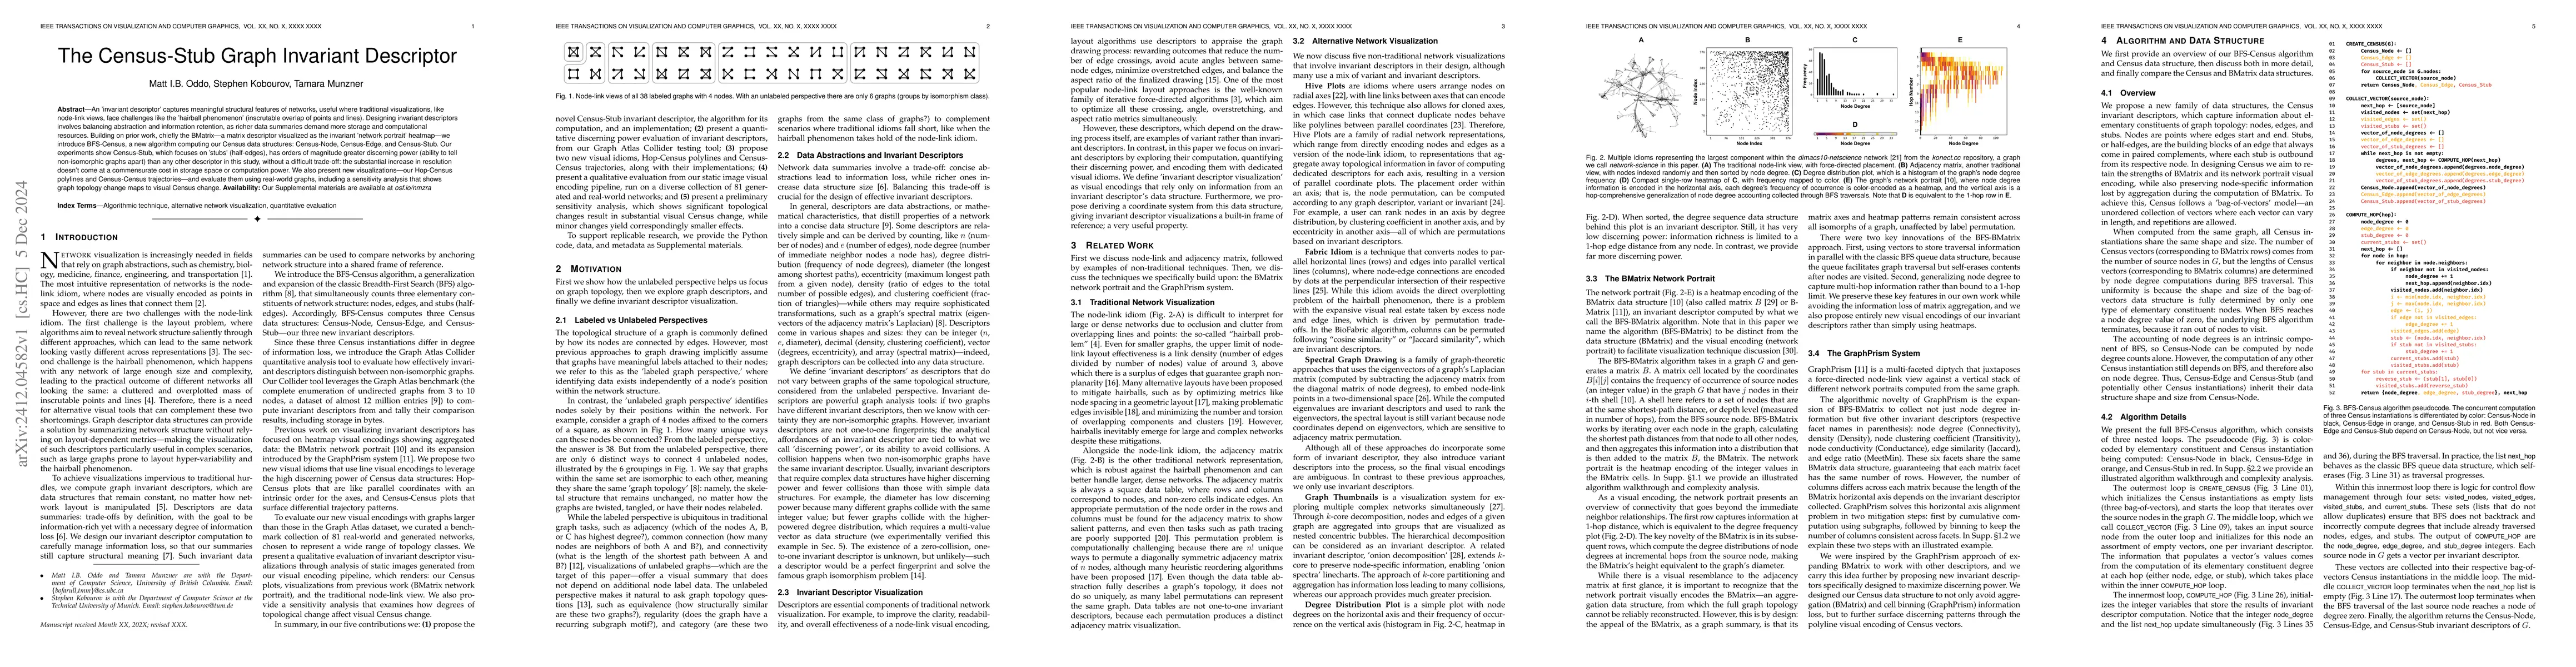
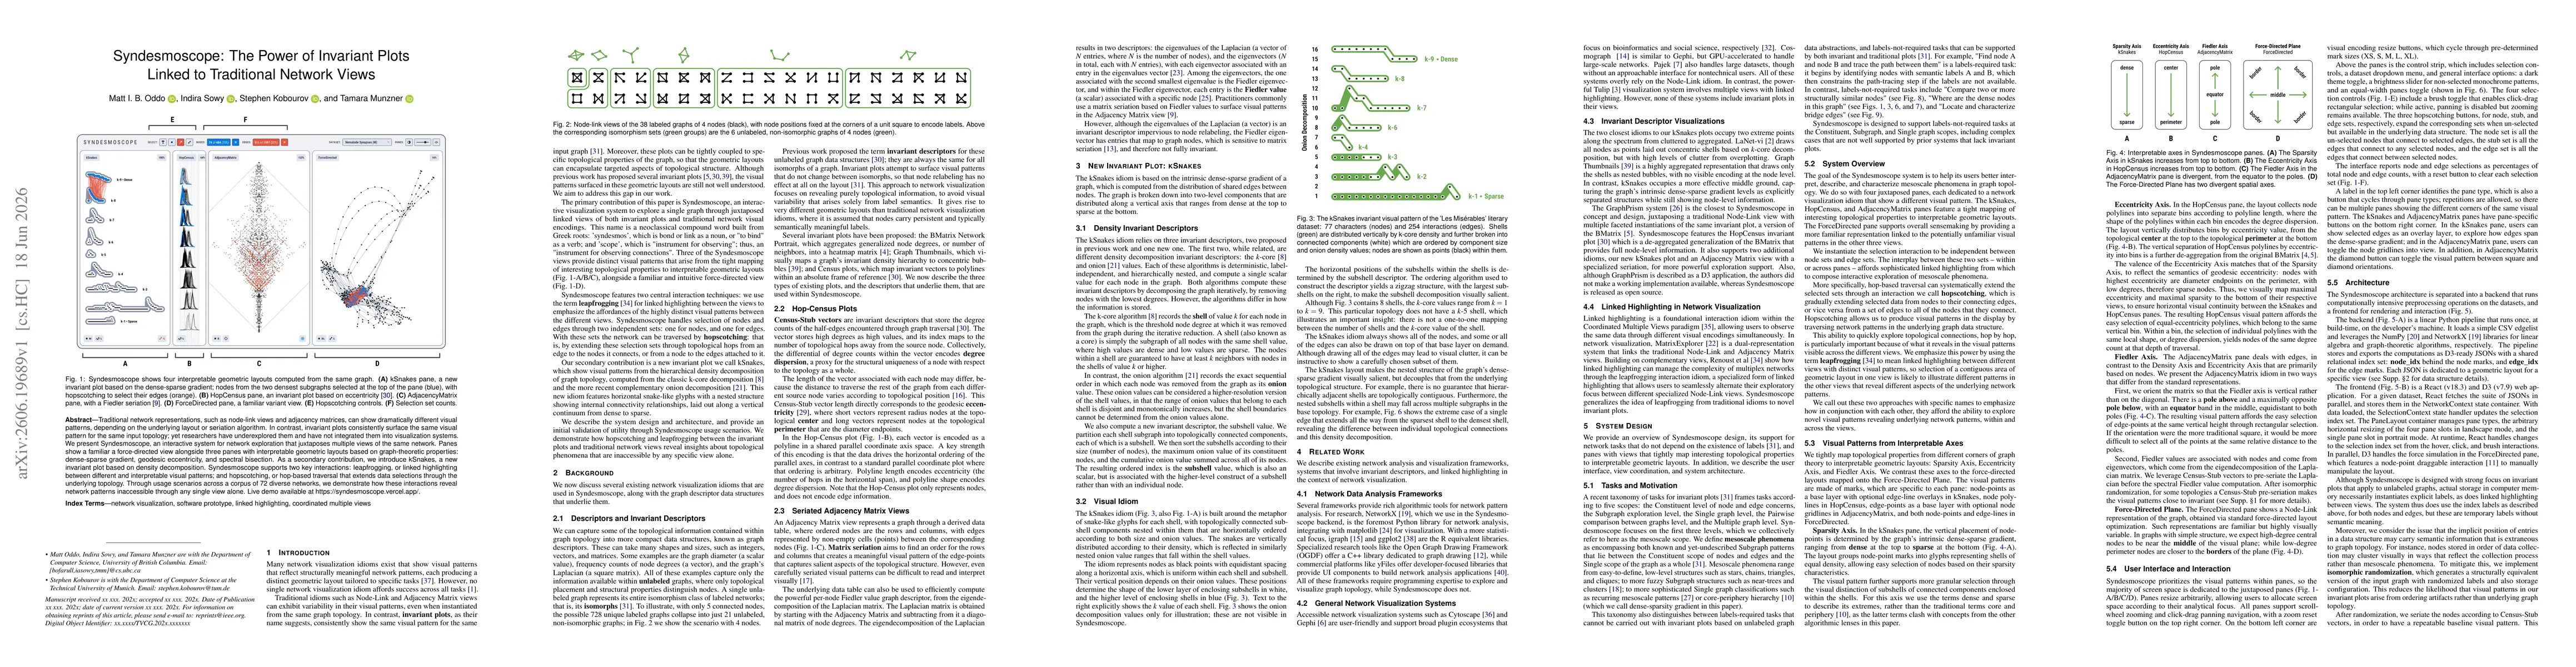
An invariant descriptor captures meaningful structural features of networks, useful where traditional visualizations, like node-link views, face challenges like the hairball phenomenon (inscrutable ov...
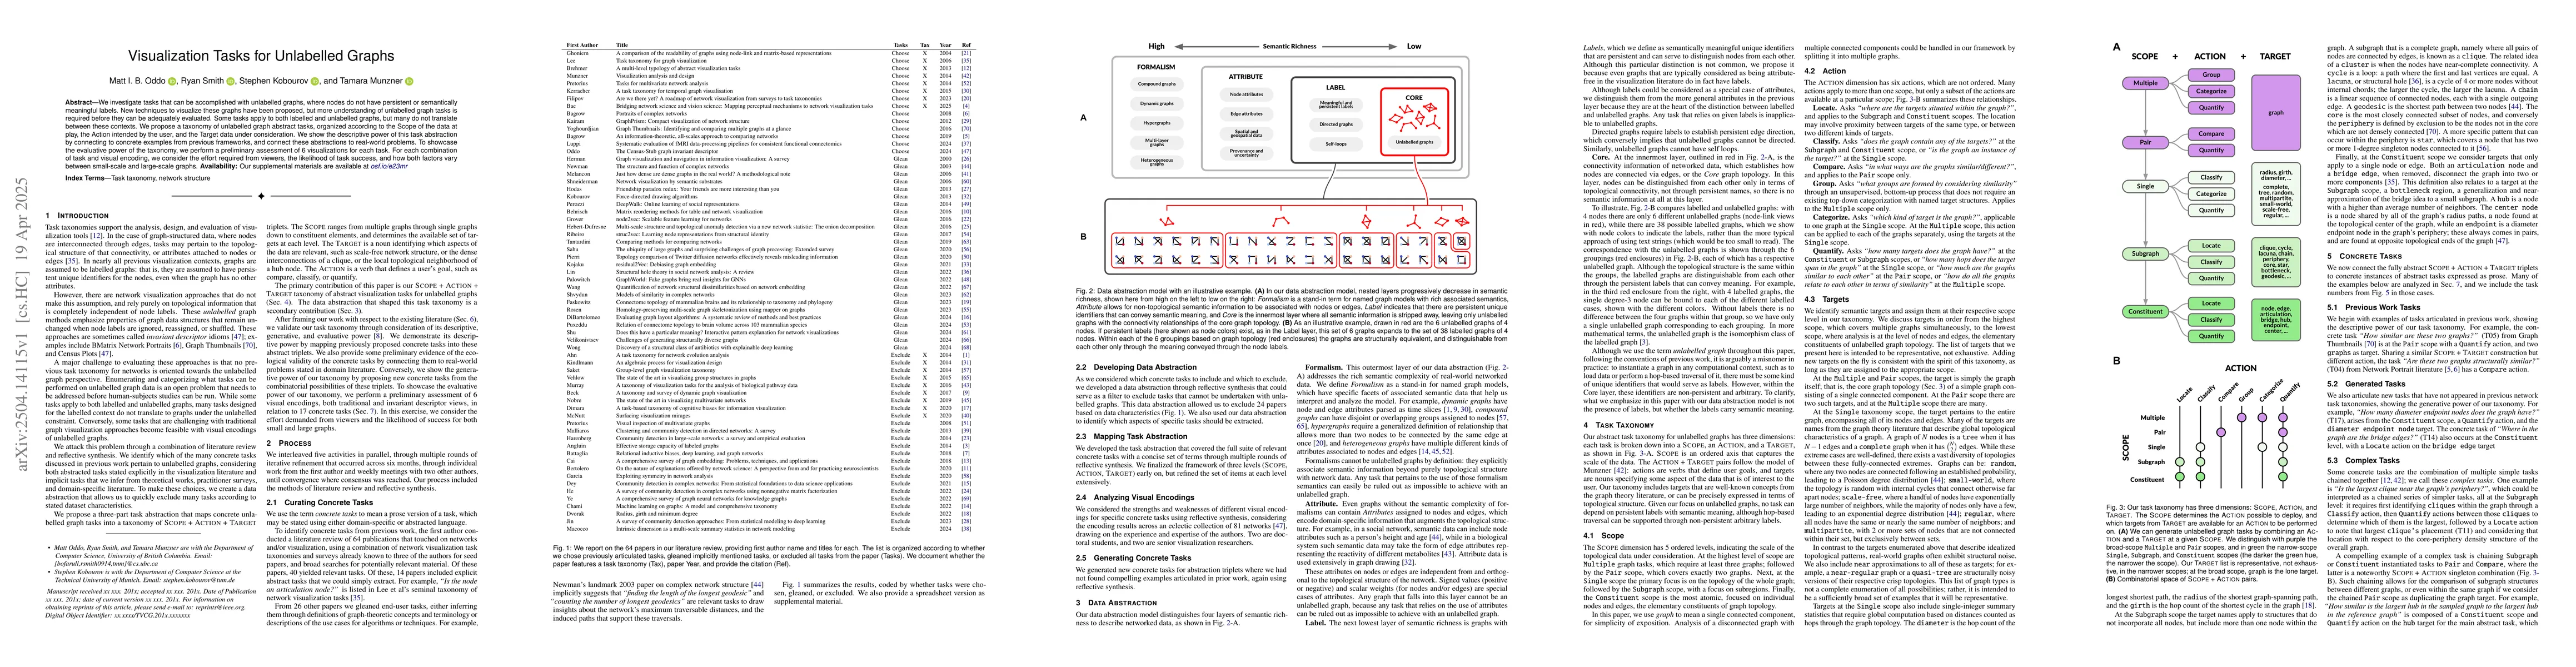
We investigate tasks that can be accomplished with unlabelled graphs, where nodes do not have persistent or semantically meaningful labels. New techniques to visualize these graphs have been proposed,...
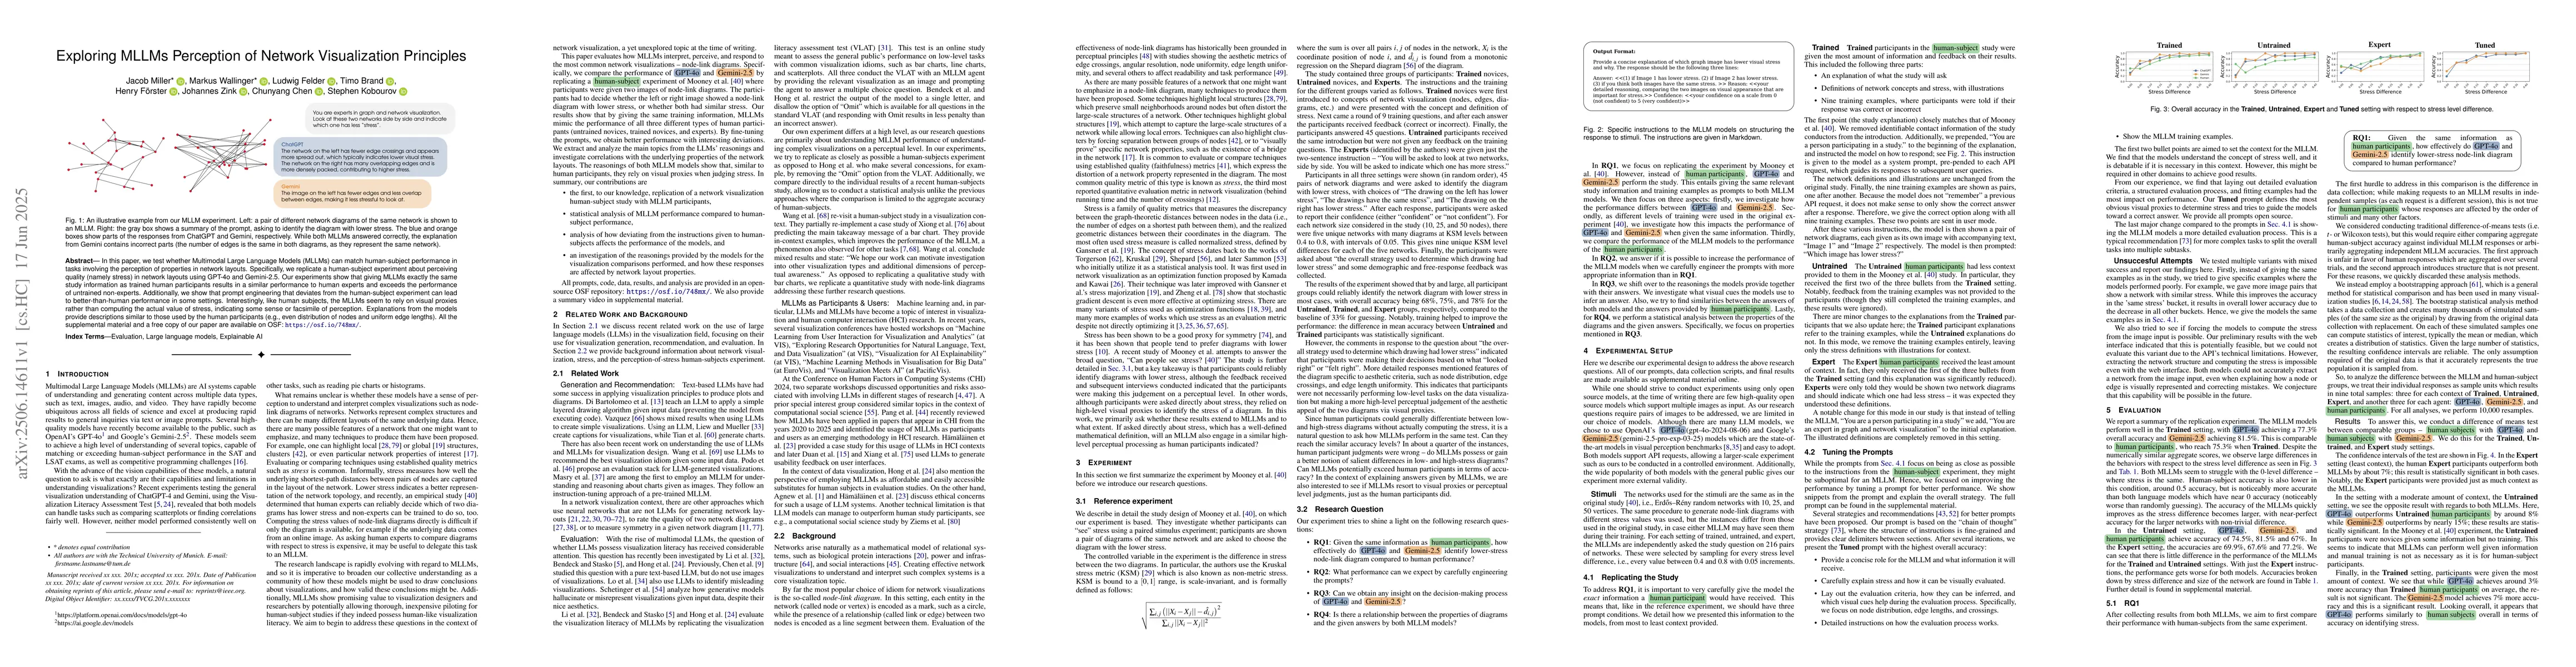
In this paper, we test whether Multimodal Large Language Models (MLLMs) can match human-subject performance in tasks involving the perception of properties in network layouts. Specifically, we replica...
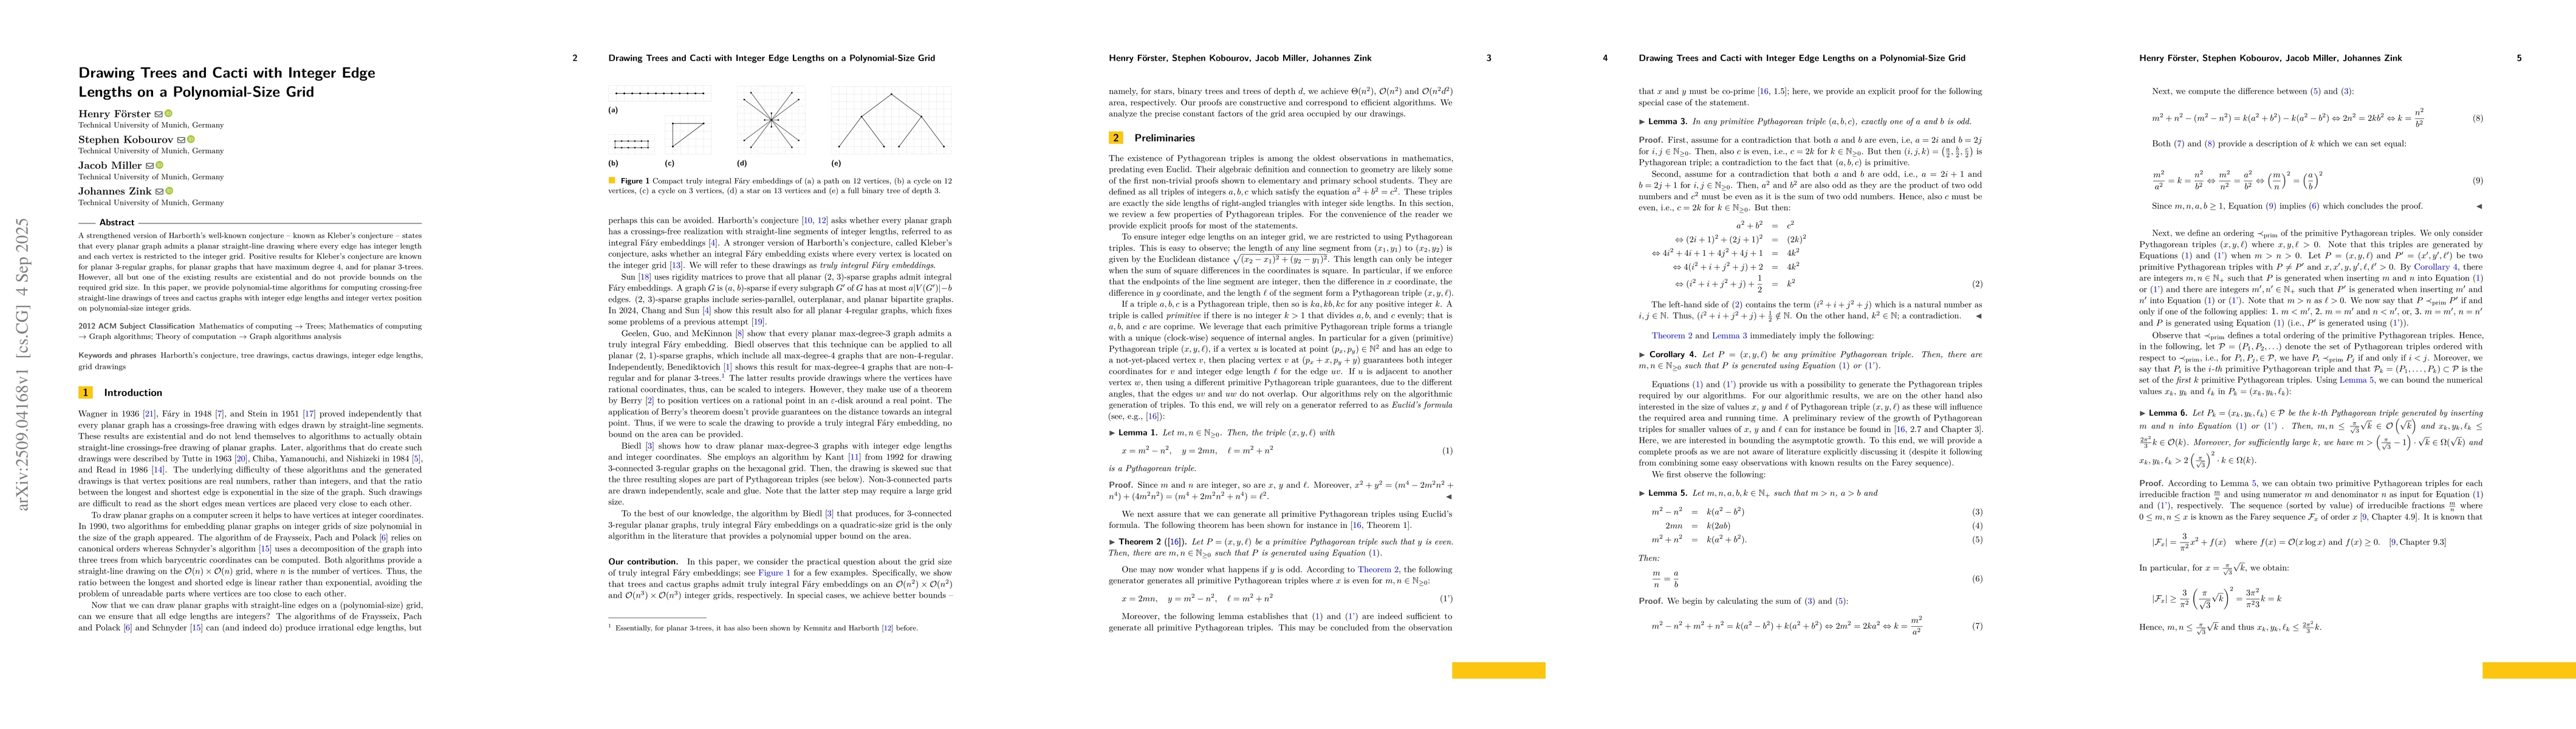
A strengthened version of Harborth's well-known conjecture -- known as Kleber's conjecture -- states that every planar graph admits a planar straight-line drawing where every edge has integer length a...
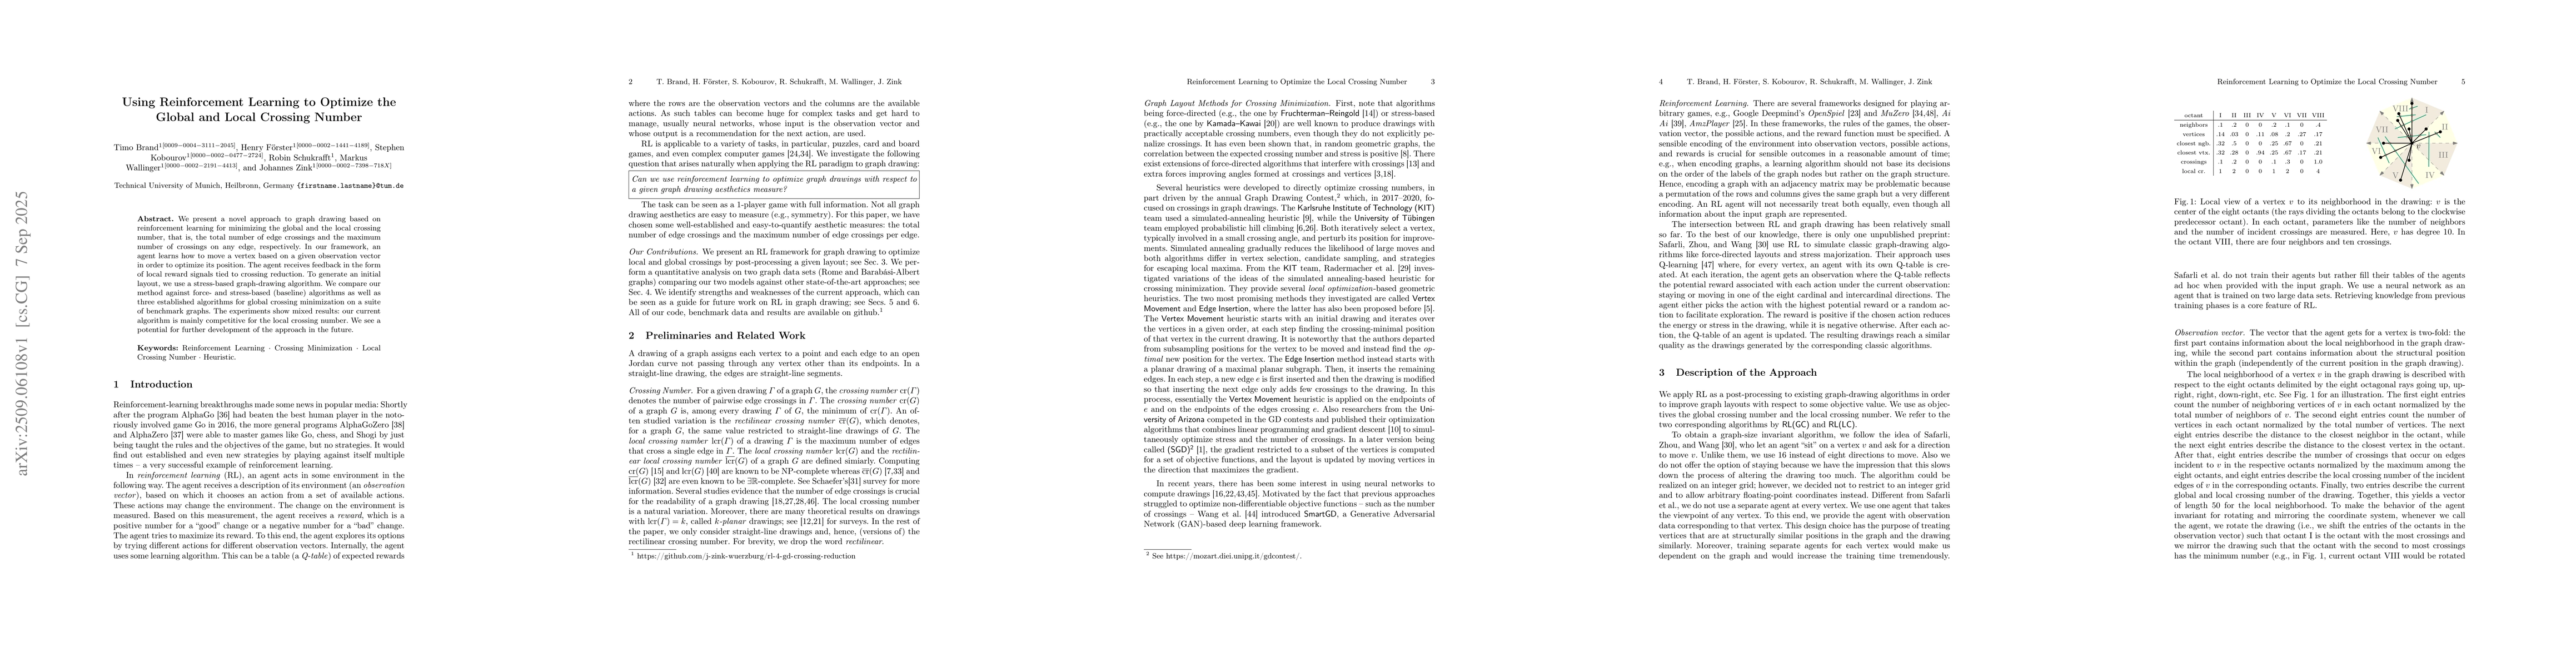
We present a novel approach to graph drawing based on reinforcement learning for minimizing the global and the local crossing number, that is, the total number of edge crossings and the maximum number...
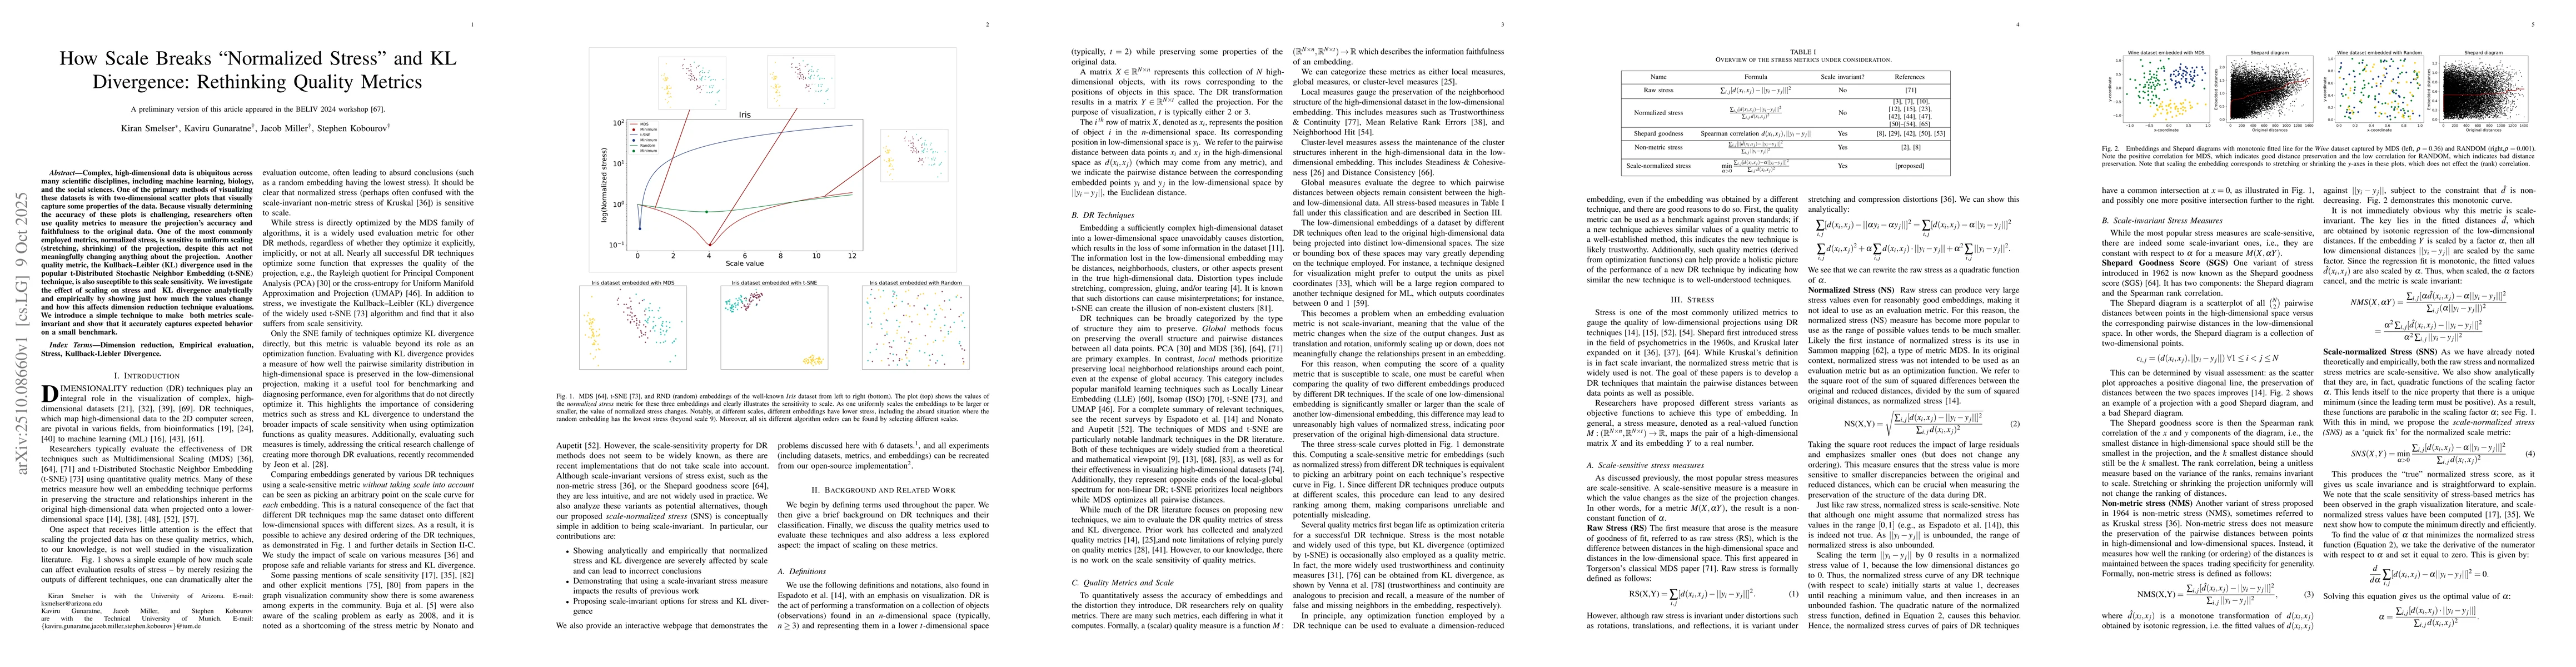
Complex, high-dimensional data is ubiquitous across many scientific disciplines, including machine learning, biology, and the social sciences. One of the primary methods of visualizing these datasets ...
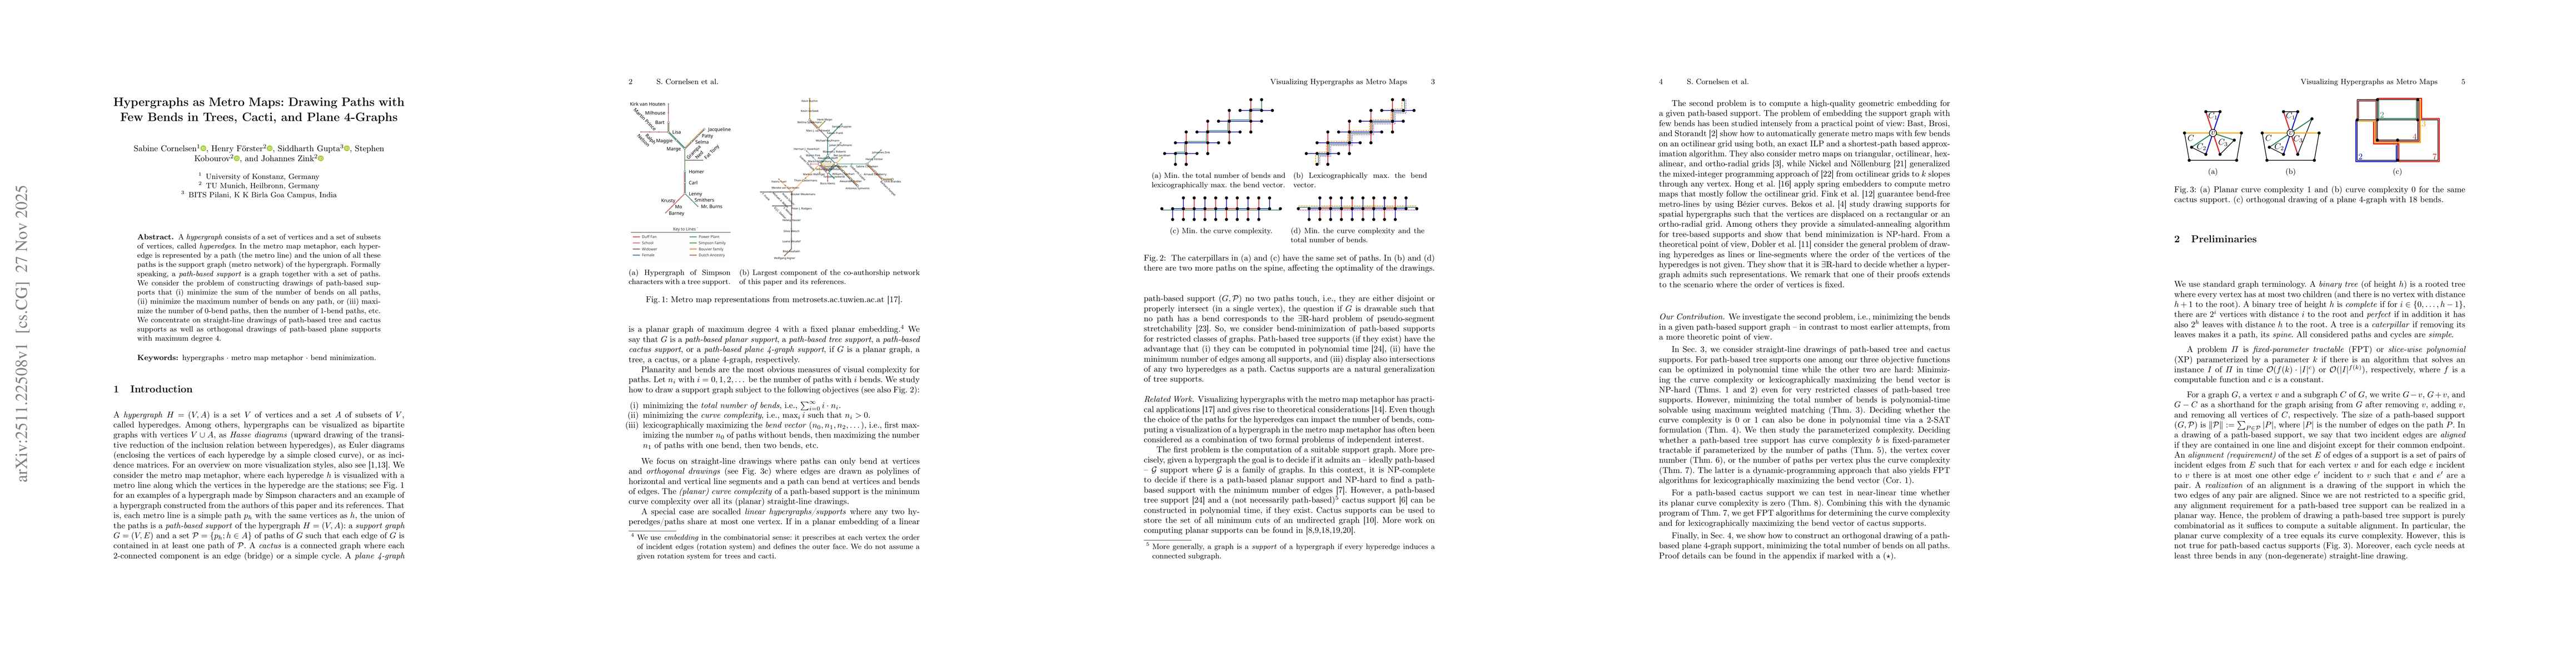
A hypergraph consists of a set of vertices and a set of subsets of vertices, called hyperedges. In the metro map metaphor, each hyperedge is represented by a path (the metro line) and the union of all...
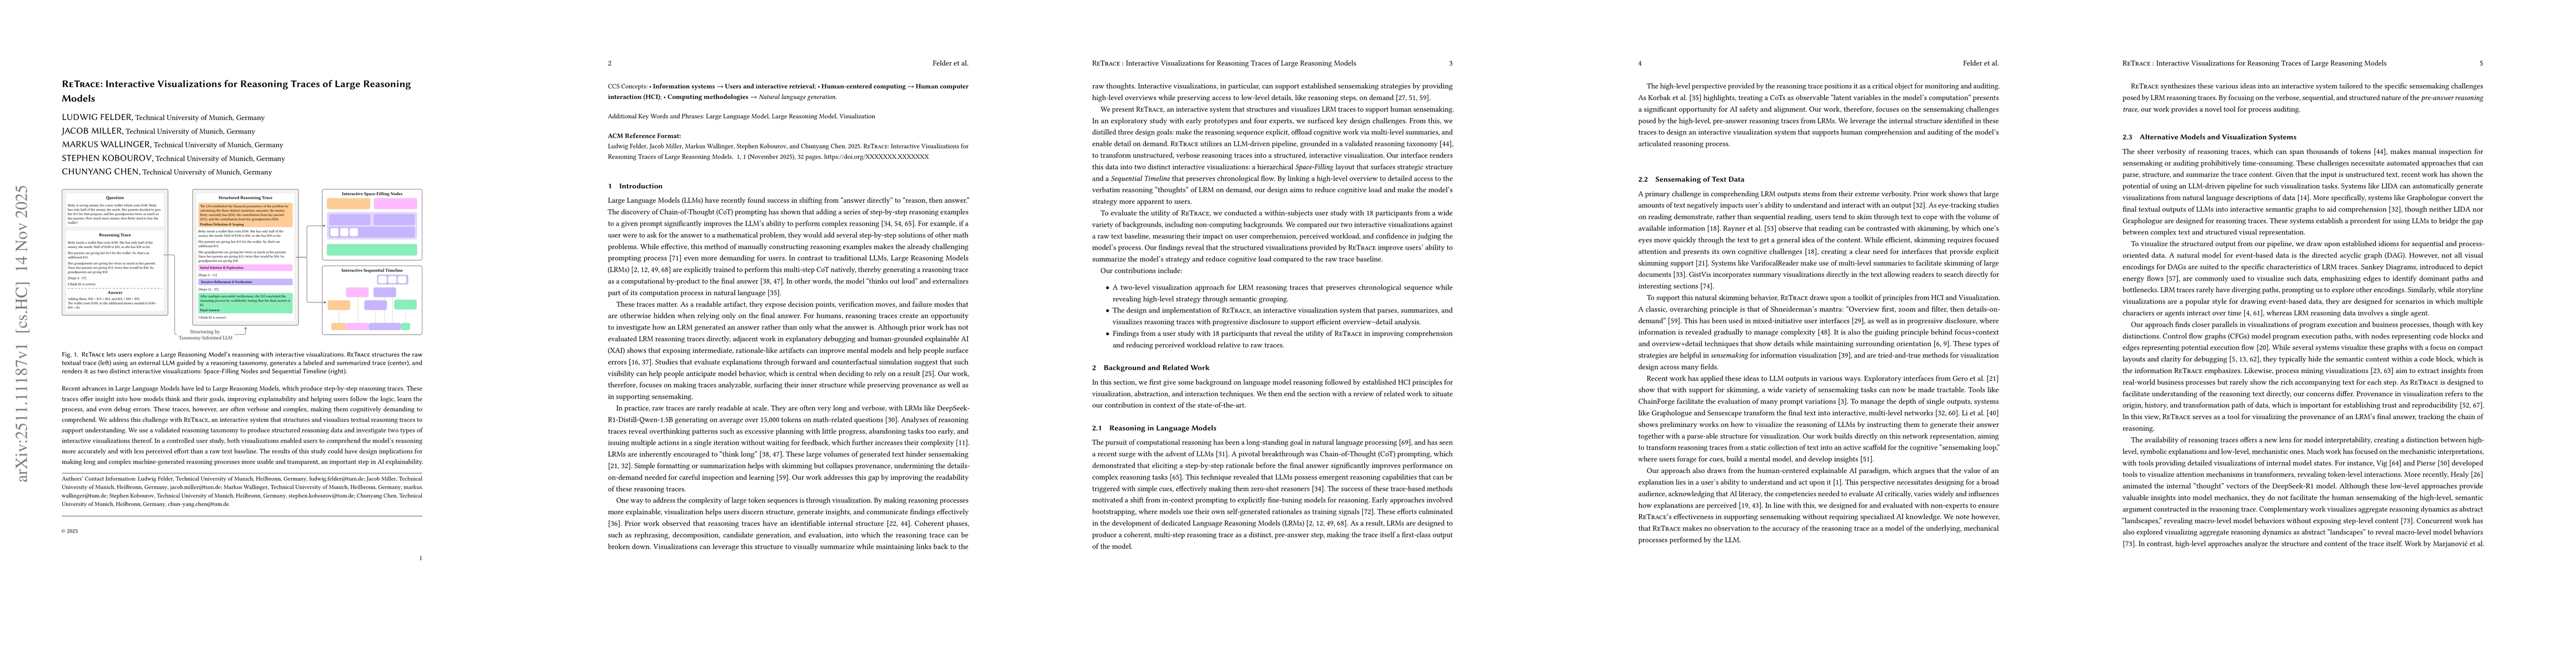
Recent advances in Large Language Models have led to Large Reasoning Models, which produce step-by-step reasoning traces. These traces offer insight into how models think and their goals, improving ex...
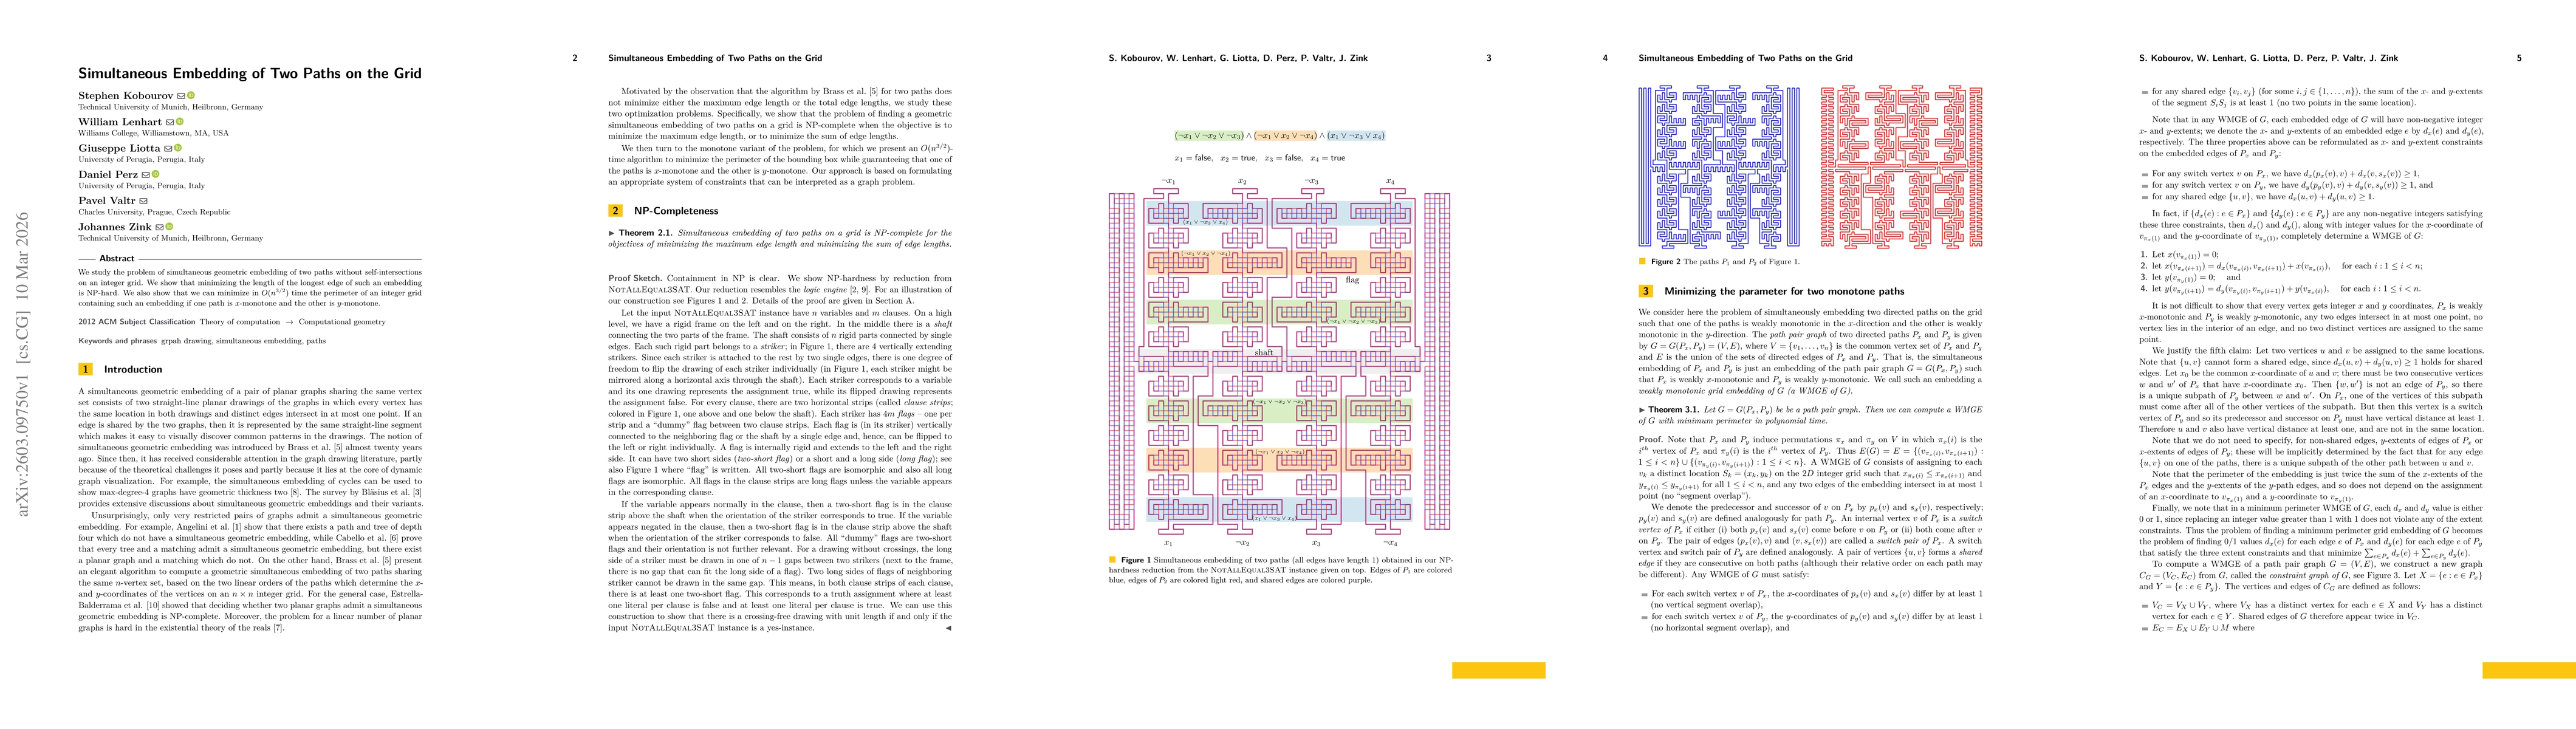
We study the problem of simultaneous geometric embedding of two paths without self-intersections on an integer grid. We show that minimizing the length of the longest edge of such an embedding is NP-h...
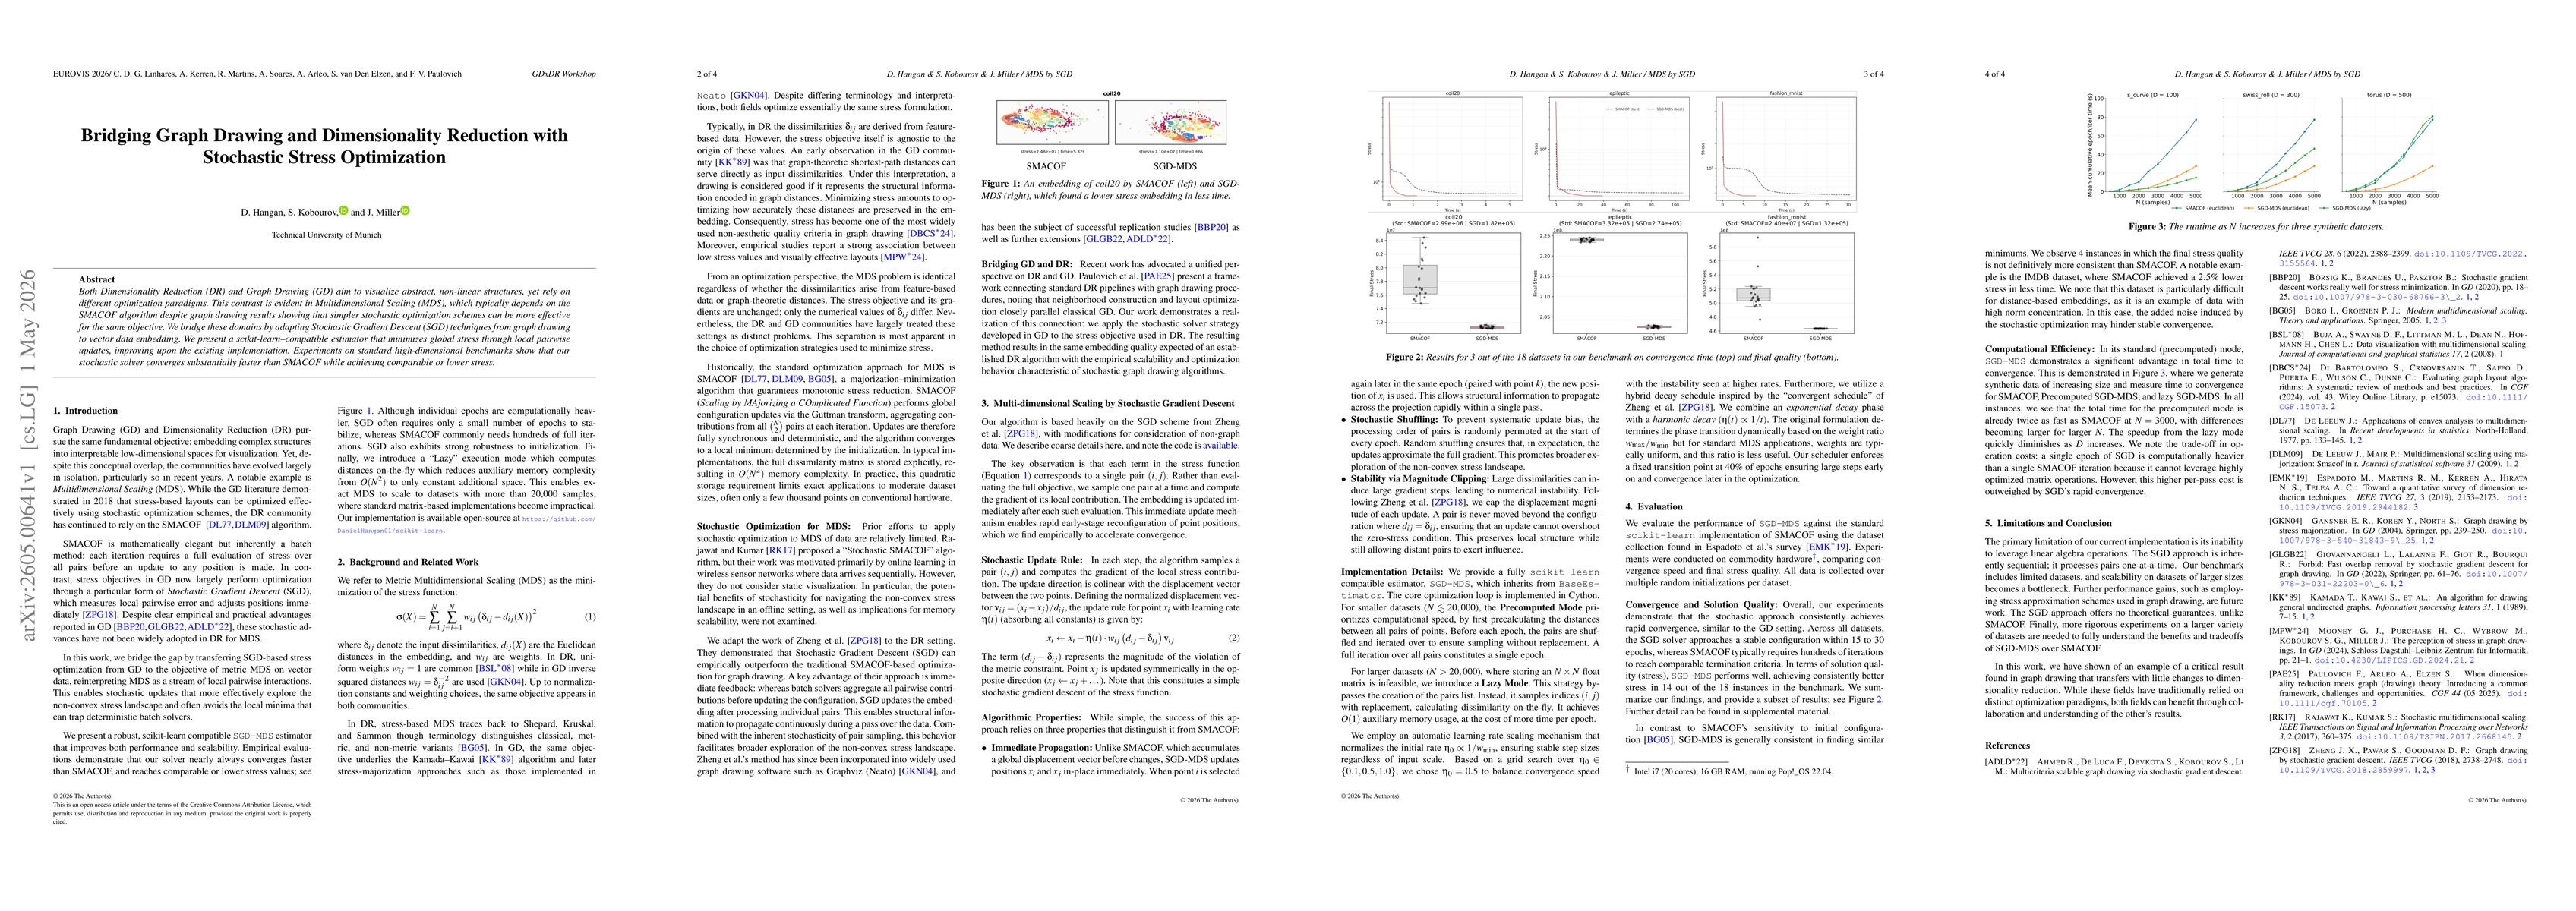
Both Dimensionality Reduction (DR) and Graph Drawing (GD) aim to visualize abstract, non-linear structures, yet rely on different optimization paradigms. This contrast is evident in Multidimensional S...
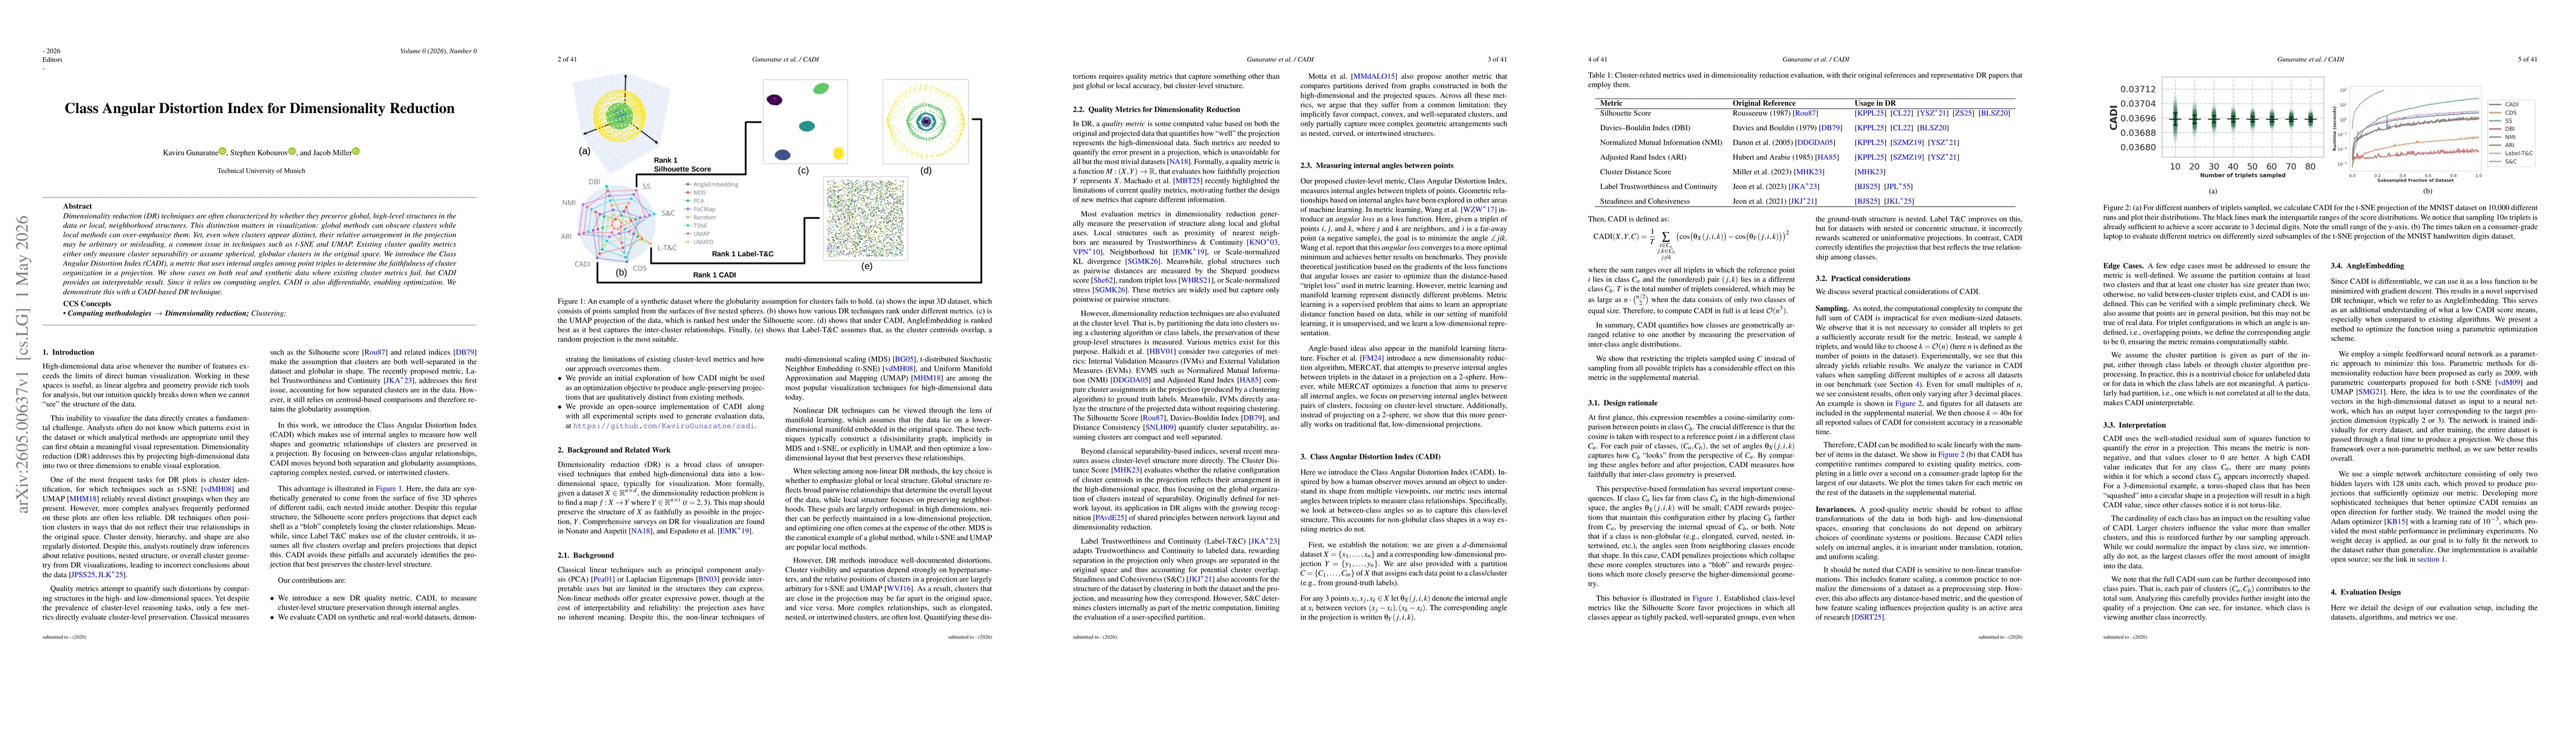
Dimensionality reduction (DR) techniques are often characterized by whether they preserve global, high-level structures in the data or local, neighborhood structures. This distinction matters in visua...
Traditional network representations, such as node-link views and adjacency matrices, can show dramatically different visual patterns, depending on the underlying layout or seriation algorithm. In cont...
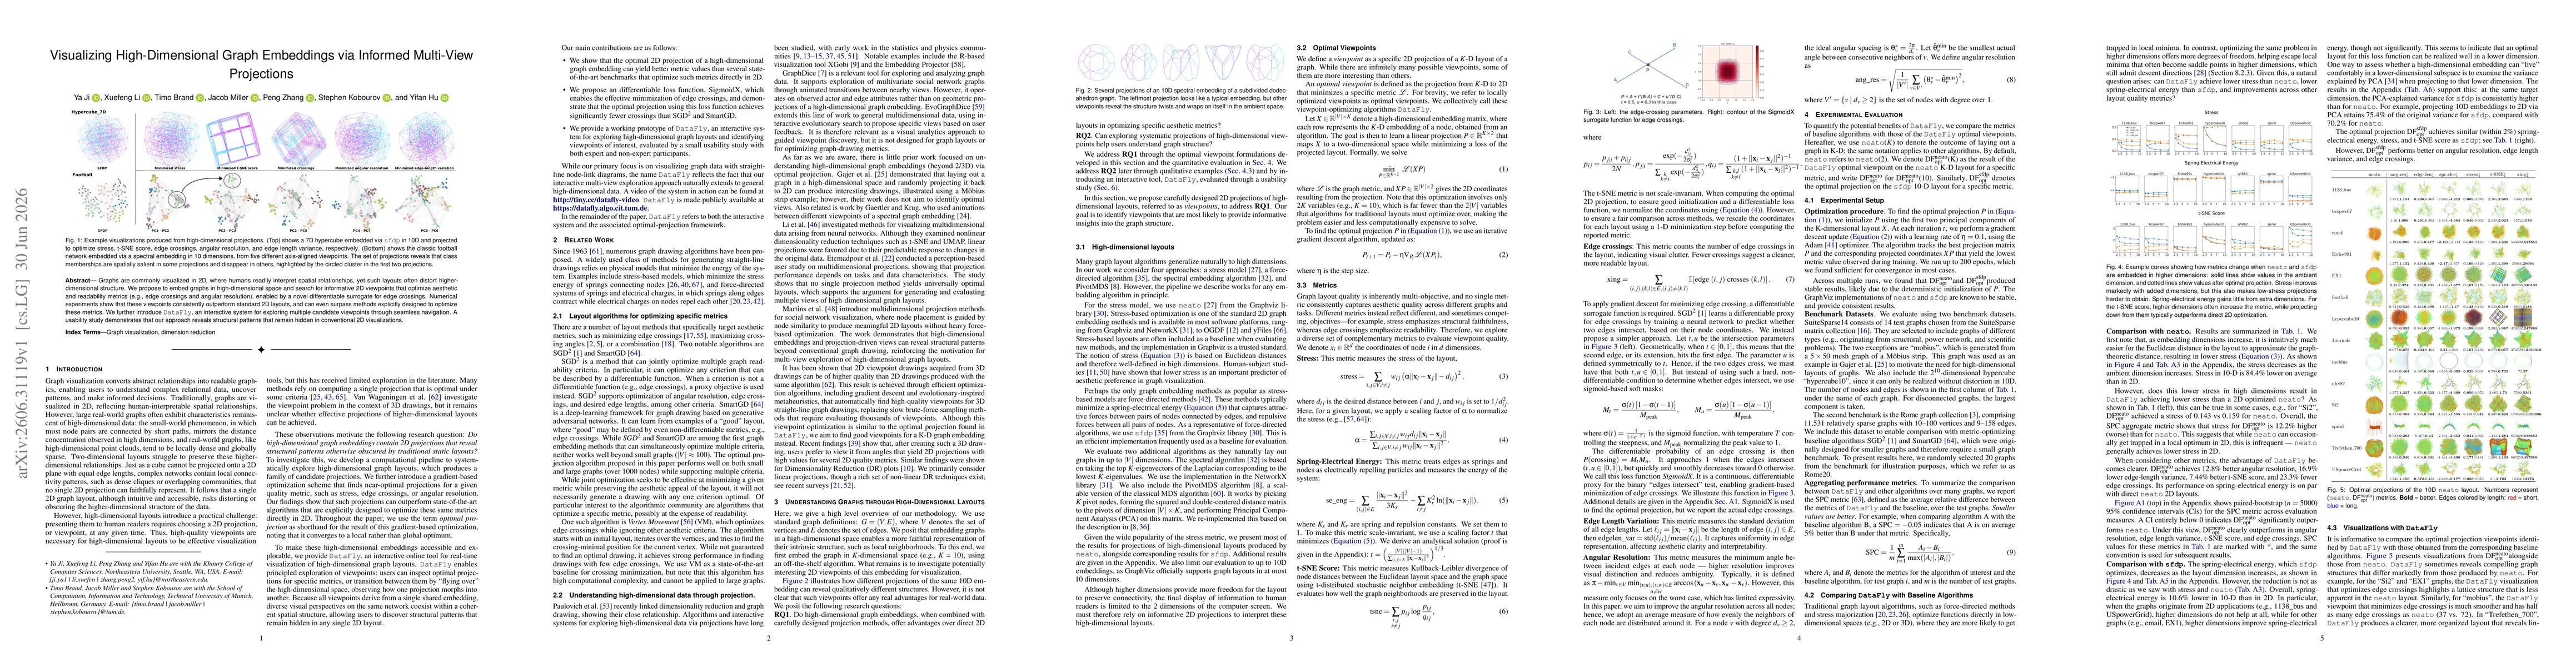
Graphs are commonly visualized in 2D, where humans readily interpret spatial relationships, yet such layouts often distort higher-dimensional structure. We propose to embed graphs in high-dimensional ...
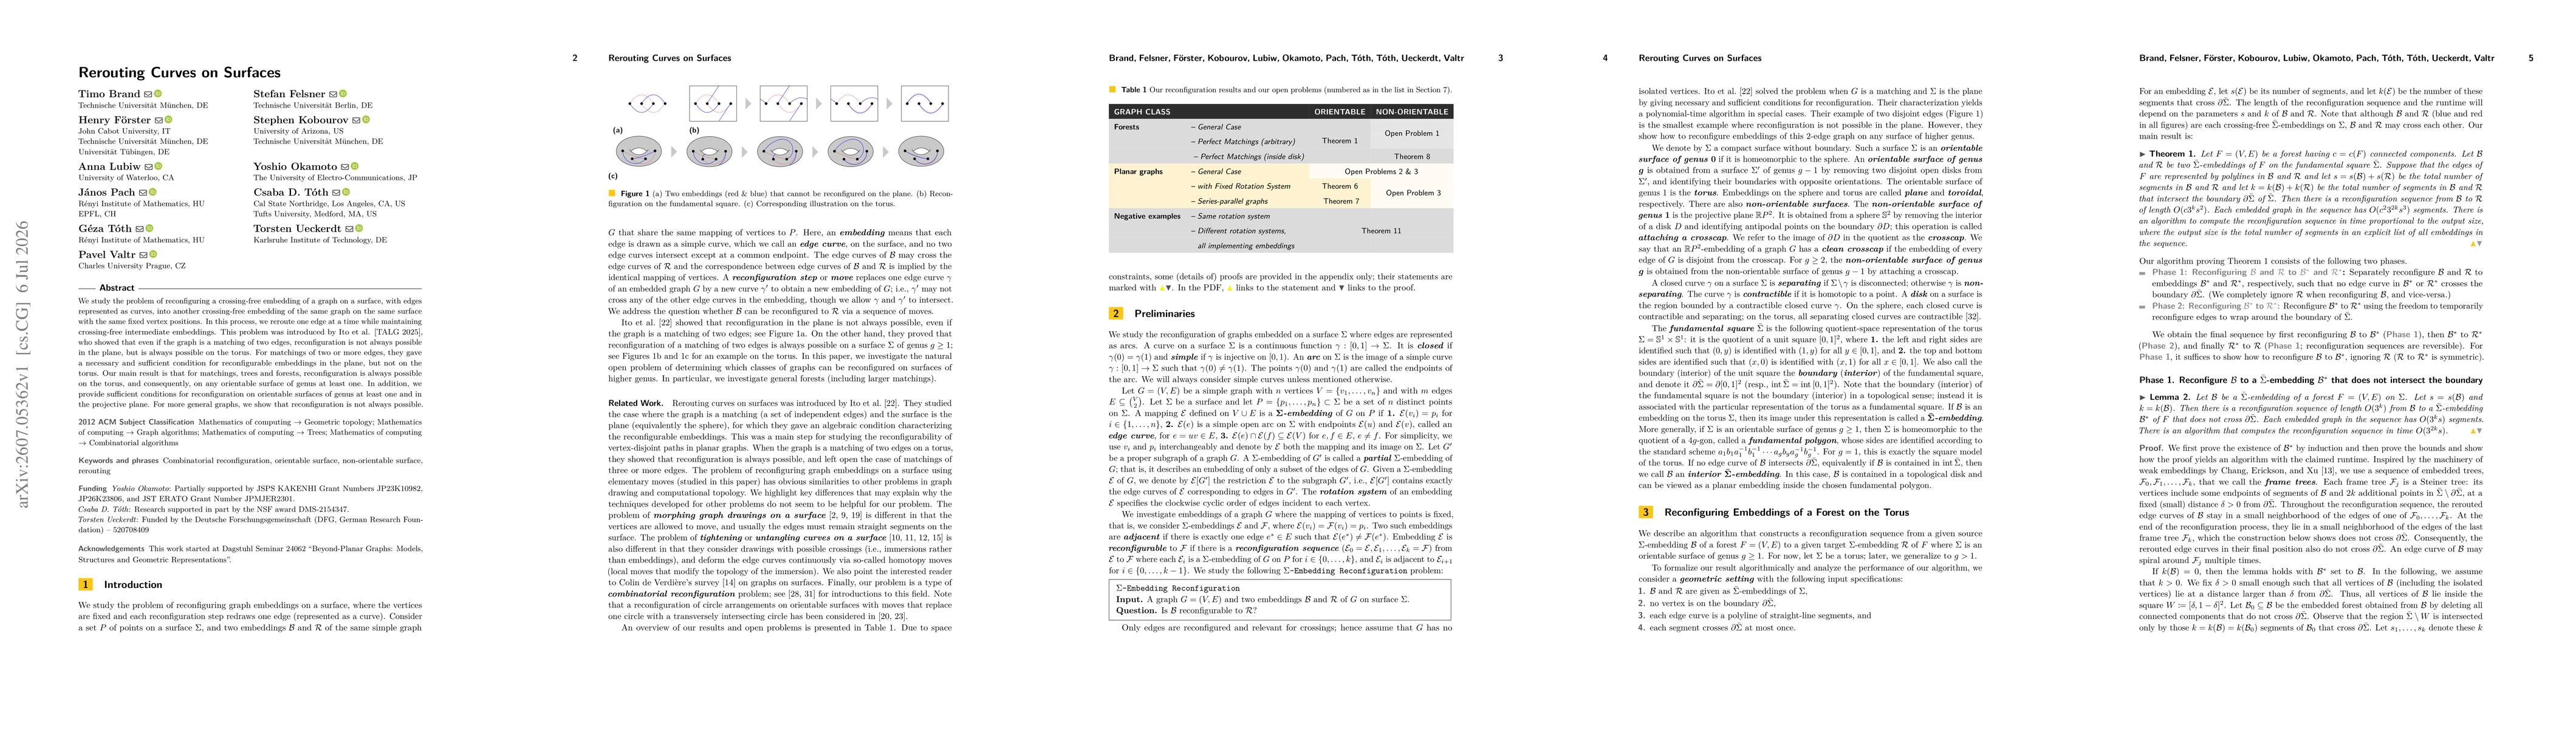
We study the problem of reconfiguring a crossing-free embedding of a graph on a surface, with edges represented as curves, into another crossing-free embedding of the same graph on the same surface wi...
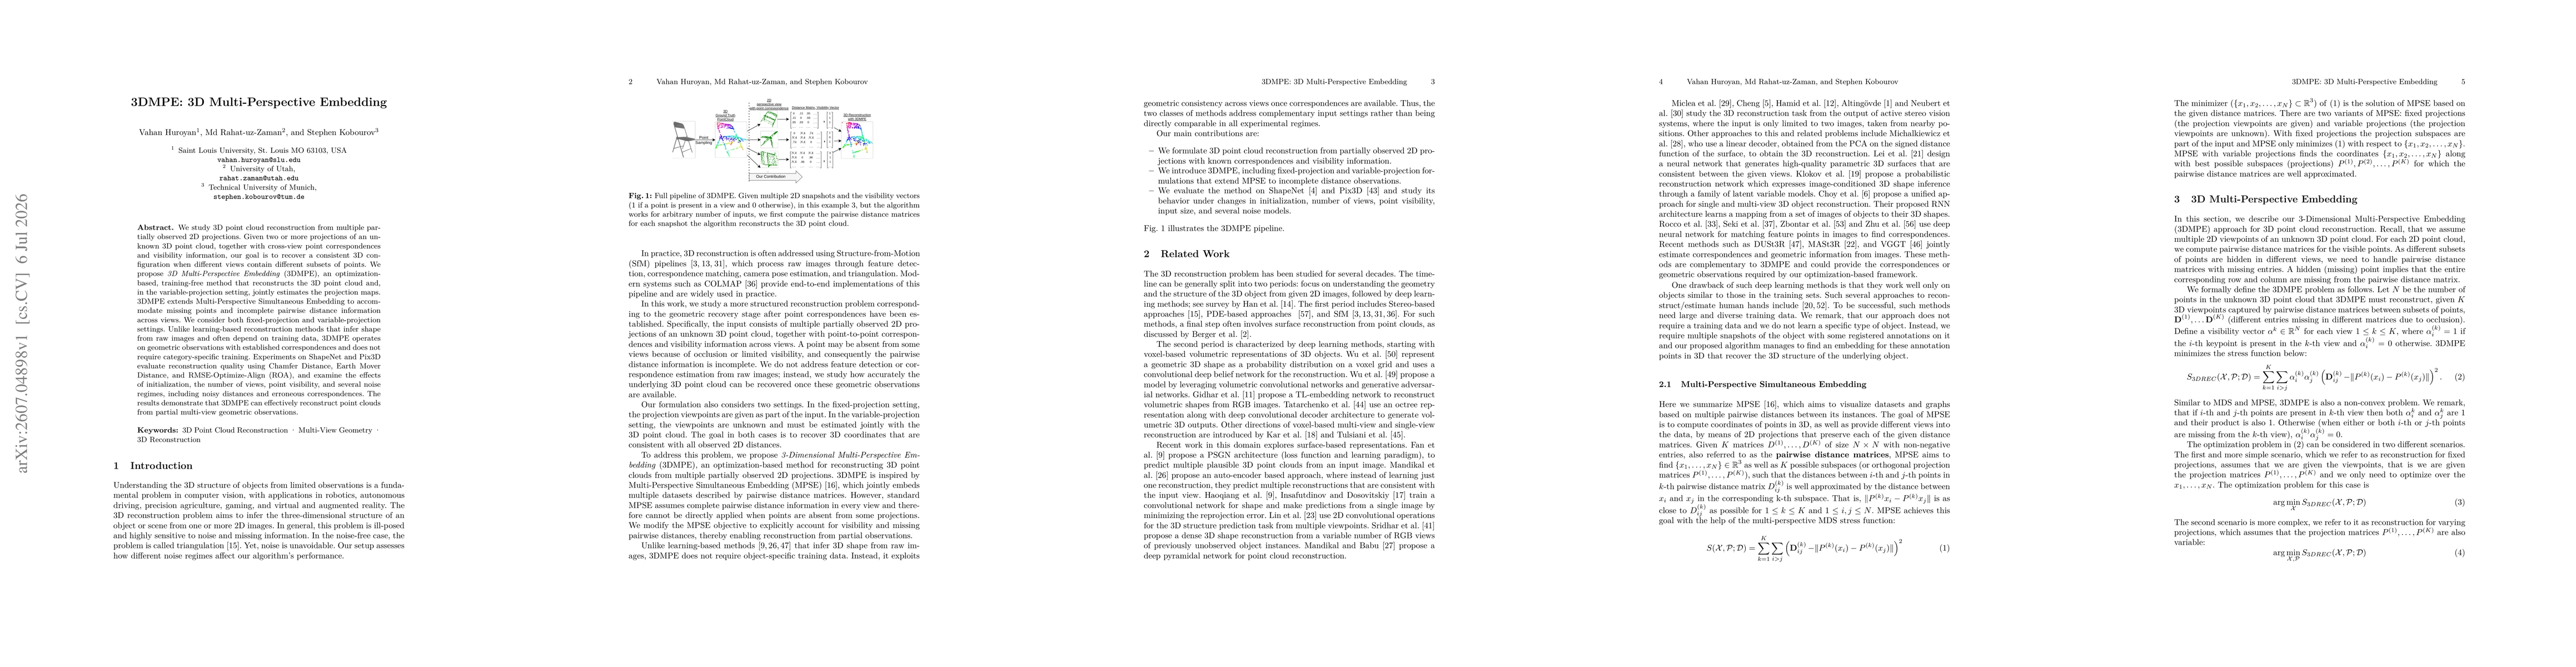
We study 3D point cloud reconstruction from multiple partially observed 2D projections. Given two or more projections of an unknown 3D point cloud, together with cross-view point correspondences and v...