Academic Profile
Statistics
Similar Authors
Papers on arXiv
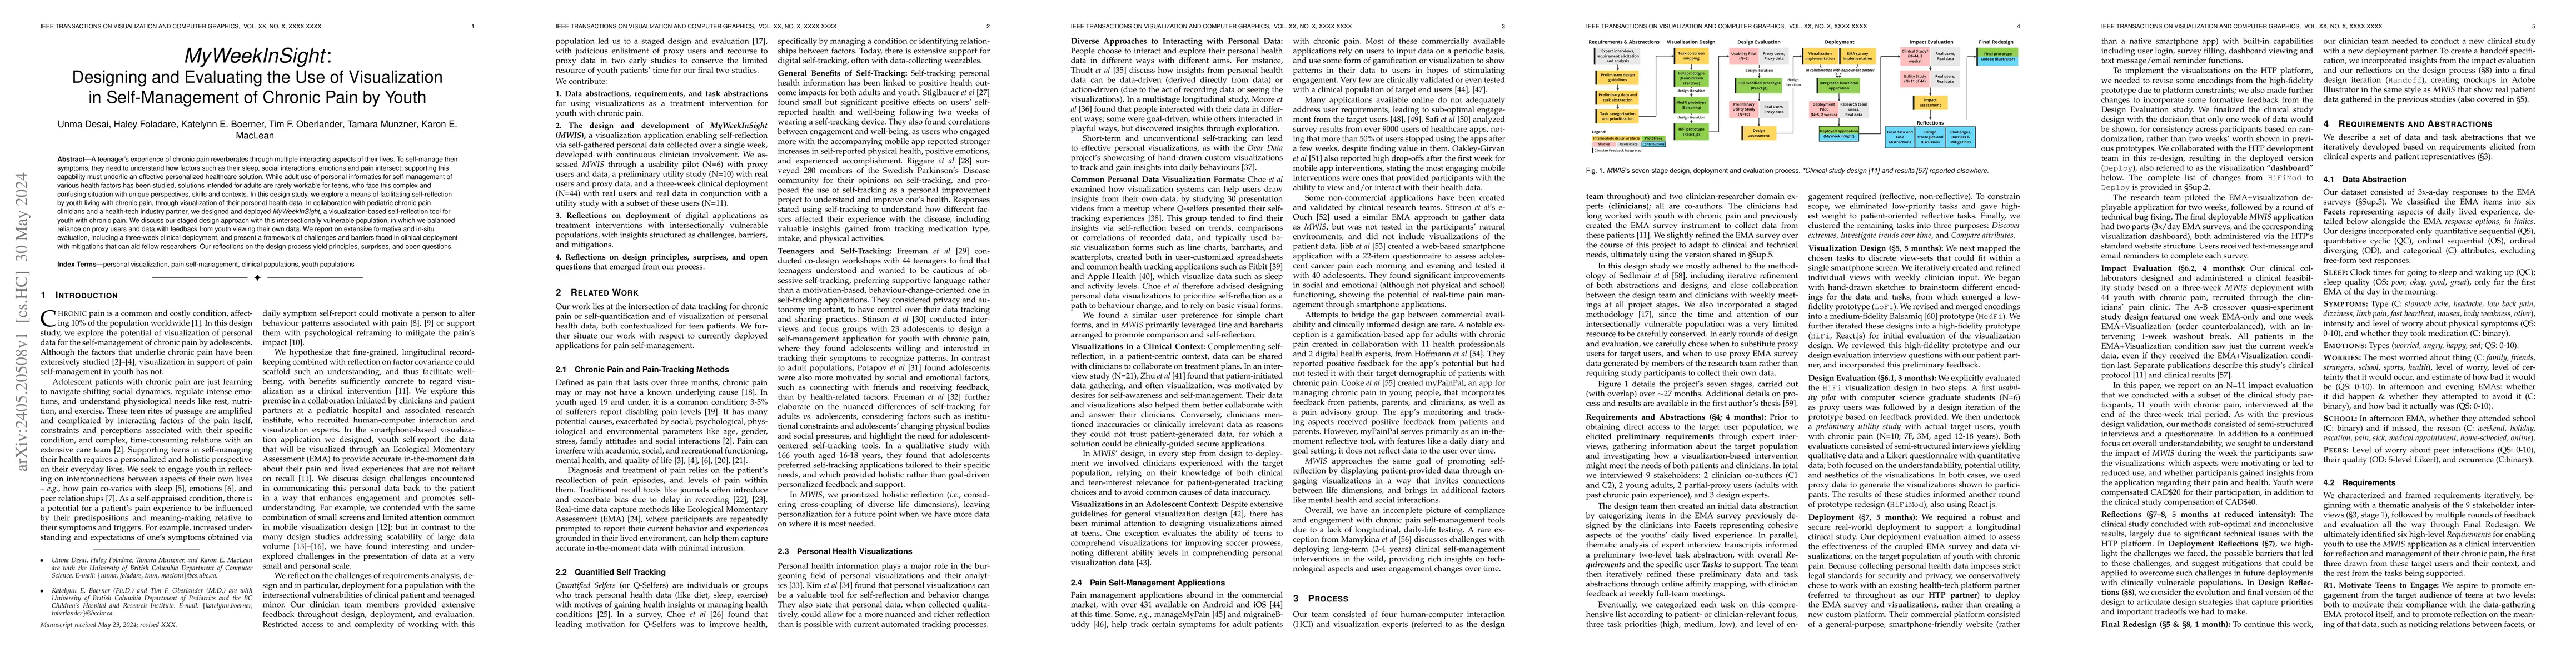
A teenager's experience of chronic pain reverberates through multiple interacting aspects of their lives. To self-manage their symptoms, they need to understand how factors such as their sleep, soci...
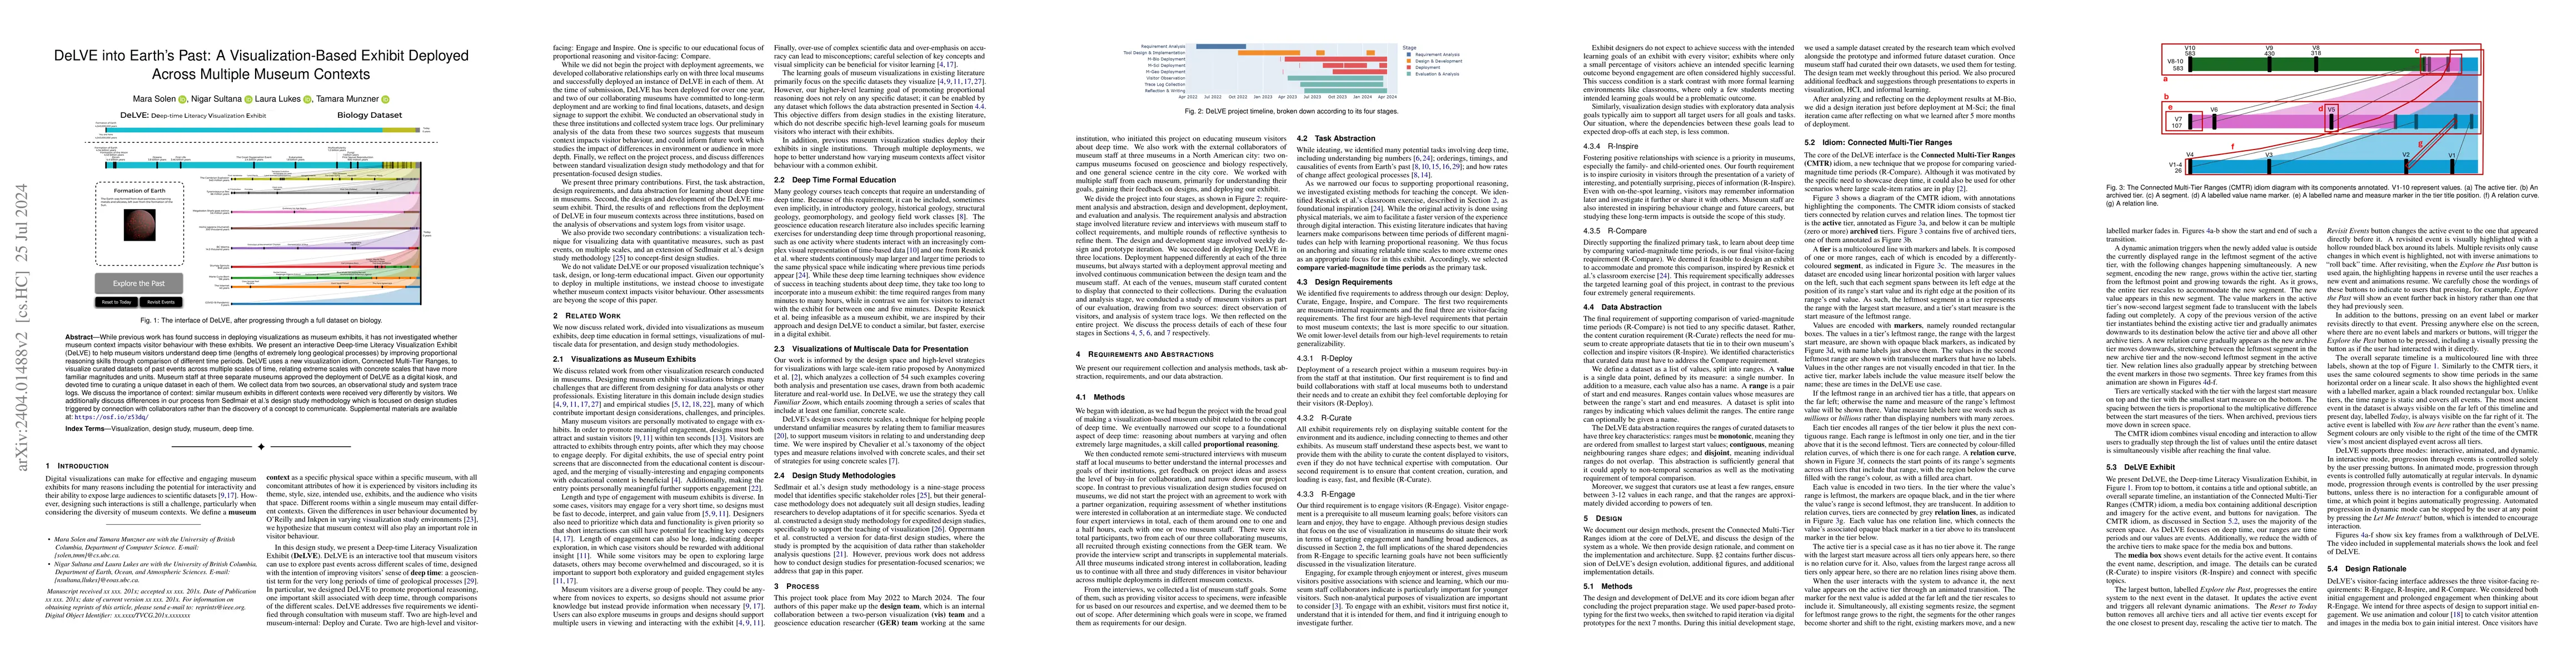
While previous work has found success in deploying visualizations as museum exhibits, differences in visitor behaviour across varying museum contexts are understudied. We present an interactive Deep...
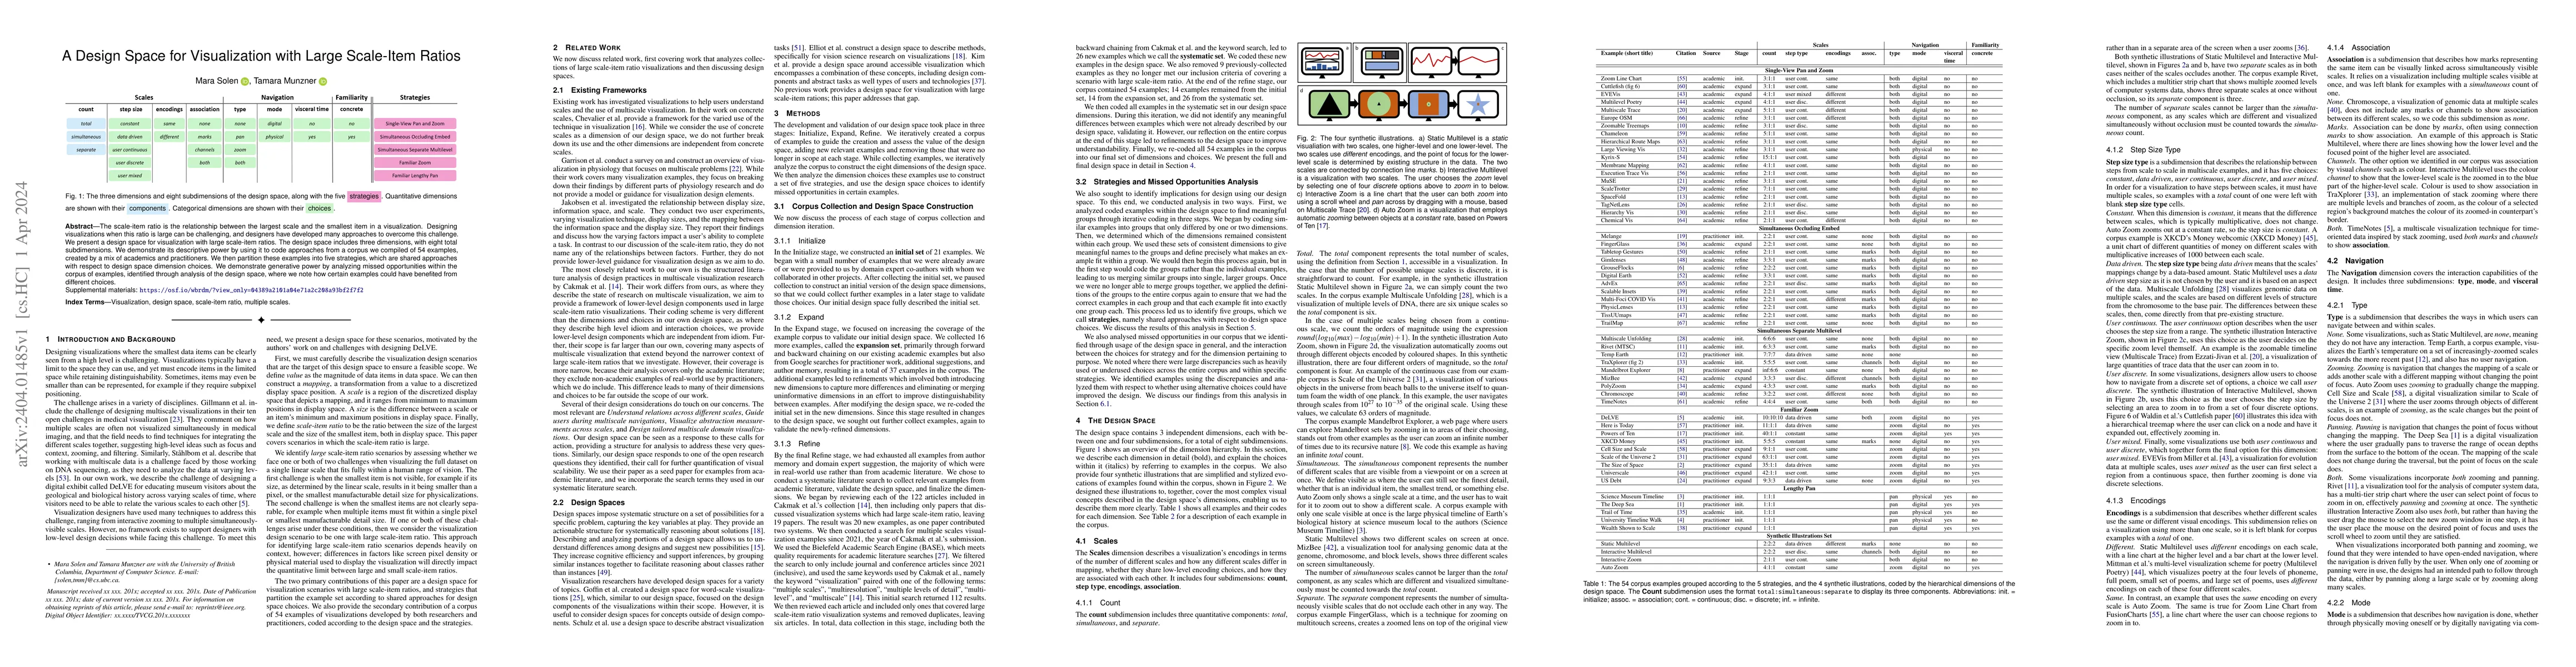
The scale-item ratio is the relationship between the largest scale and the smallest item in a visualization. Designing visualizations when this ratio is large can be challenging, and designers have ...
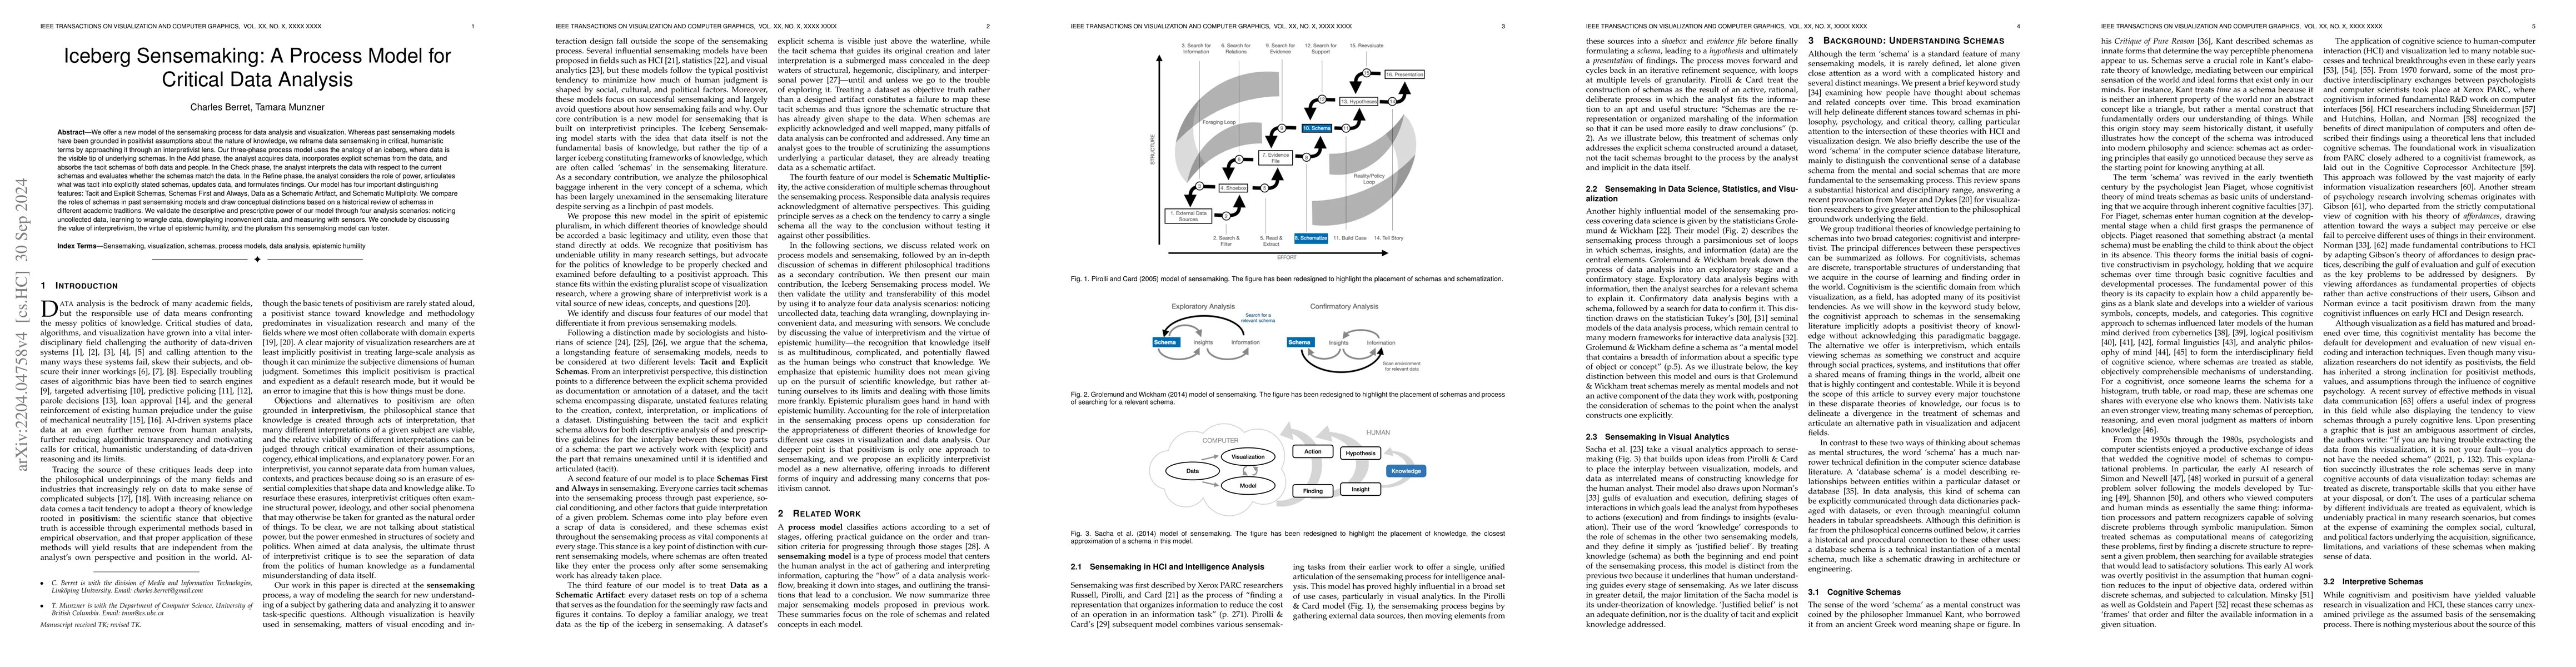
We offer a new model of the sensemaking process for data analysis and visualization. Whereas past sensemaking models have been grounded in positivist assumptions about the nature of knowledge, we re...
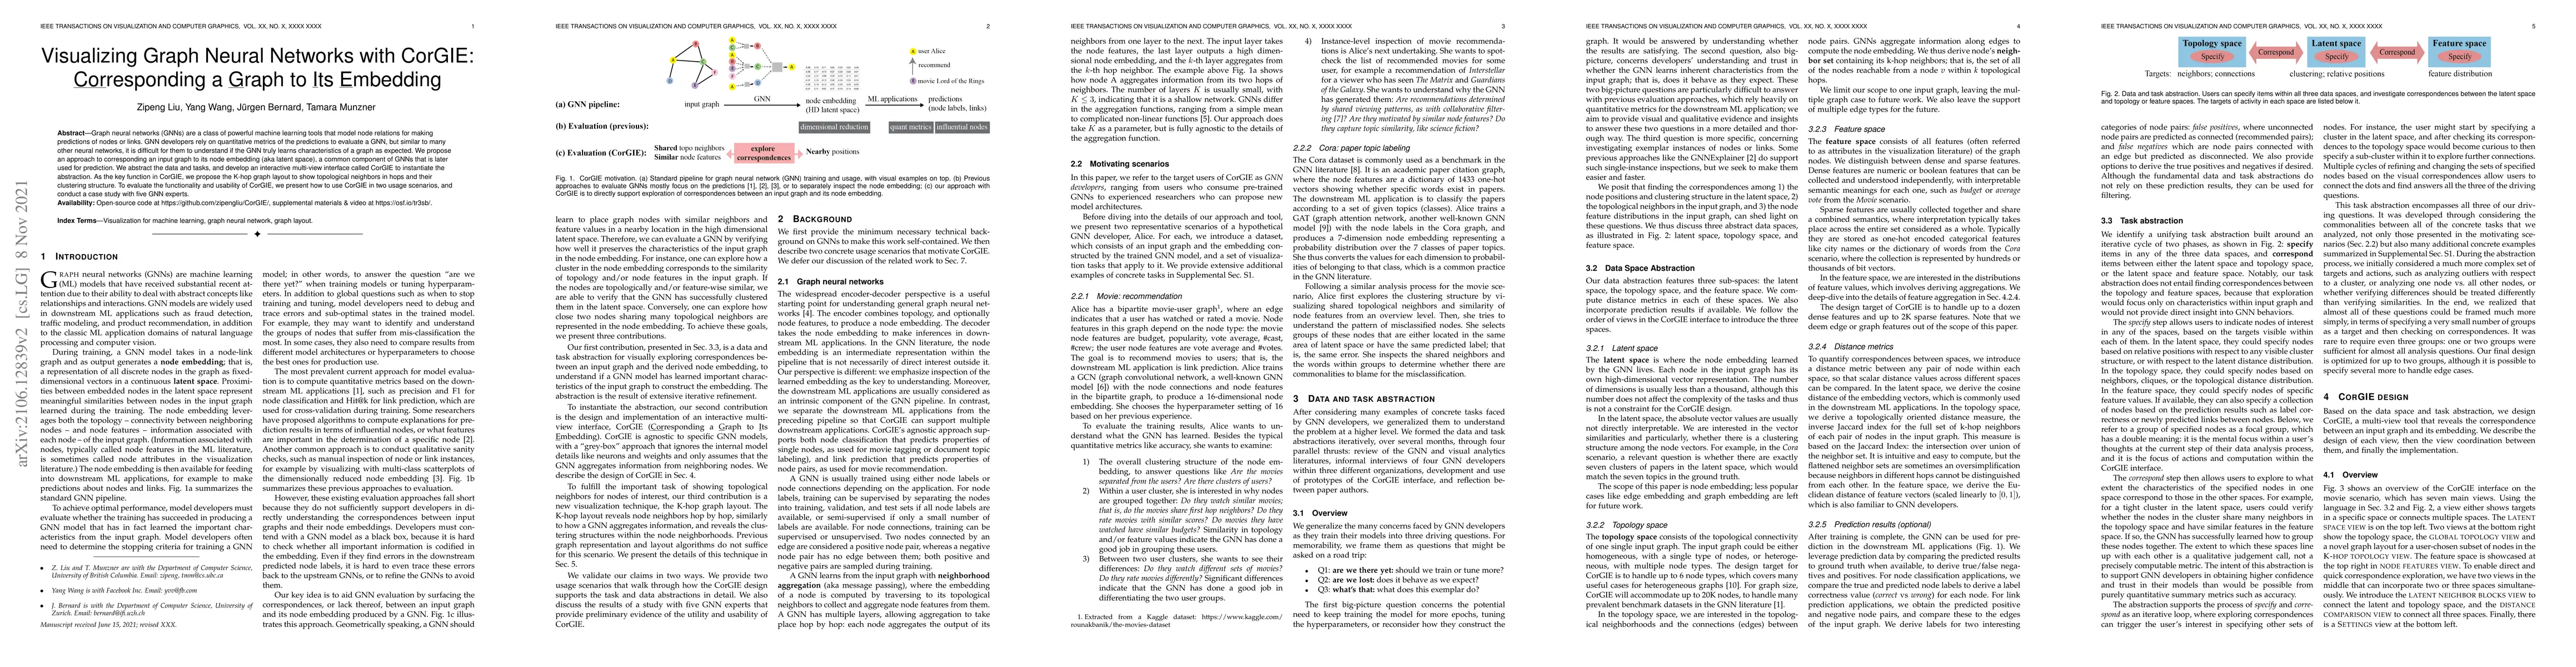
Graph neural networks (GNNs) are a class of powerful machine learning tools that model node relations for making predictions of nodes or links. GNN developers rely on quantitative metrics of the pre...
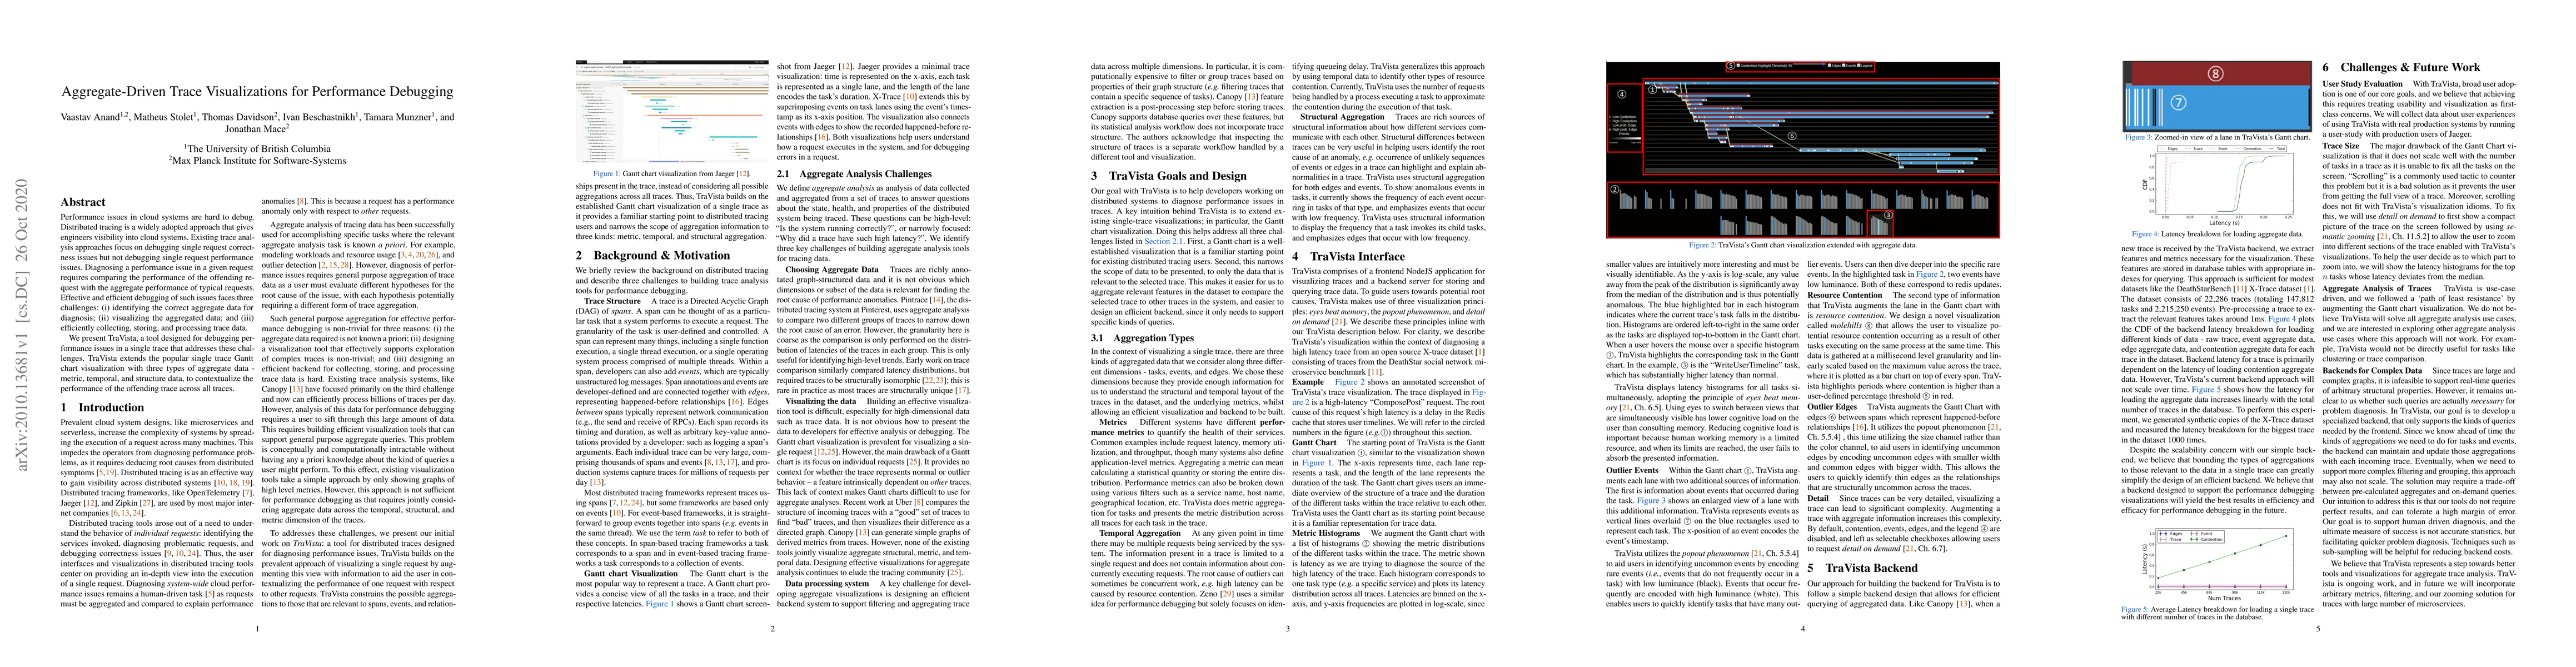
Performance issues in cloud systems are hard to debug. Distributed tracing is a widely adopted approach that gives engineers visibility into cloud systems. Existing trace analysis approaches focus o...
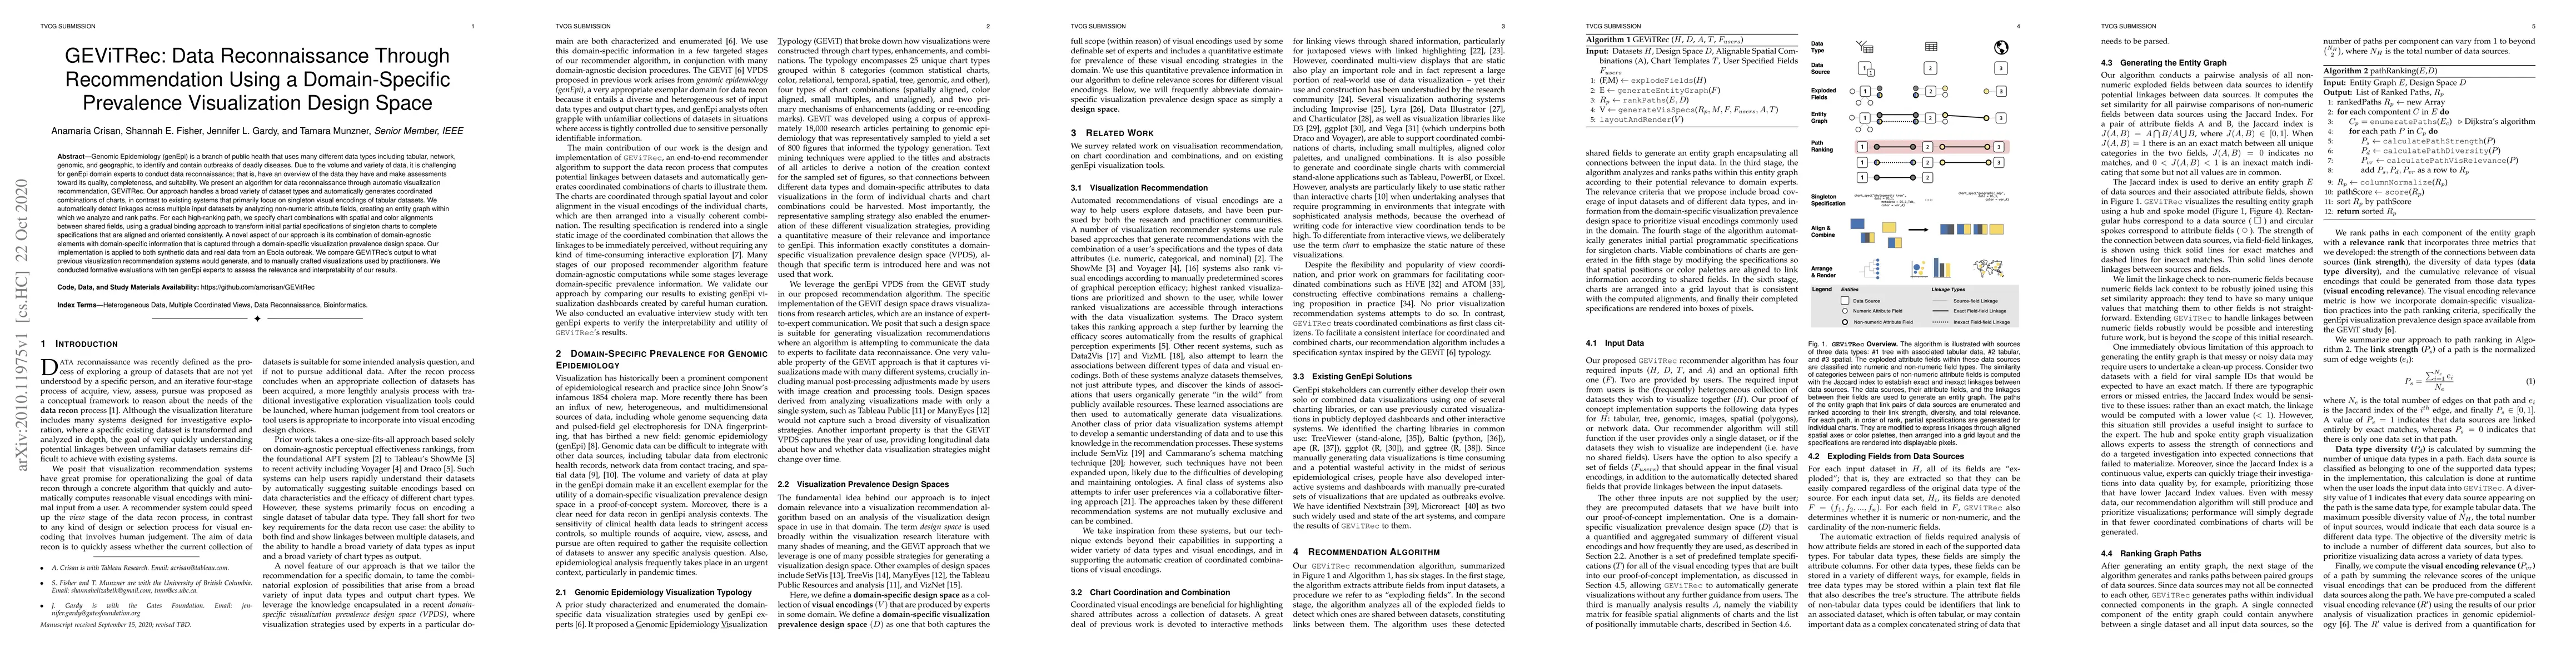
Genomic Epidemiology (genEpi) is a branch of public health that uses many different data types including tabular, network, genomic, and geographic, to identify and contain outbreaks of deadly diseas...
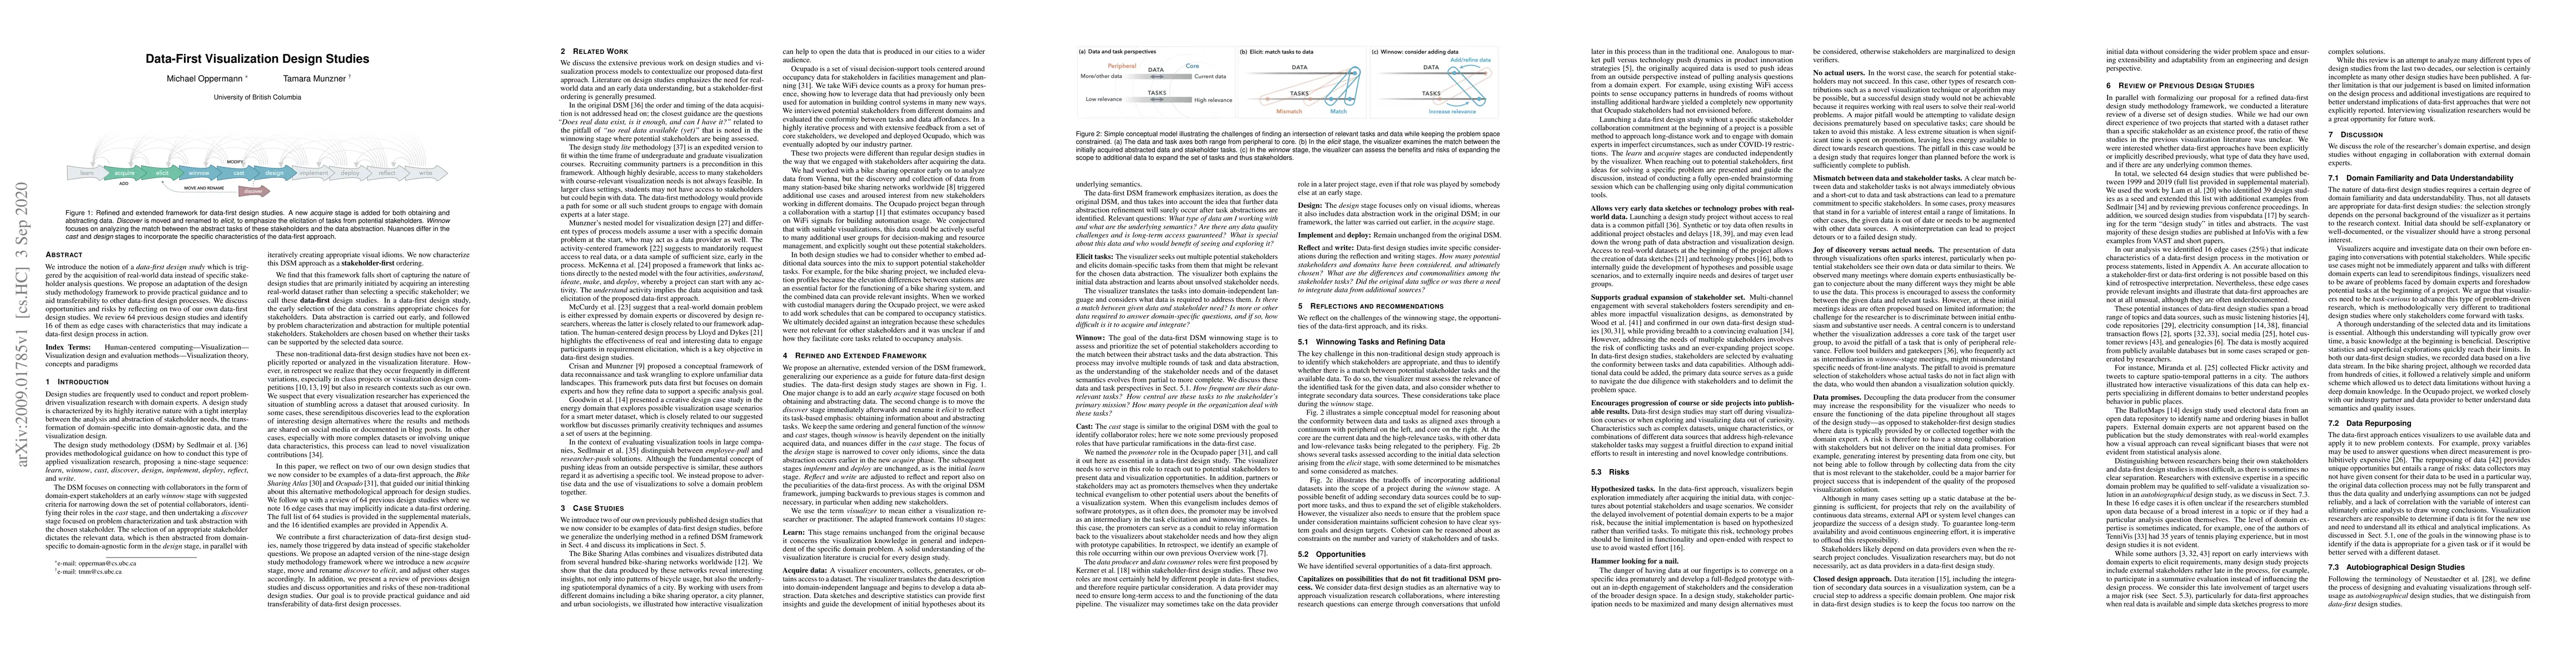
We introduce the notion of a data-first design study which is triggered by the acquisition of real-world data instead of specific stakeholder analysis questions. We propose an adaptation of the desi...
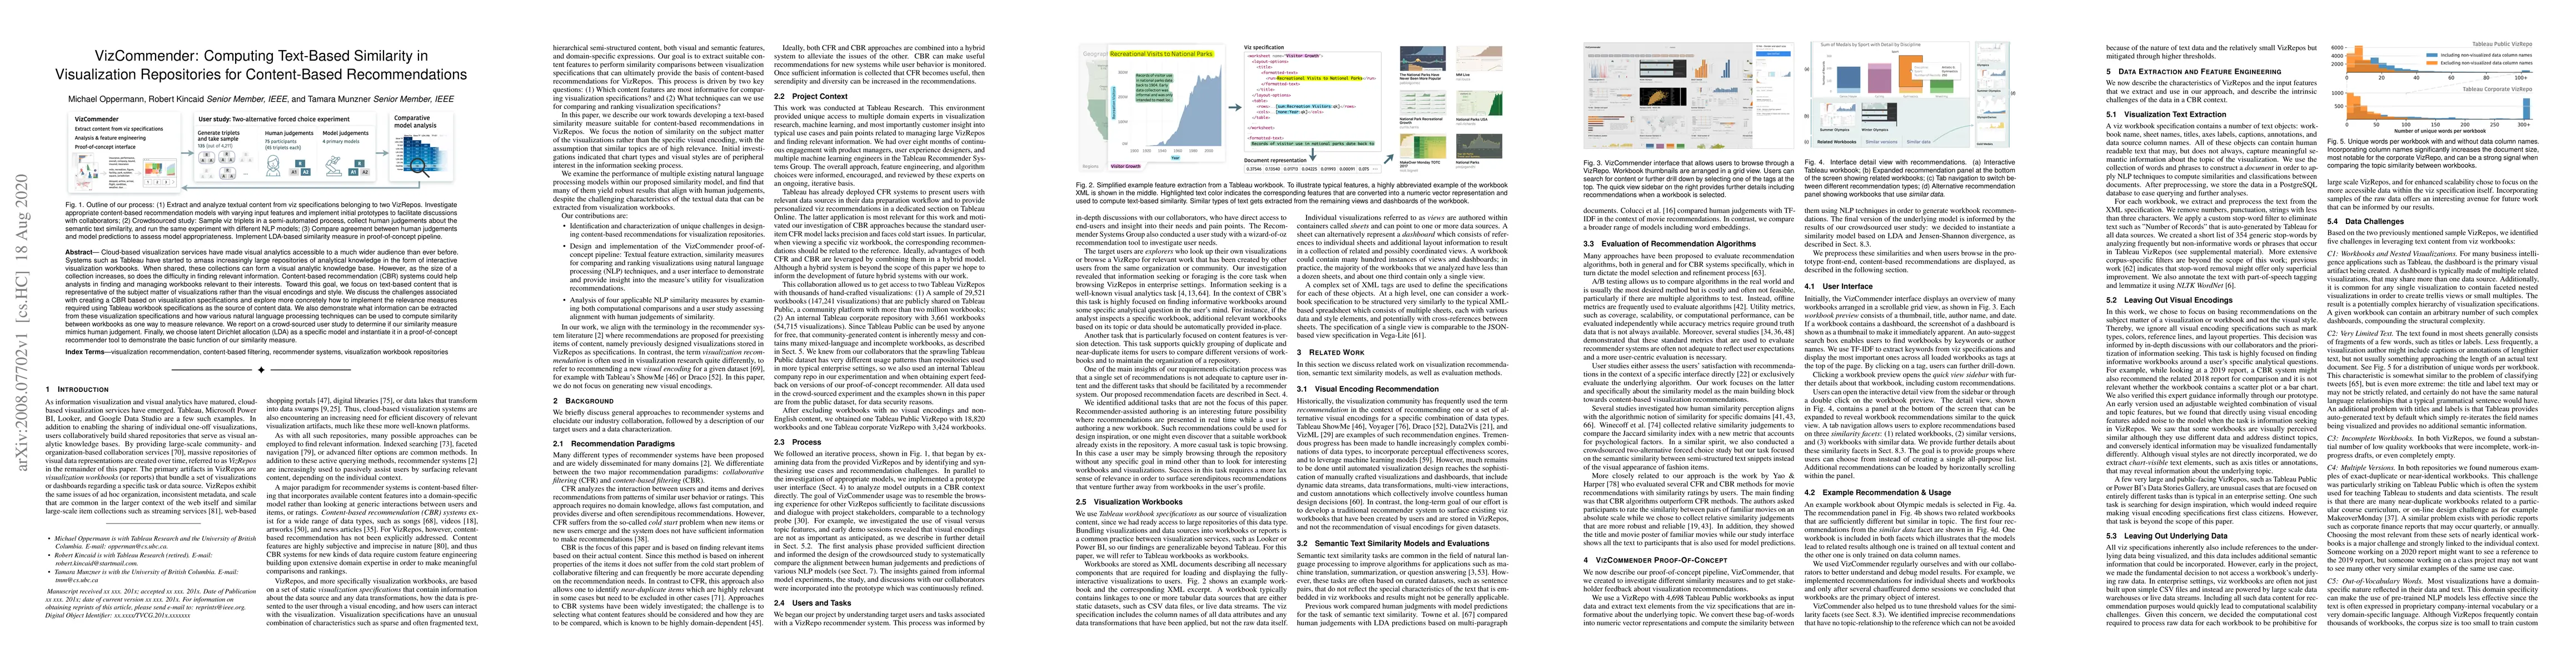
Cloud-based visualization services have made visual analytics accessible to a much wider audience than ever before. Systems such as Tableau have started to amass increasingly large repositories of a...
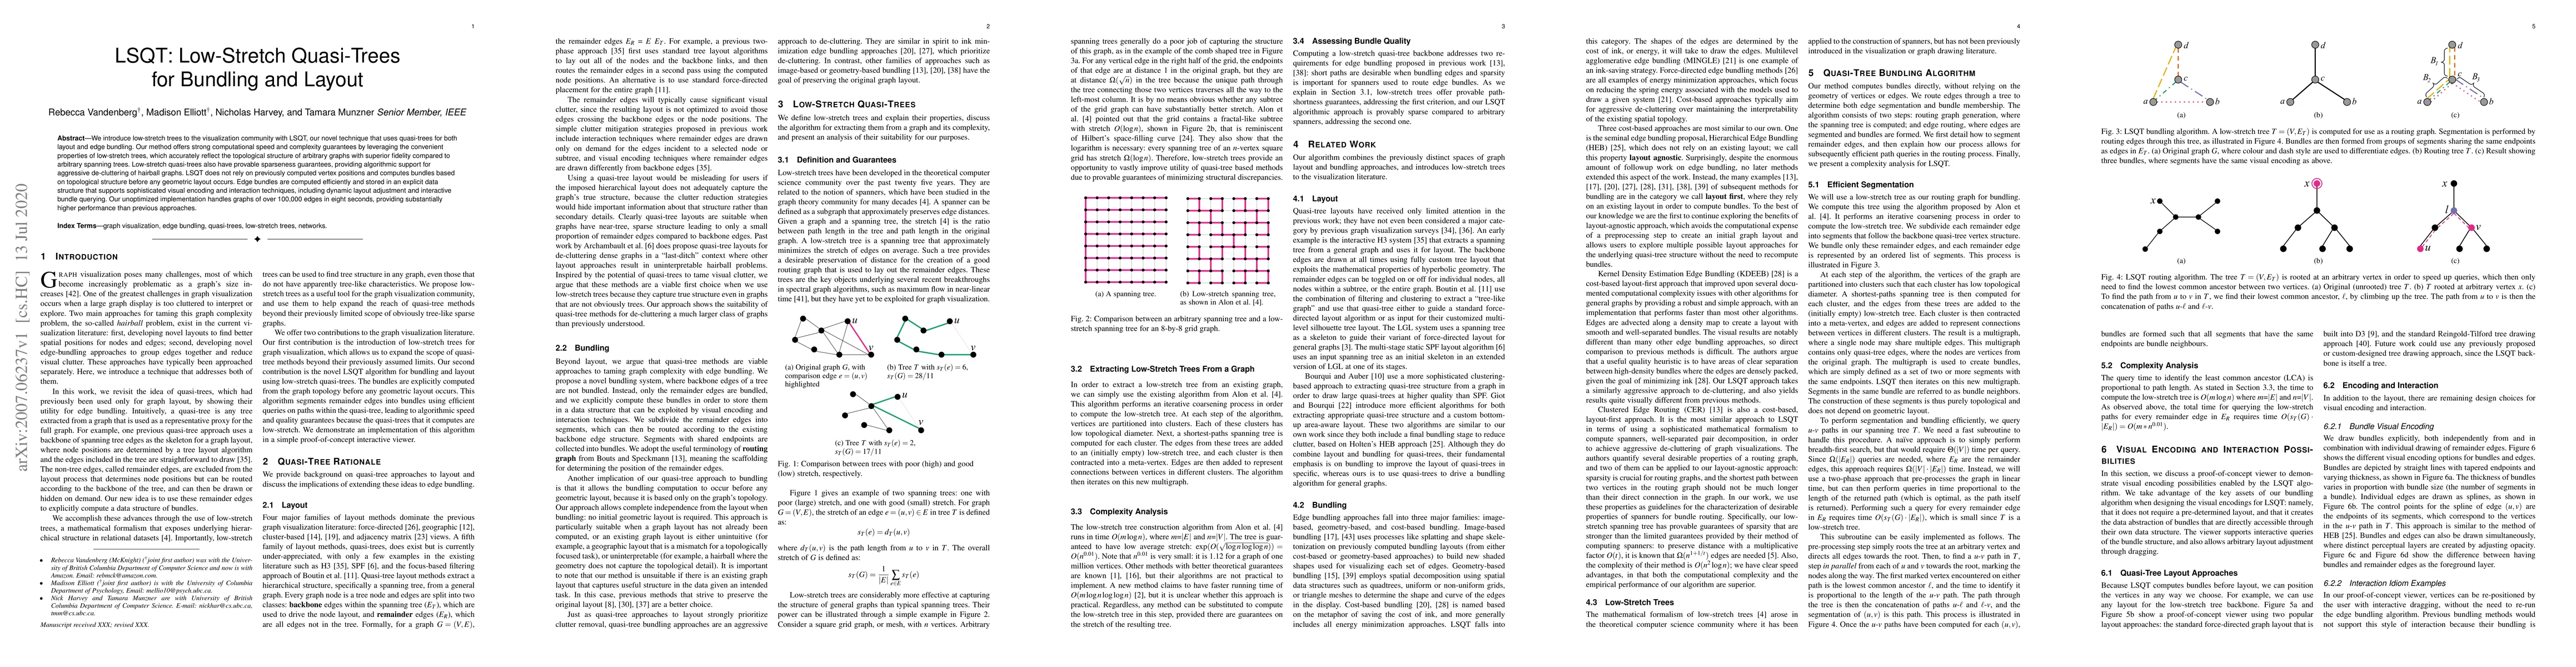
We introduce low-stretch trees to the visualization community with LSQT, our novel technique that uses quasi-trees for both layout and edge bundling. Our method offers strong computational speed and...
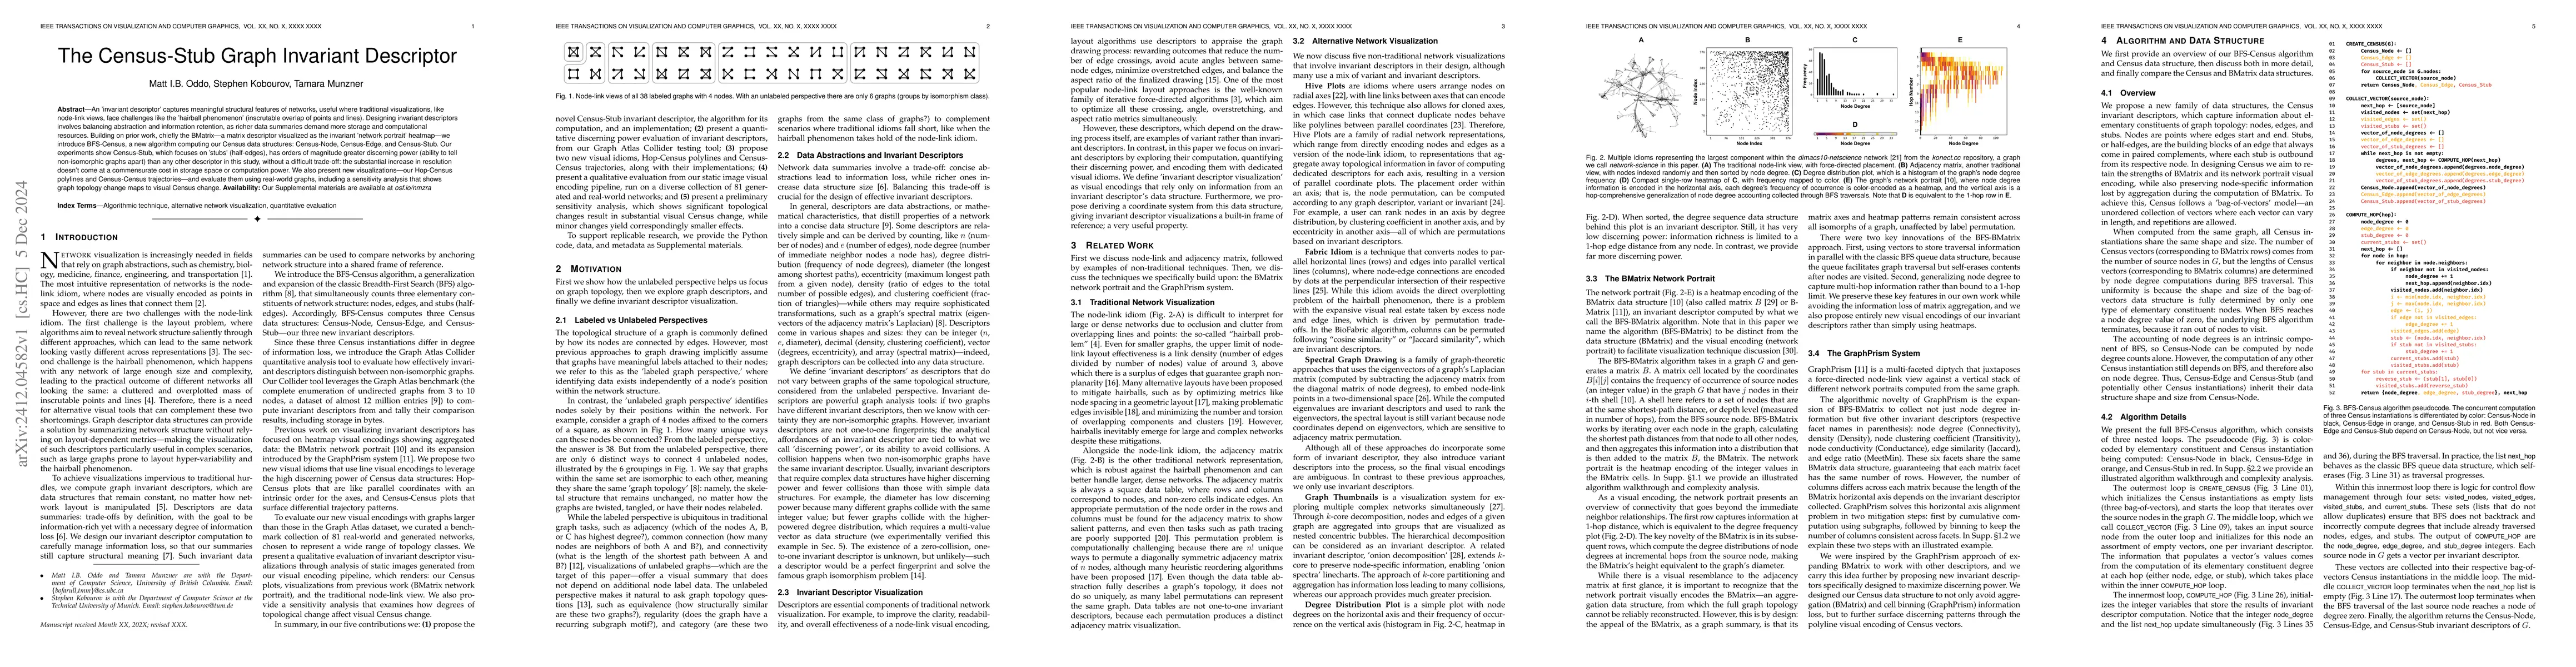
An invariant descriptor captures meaningful structural features of networks, useful where traditional visualizations, like node-link views, face challenges like the hairball phenomenon (inscrutable ov...
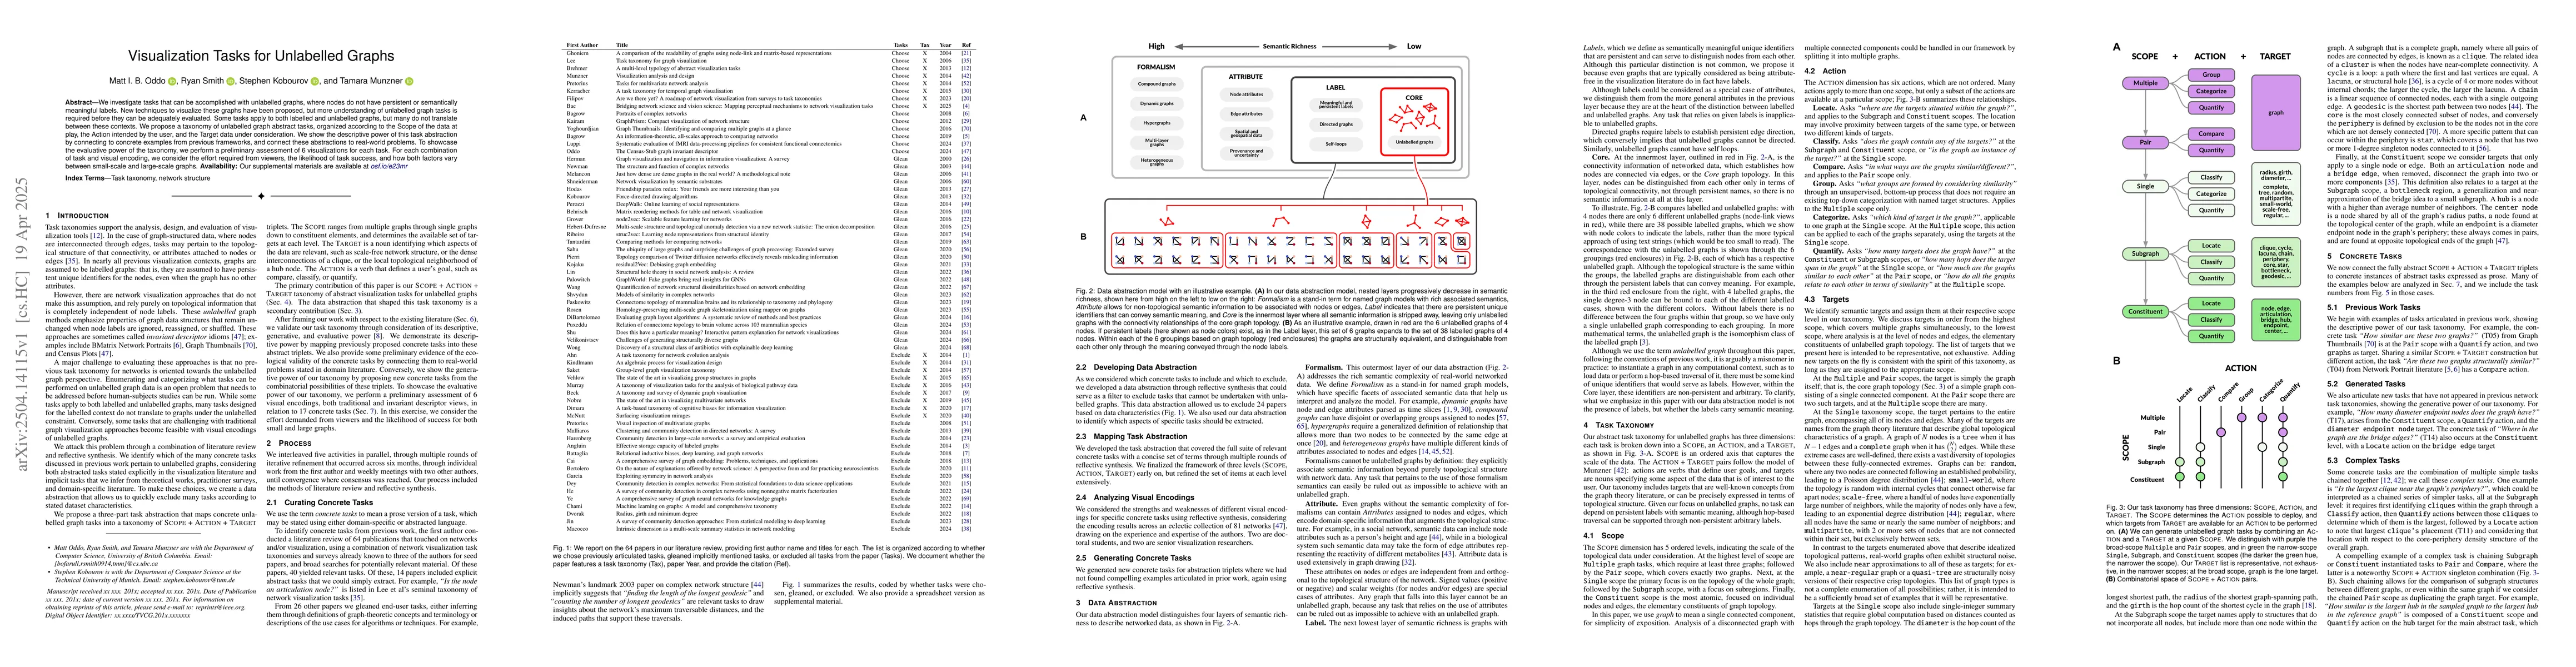
We investigate tasks that can be accomplished with unlabelled graphs, where nodes do not have persistent or semantically meaningful labels. New techniques to visualize these graphs have been proposed,...
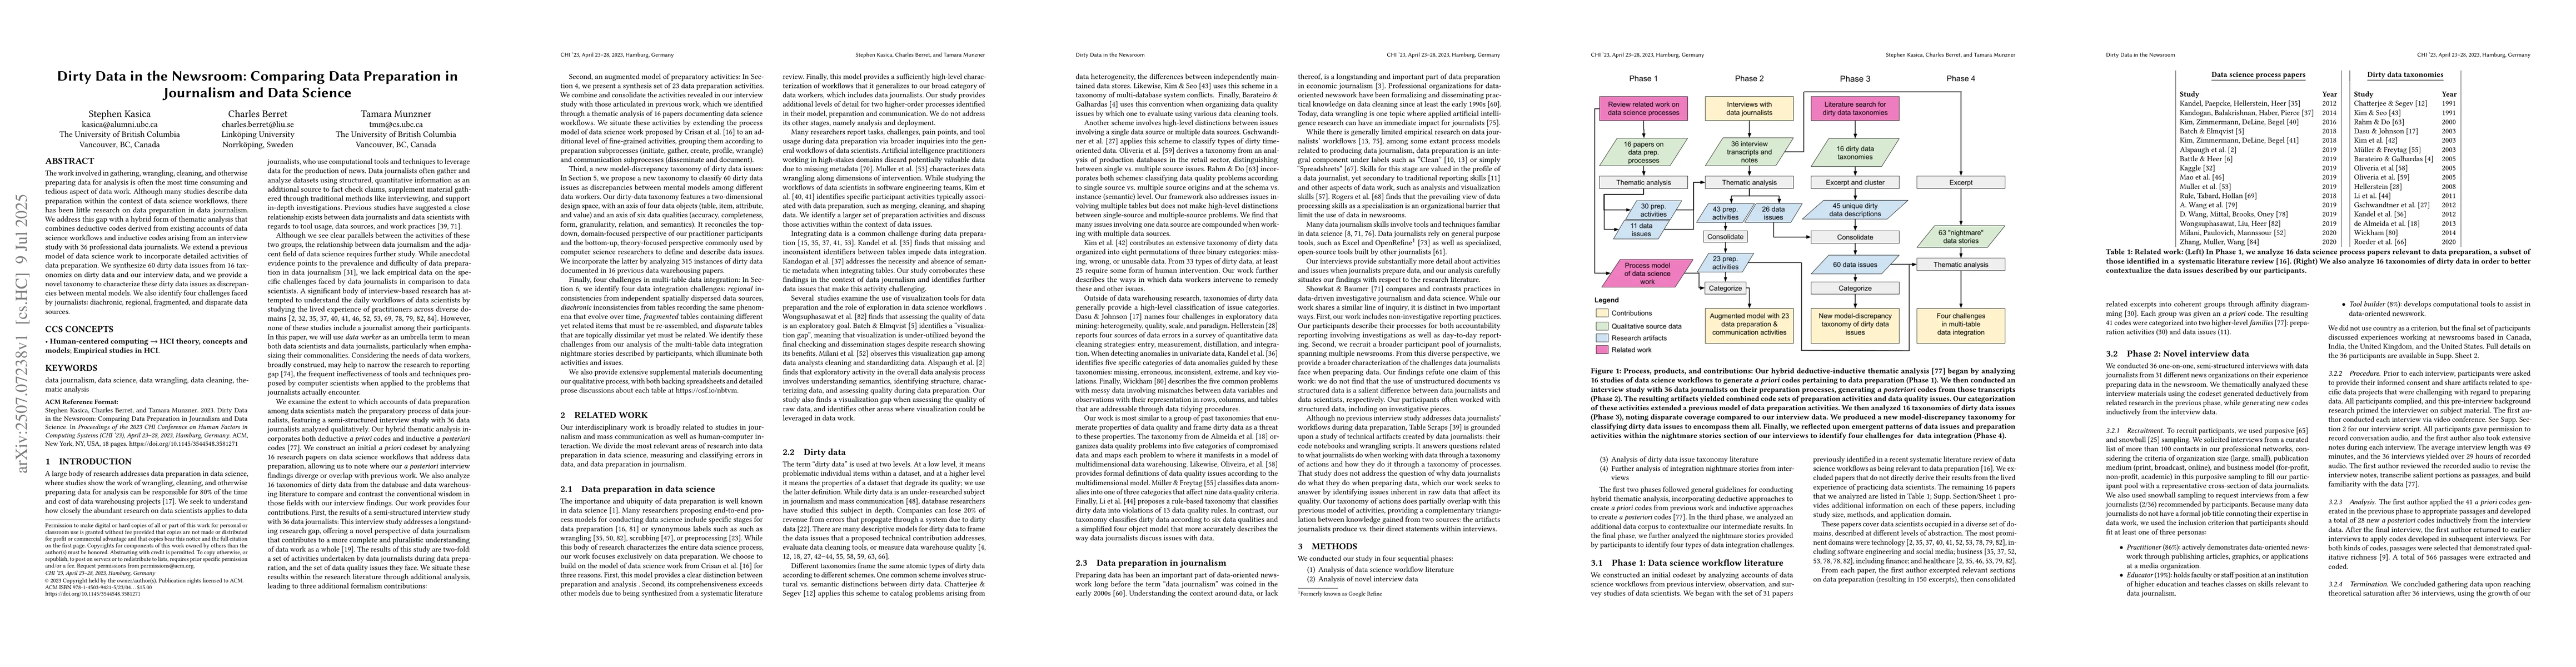
The work involved in gathering, wrangling, cleaning, and otherwise preparing data for analysis is often the most time consuming and tedious aspect of data work. Although many studies describe data pre...
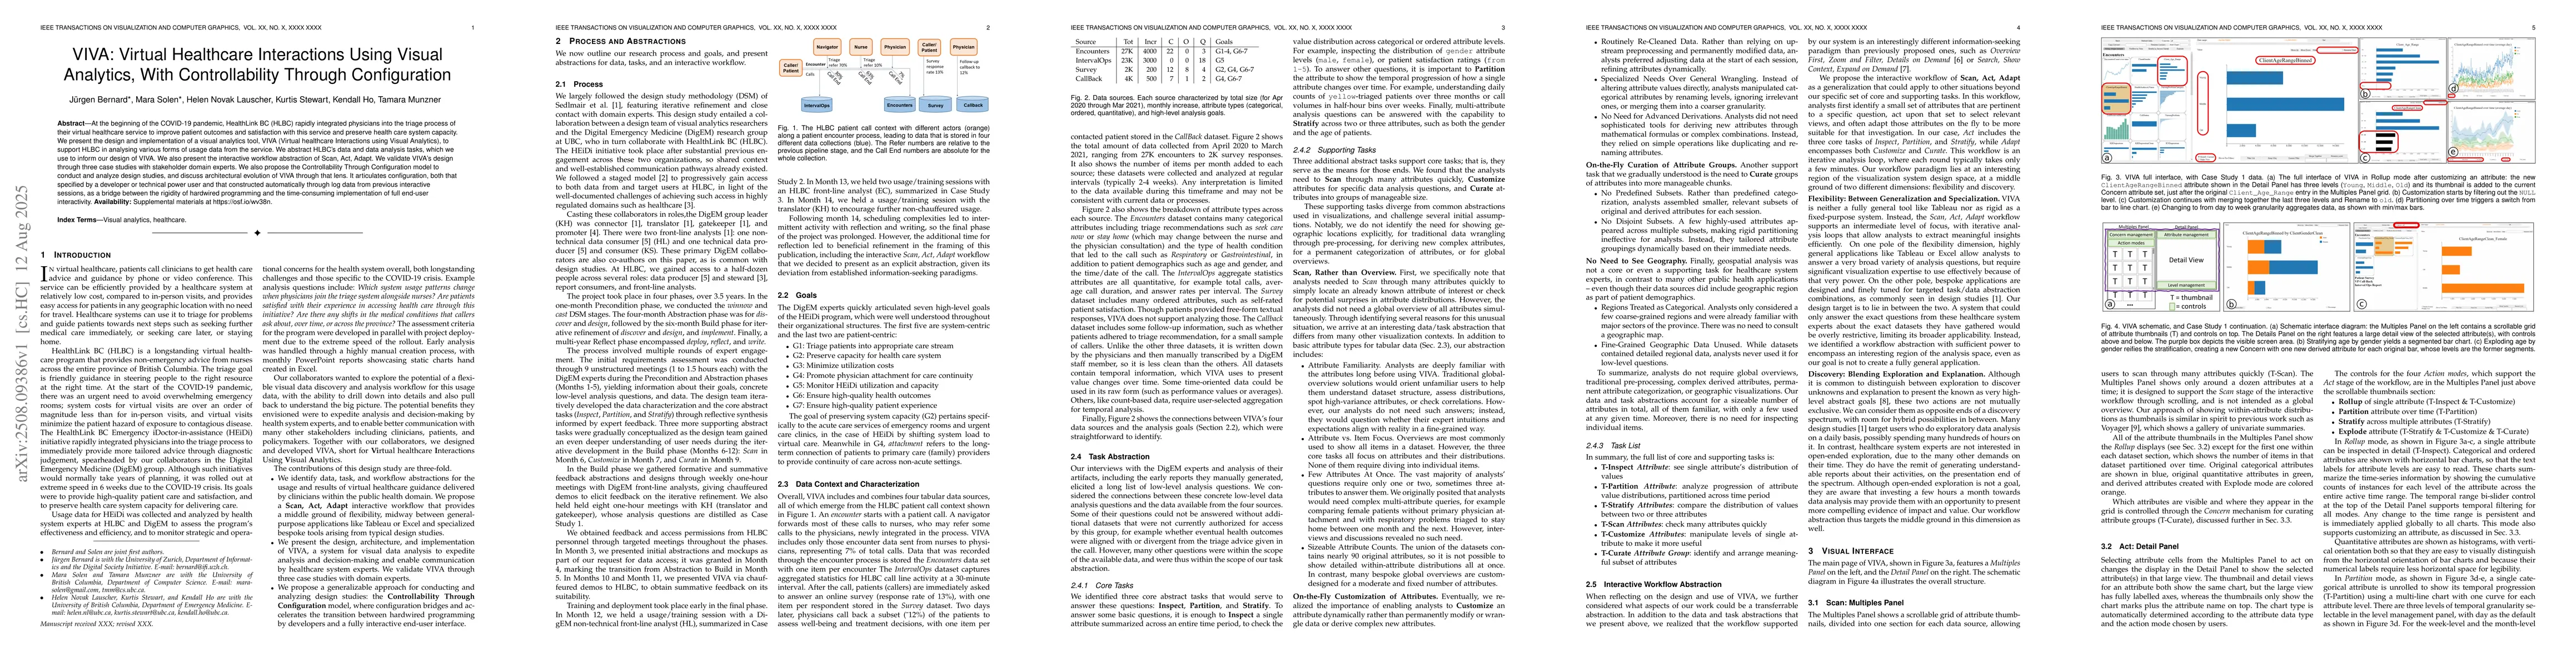
At the beginning of the COVID-19 pandemic, HealthLink BC (HLBC) rapidly integrated physicians into the triage process of their virtual healthcare service to improve patient outcomes and satisfaction w...
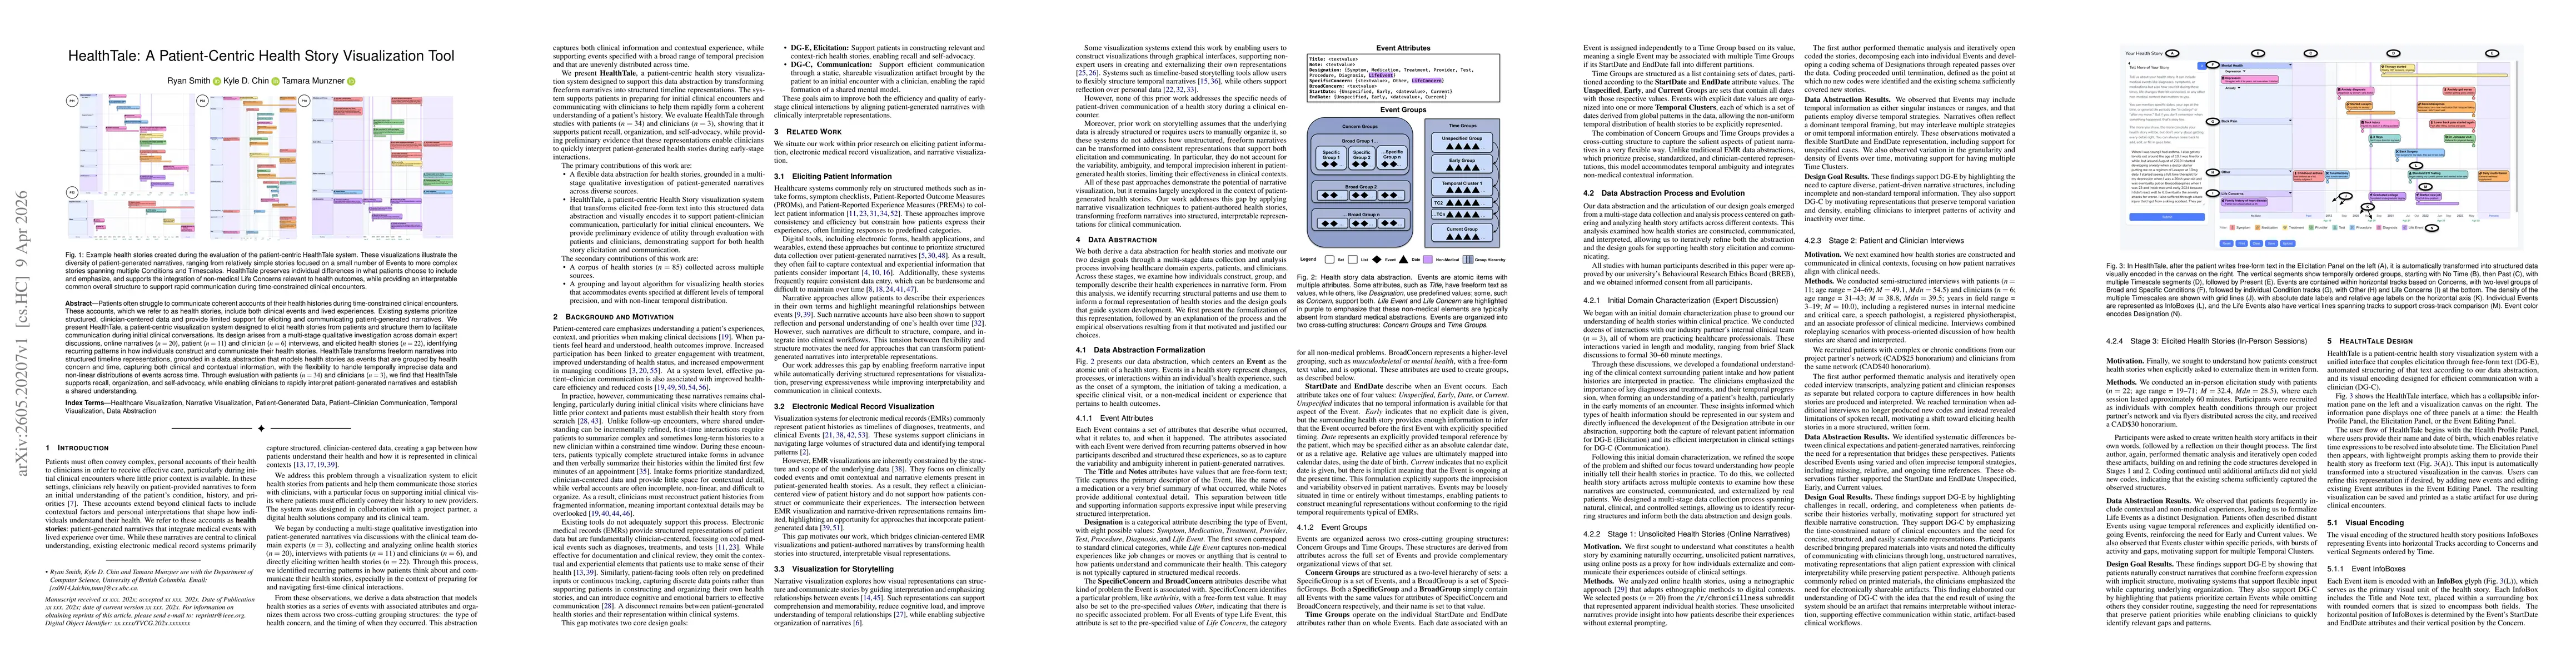
Patients often struggle to communicate coherent accounts of their health histories during time-constrained clinical encounters. These accounts, which we refer to as health stories, include both clinic...
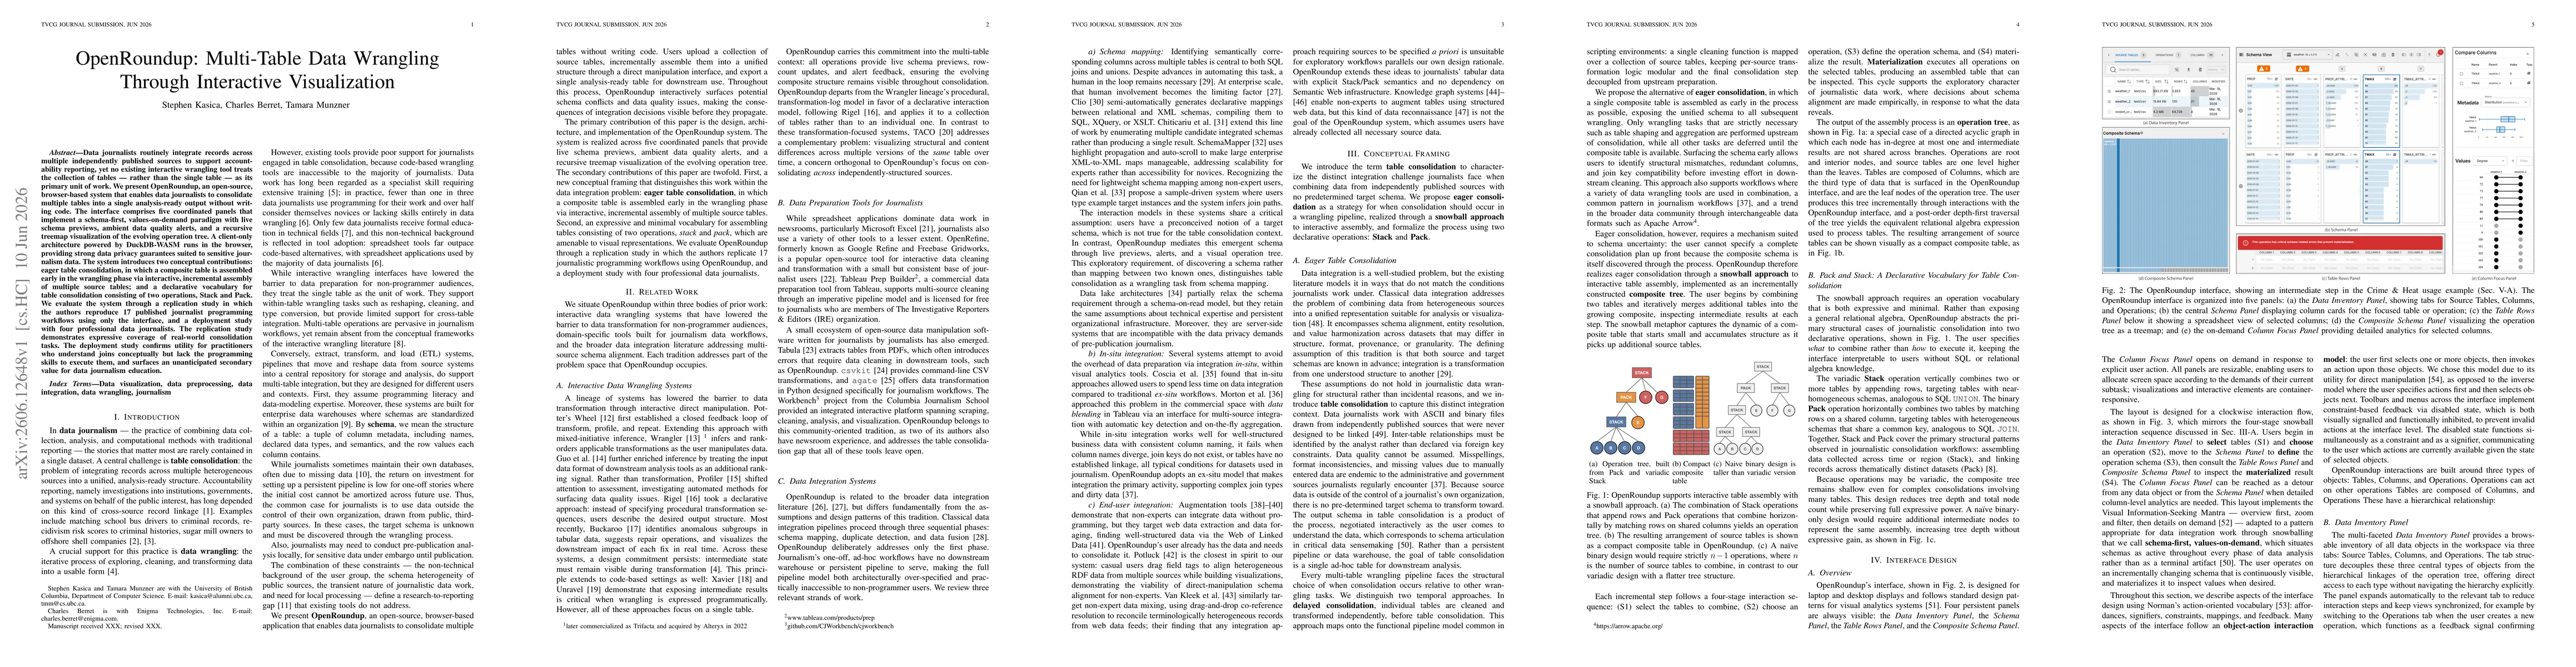
Data journalists routinely integrate records across multiple independently published sources to support accountability reporting, yet no existing interactive wrangling tool treats the collection of ta...
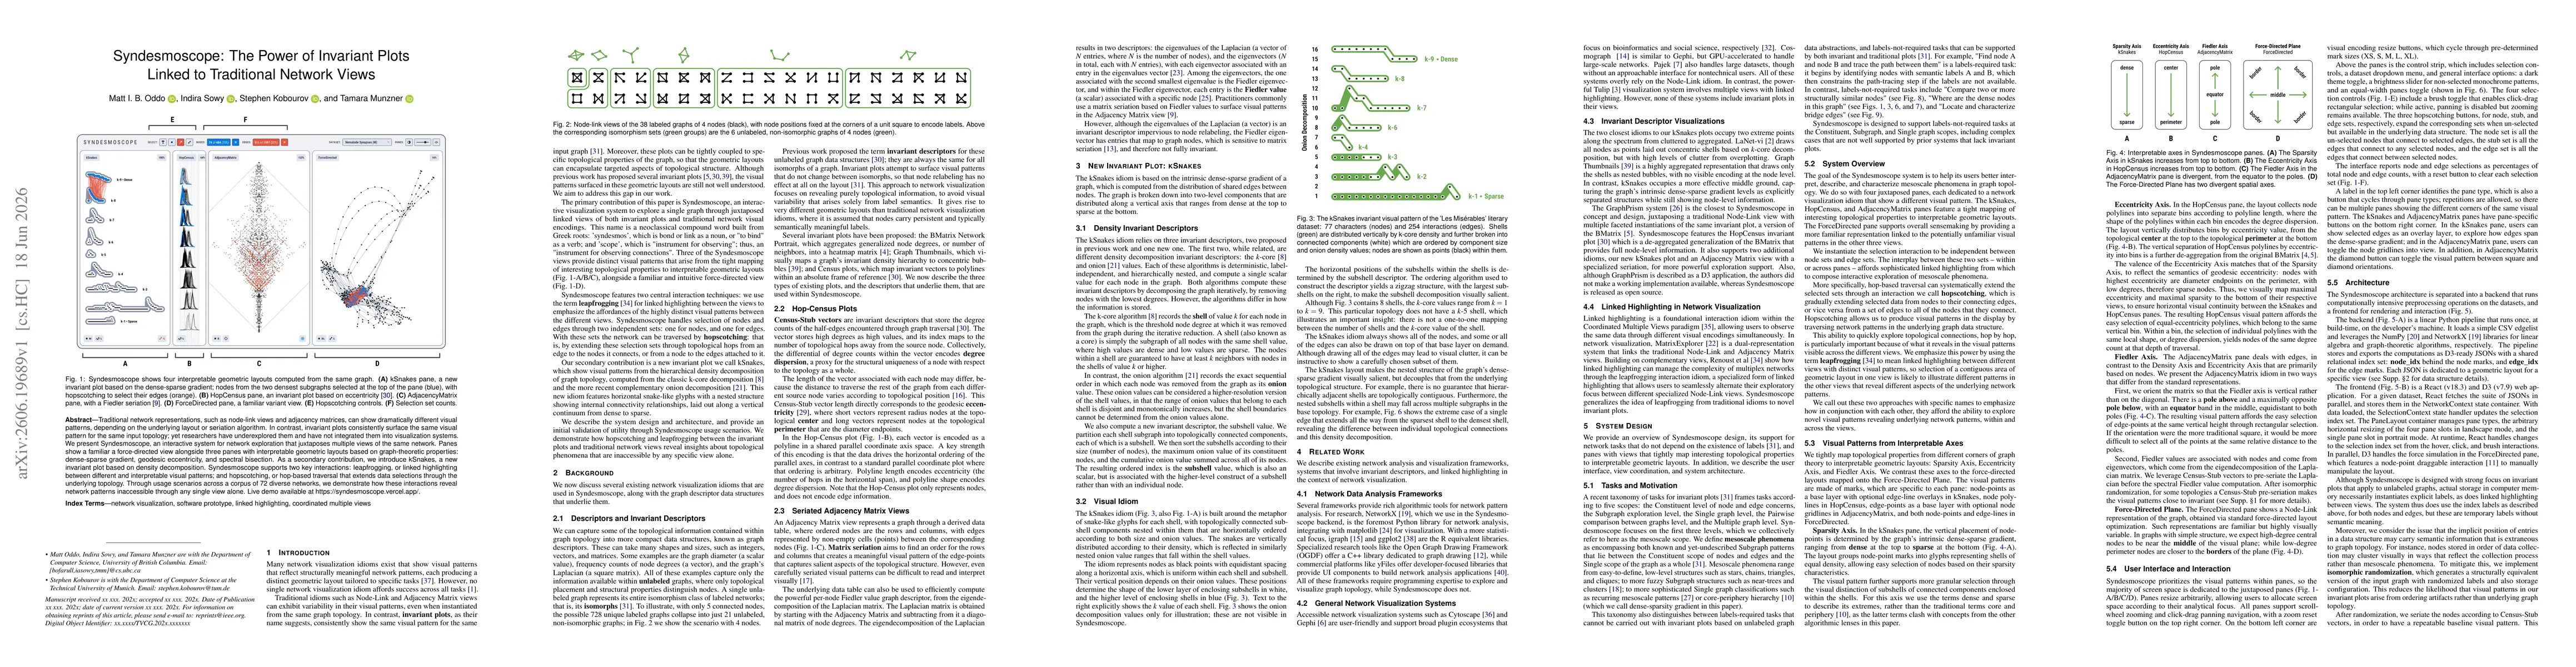
Traditional network representations, such as node-link views and adjacency matrices, can show dramatically different visual patterns, depending on the underlying layout or seriation algorithm. In cont...