1
arXiv Papers
2
Total Publications
Profile
Academic Profile
Metrics
Statistics
1
arXiv Papers
2
Total Publications
Network
Similar Authors
Publications
Papers on arXiv
arXiv
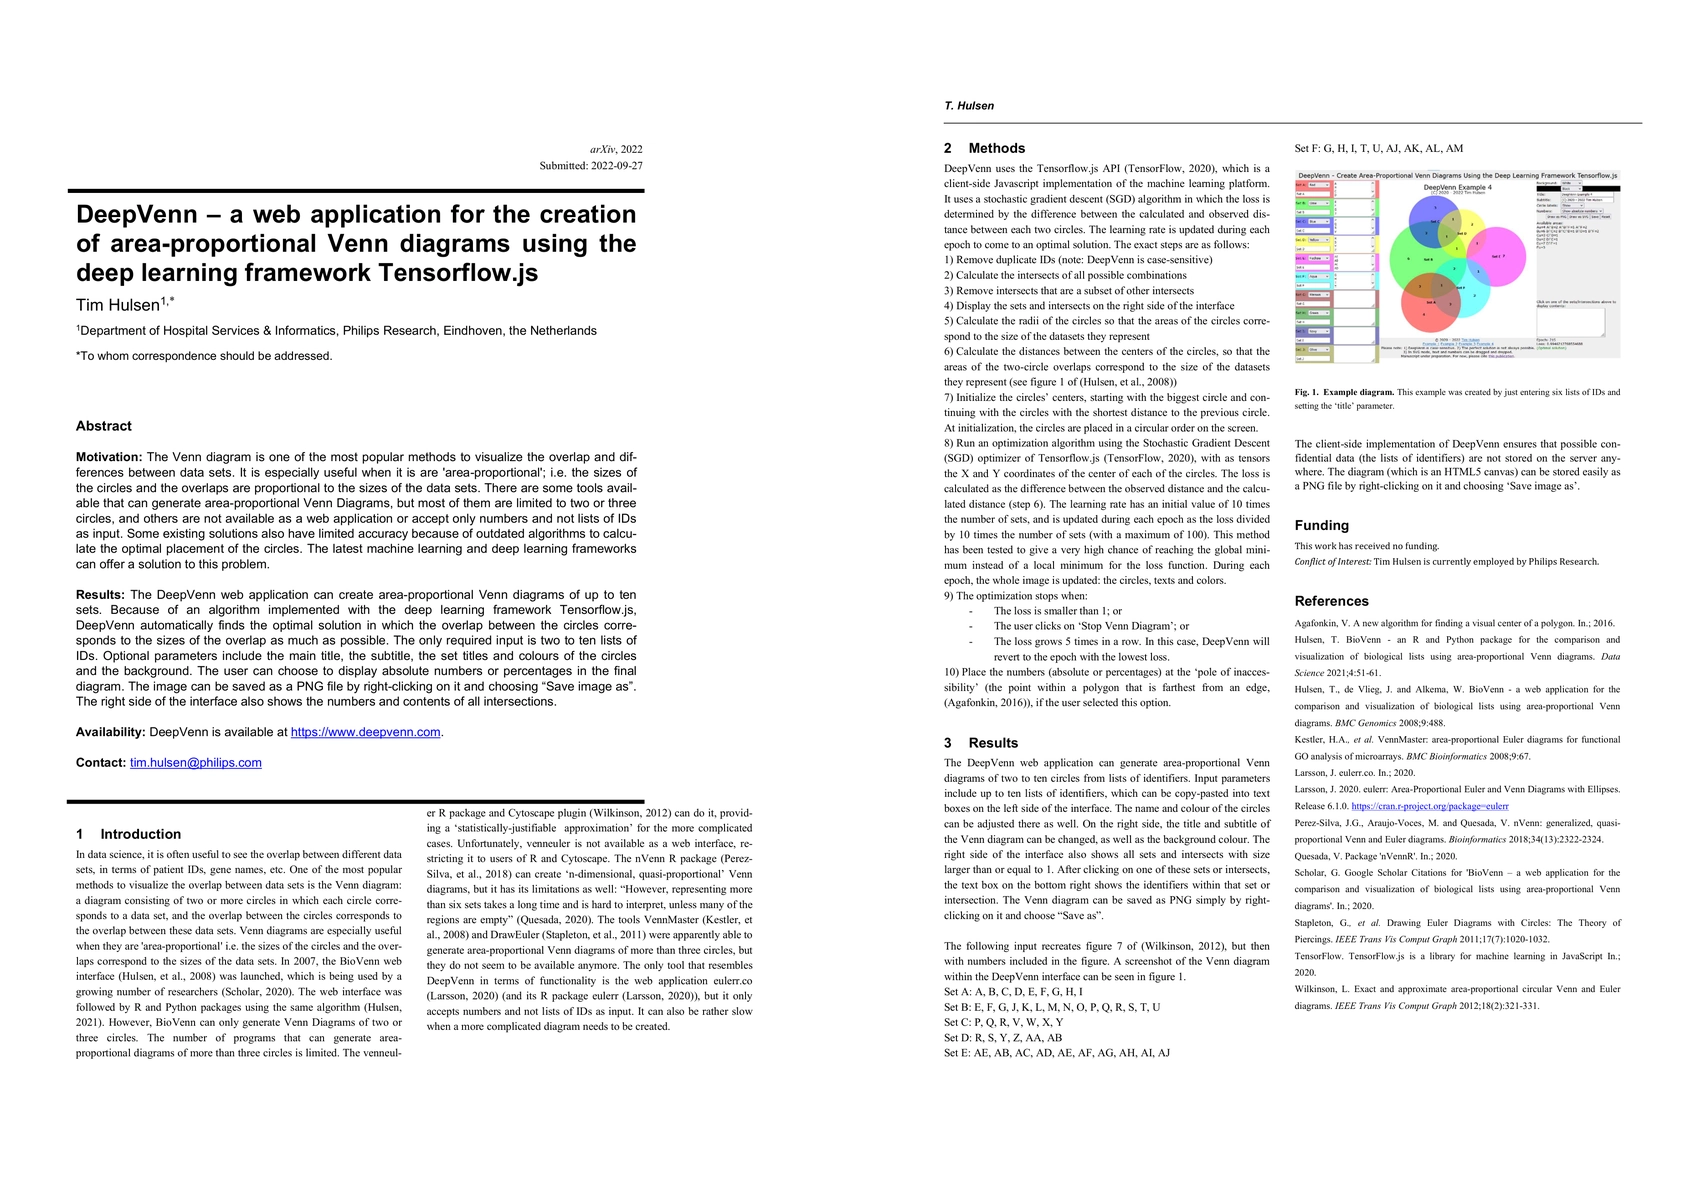
DeepVenn -- a web application for the creation of area-proportional Venn
diagrams using the deep learning framework Tensorflow.js
Motivation: The Venn diagram is one of the most popular methods to visualize the overlap and differences between data sets. It is especially useful when it is are 'area-proportional'; i.e. the sizes...