Academic Profile
Statistics
Similar Authors
Papers on arXiv
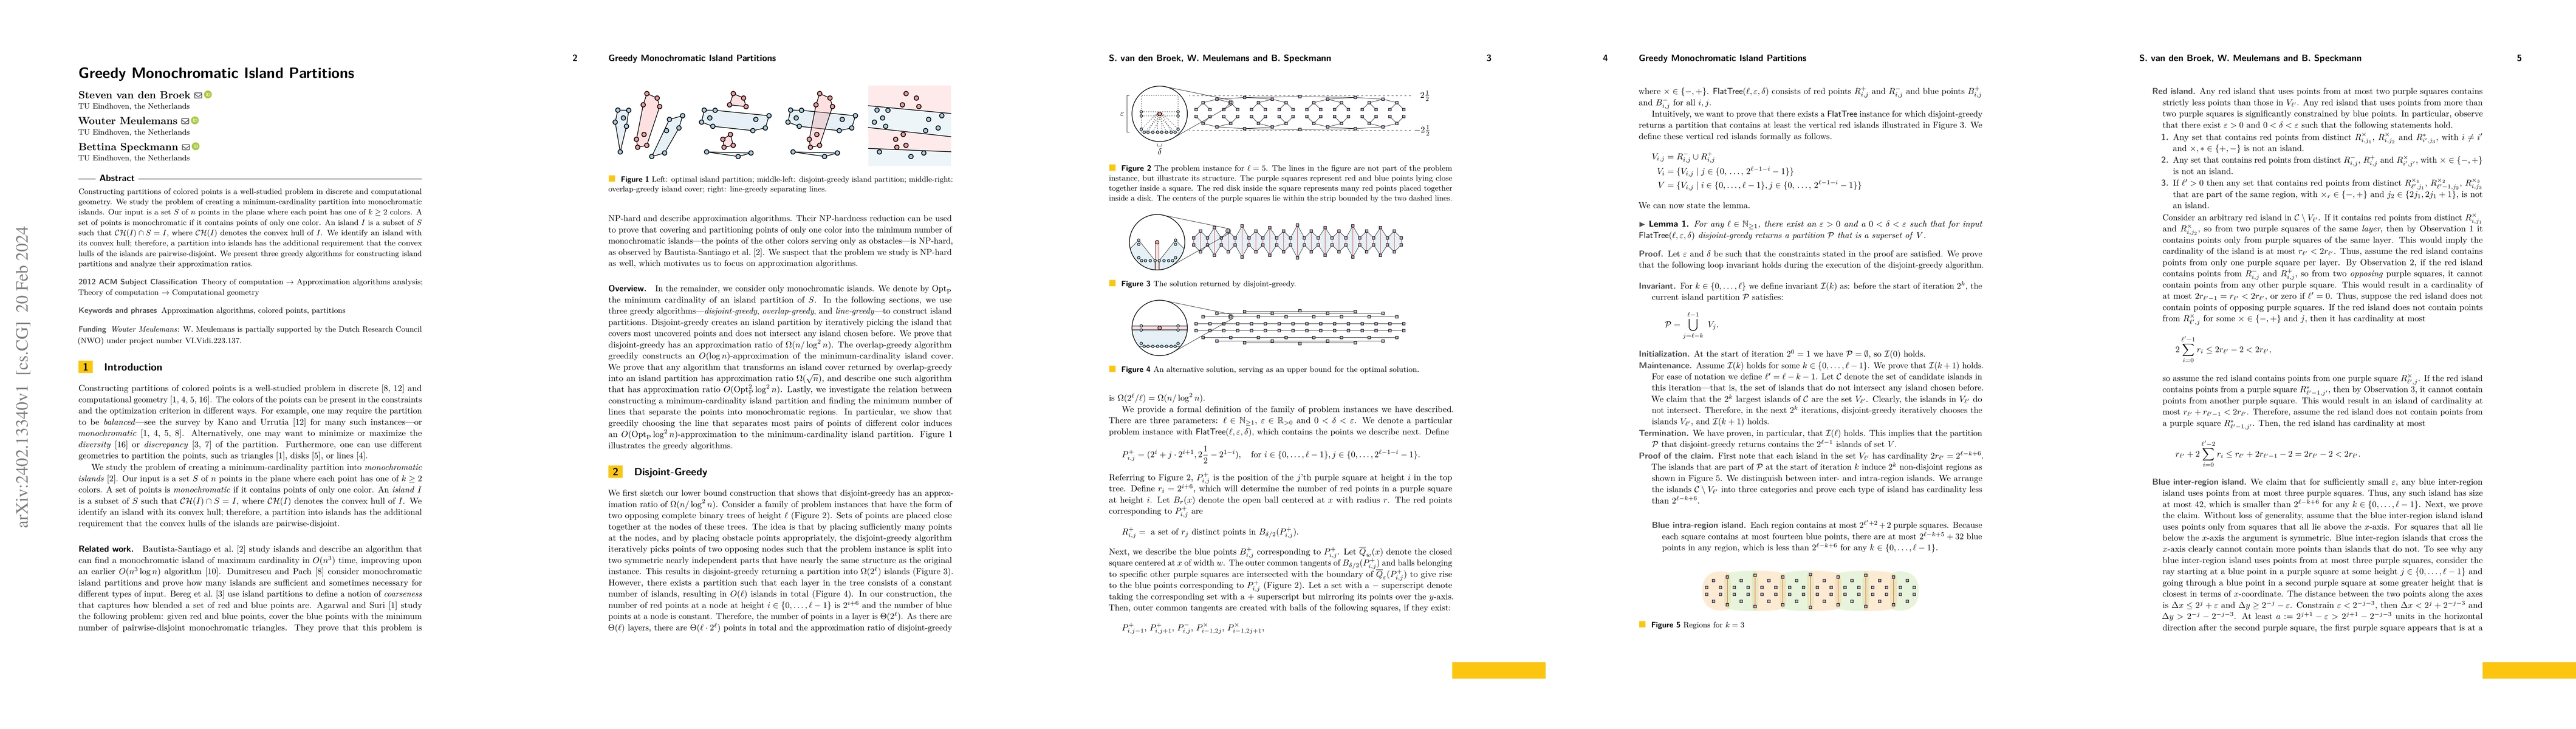
Constructing partitions of colored points is a well-studied problem in discrete and computational geometry. We study the problem of creating a minimum-cardinality partition into monochromatic island...
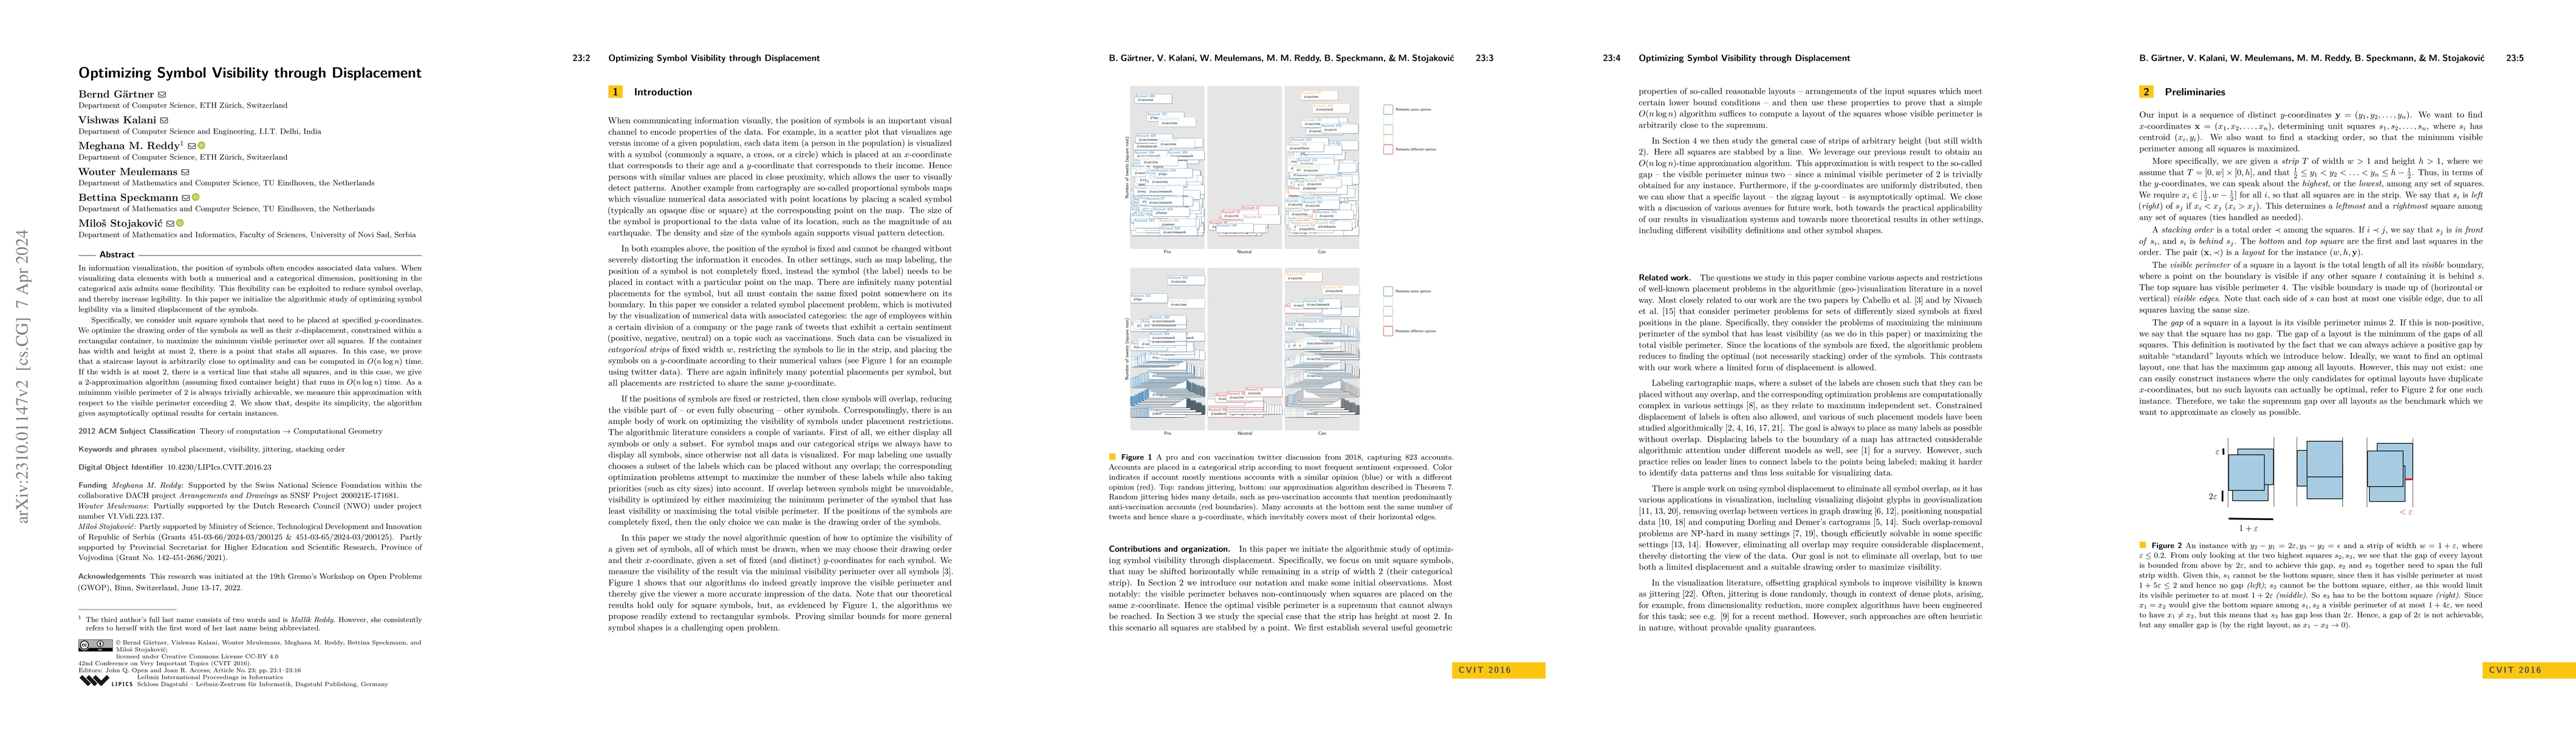
In information visualization, the position of symbols often encodes associated data values. When visualizing data elements with both a numerical and a categorical dimension, positioning in the categ...
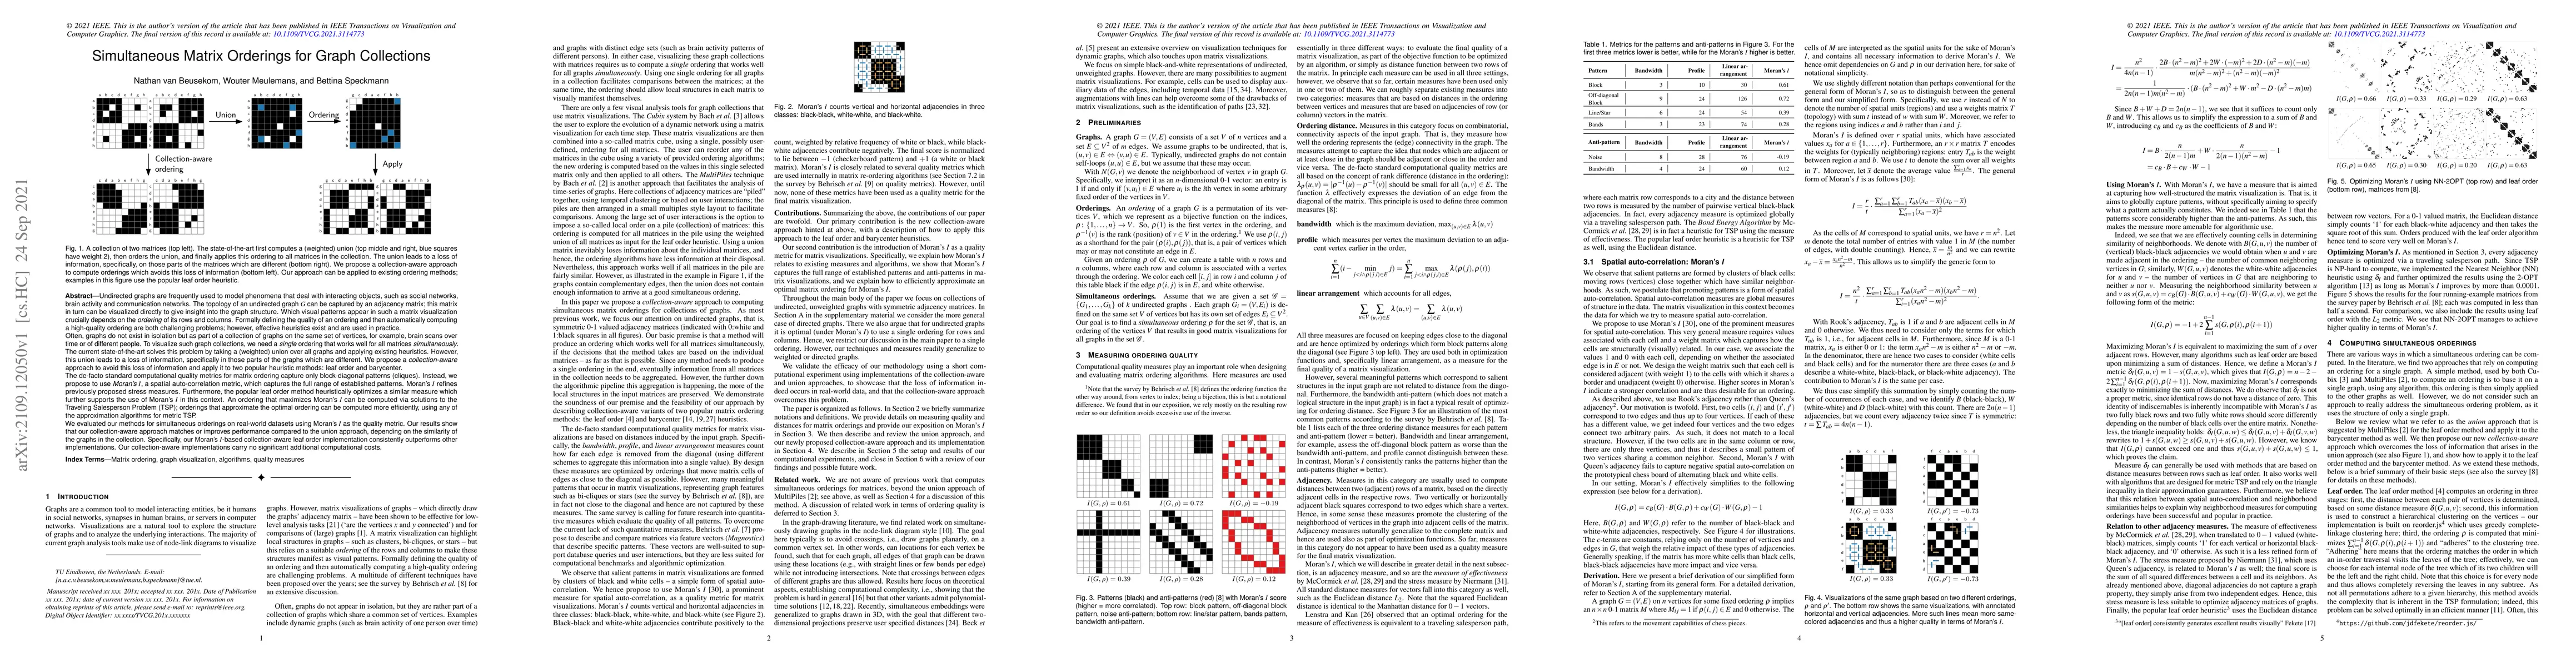
Undirected graphs are frequently used to model networks. The topology of an undirected graph G can be captured by an adjacency matrix; this matrix in turn can be visualized directly to give insight ...
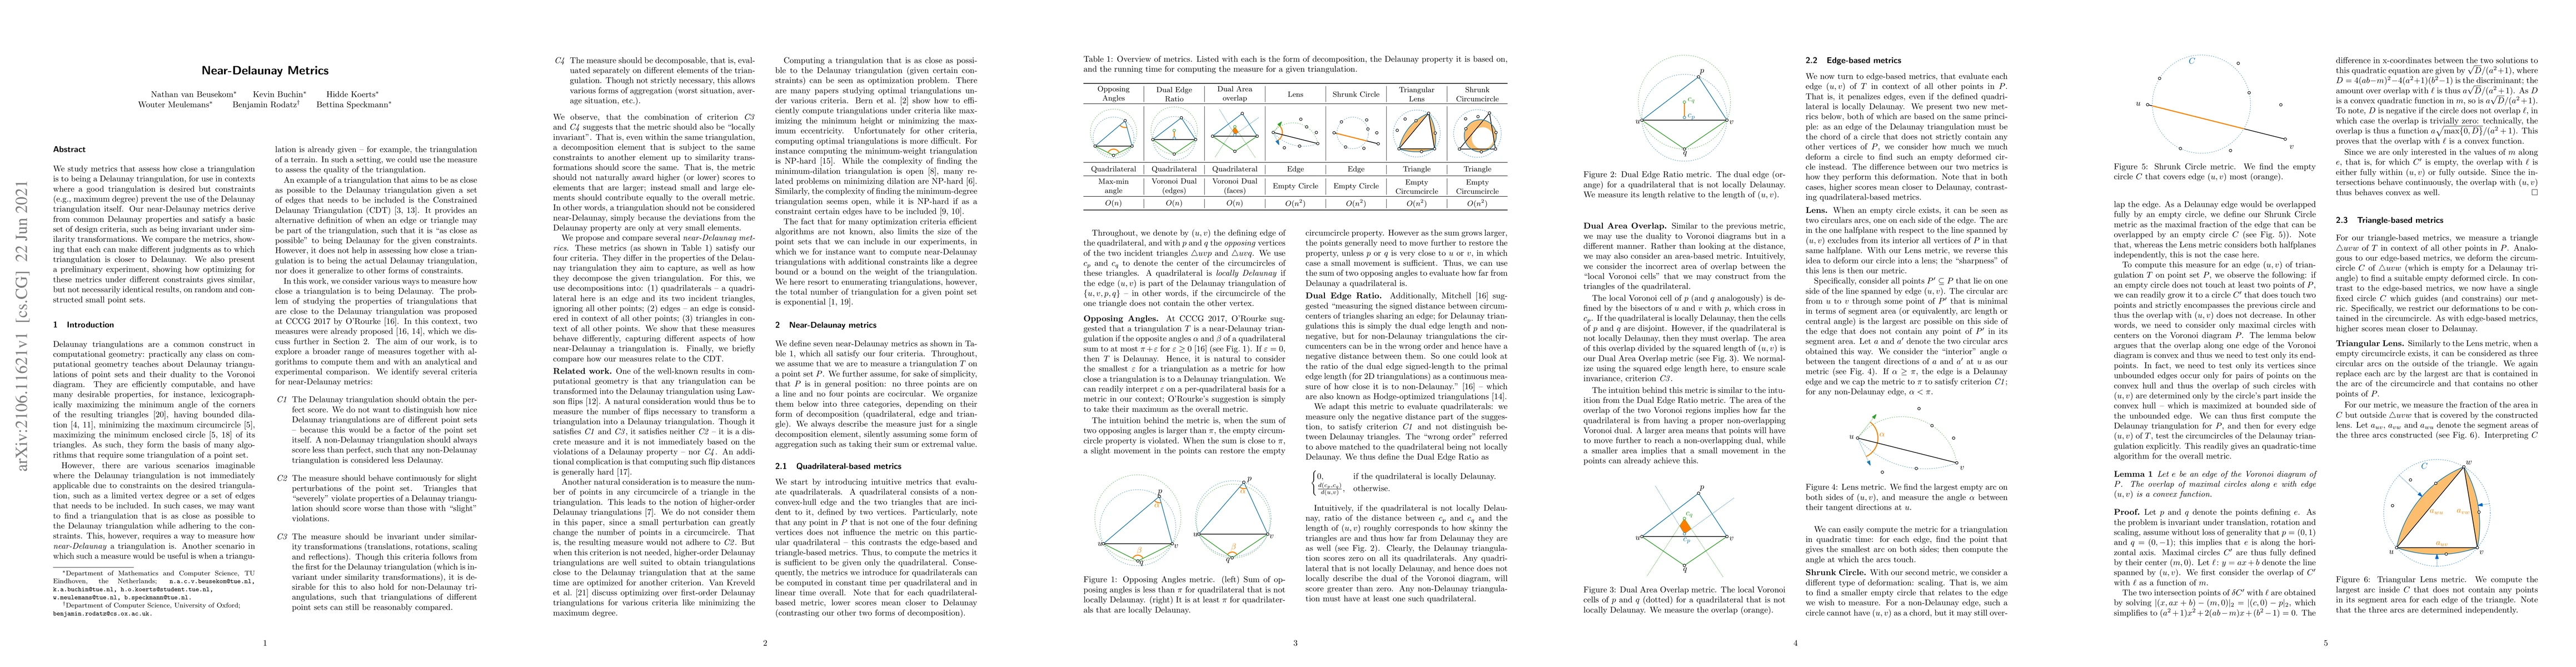
We study metrics that assess how close a triangulation is to being a Delaunay triangulation, for use in contexts where a good triangulation is desired but constraints (e.g., maximum degree) prevent ...

Machine learning and data mining techniques are effective tools to classify large amounts of data. But they tend to preserve any inherent bias in the data, for example, with regards to gender or rac...
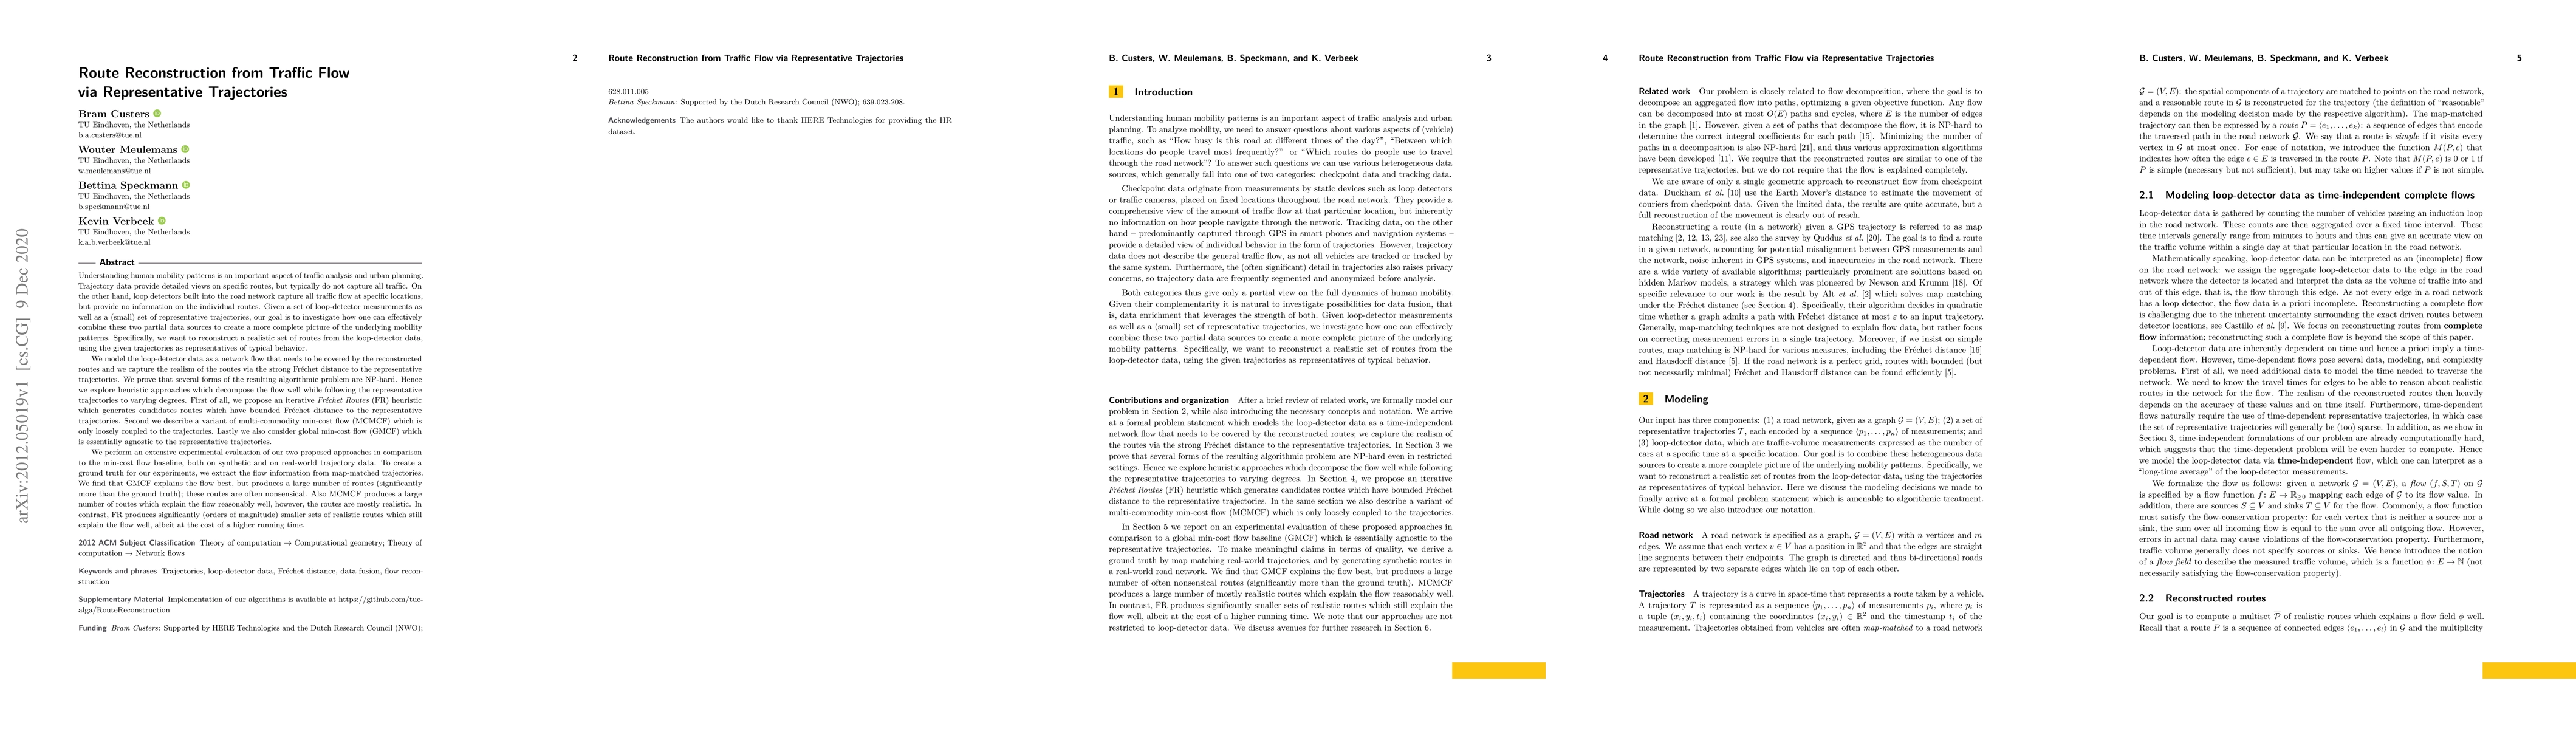
Understanding human mobility is an important aspect of traffic analysis and urban planning. Trajectories provide detailed views on specific routes, but typically do not capture all traffic. Loop det...
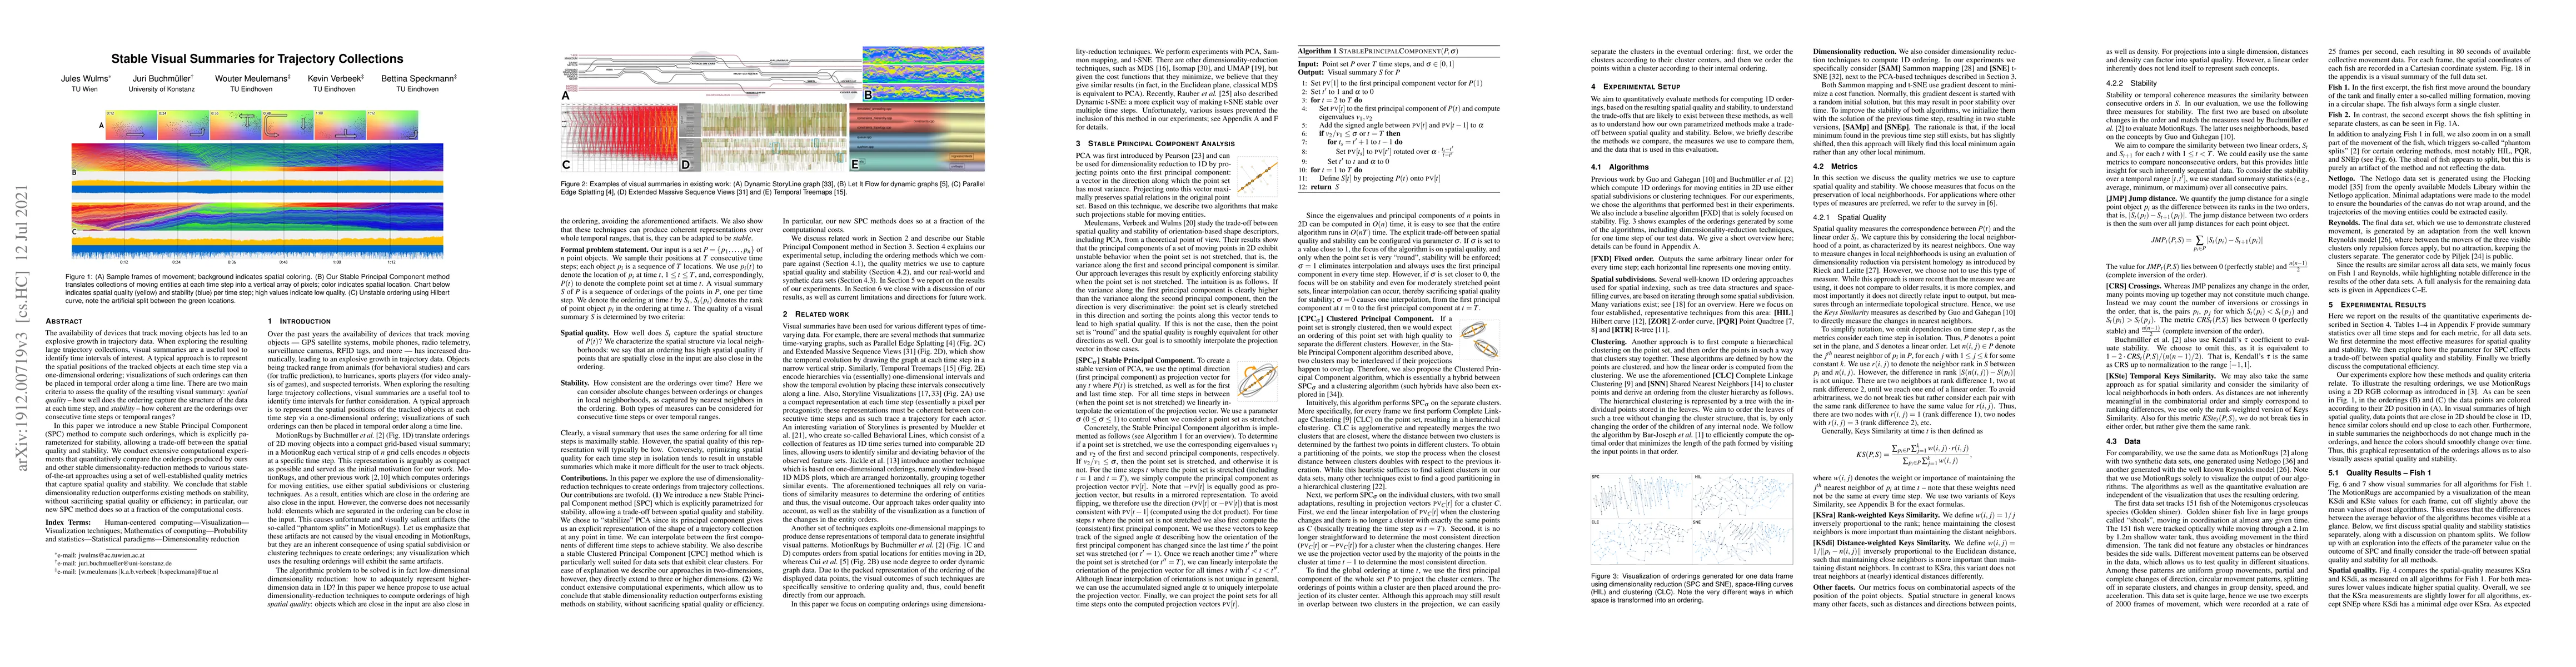
The availability of devices that track moving objects has led to an explosive growth in trajectory data. When exploring the resulting large trajectory collections, visual summaries are a useful tool...
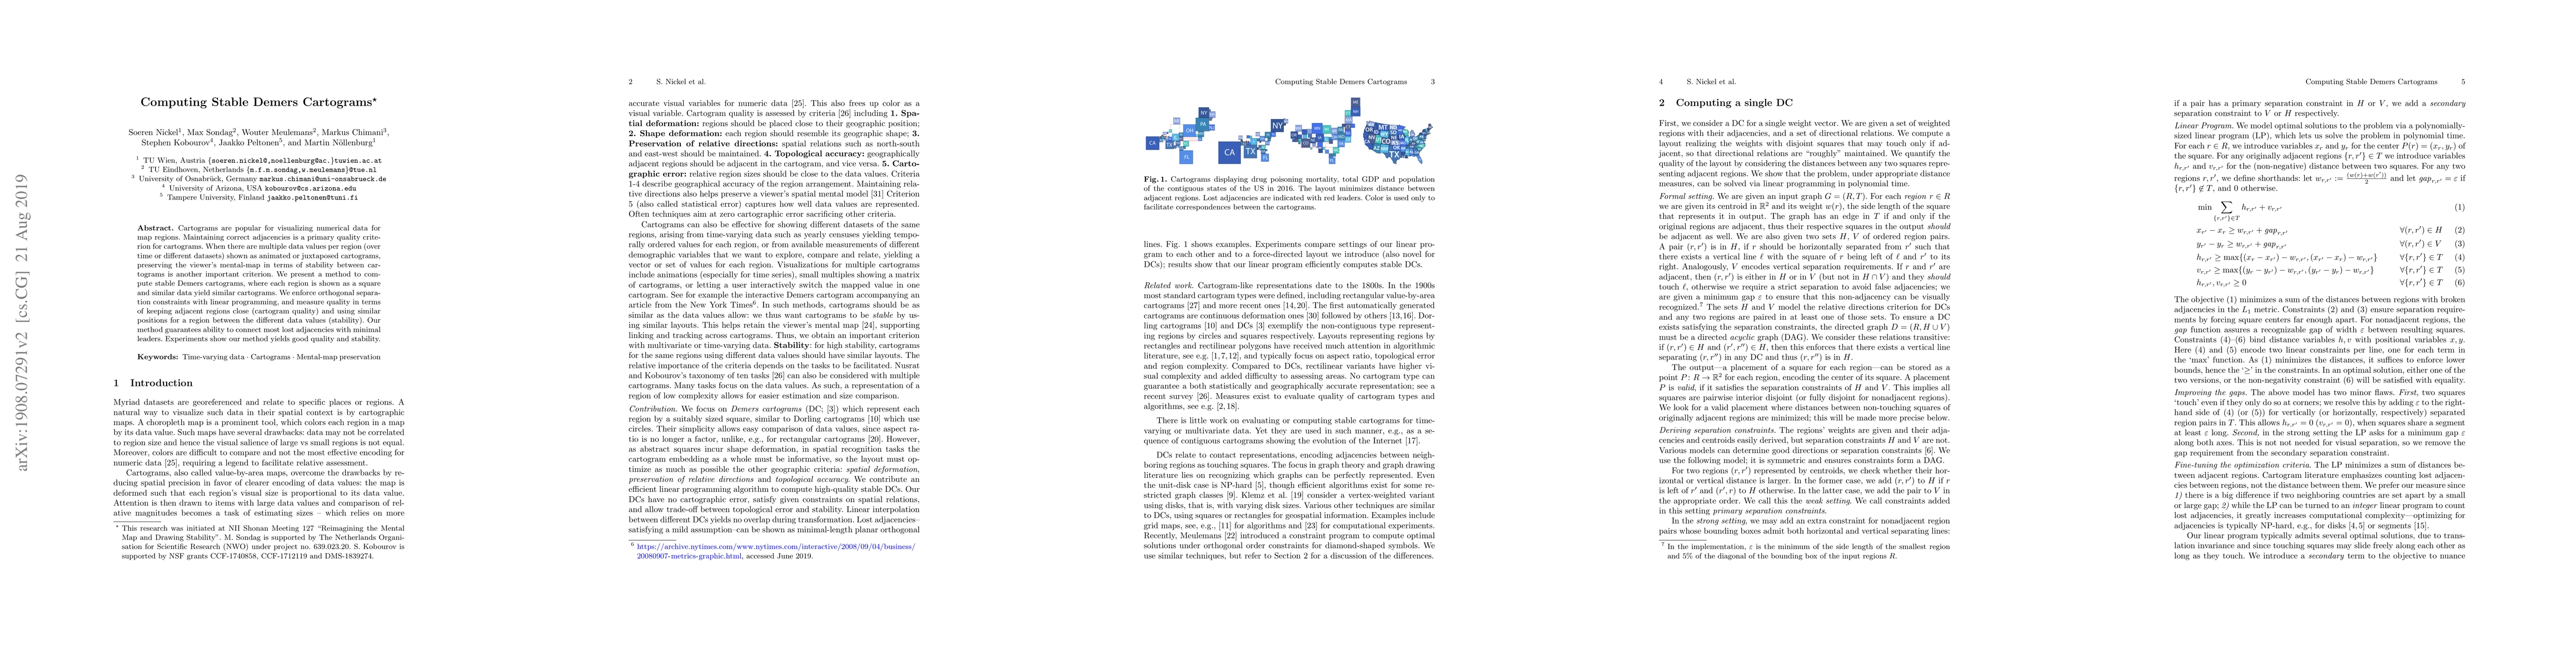
Cartograms are popular for visualizing numerical data for map regions. Maintaining correct adjacencies is a primary quality criterion for cartograms. When there are multiple data values per region (...
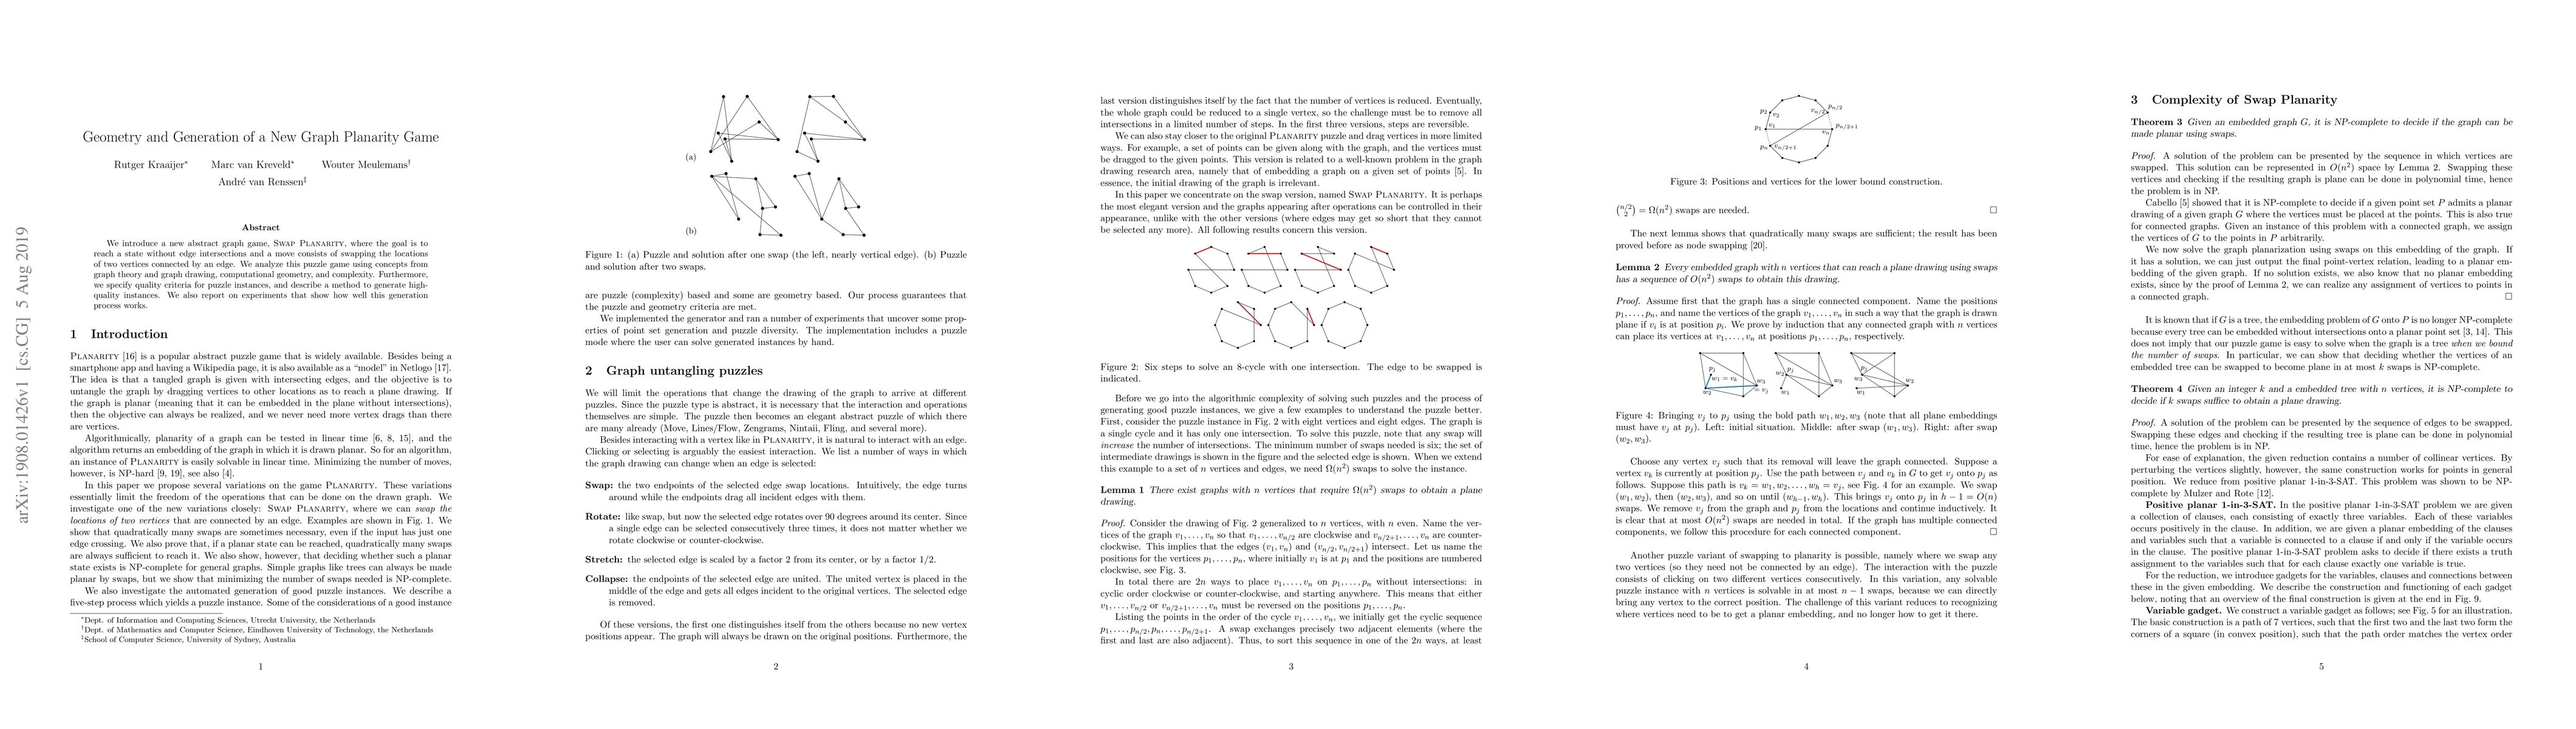
We introduce a new abstract graph game, Swap Planarity, where the goal is to reach a state without edge intersections and a move consists of swapping the locations of two vertices connected by an ed...
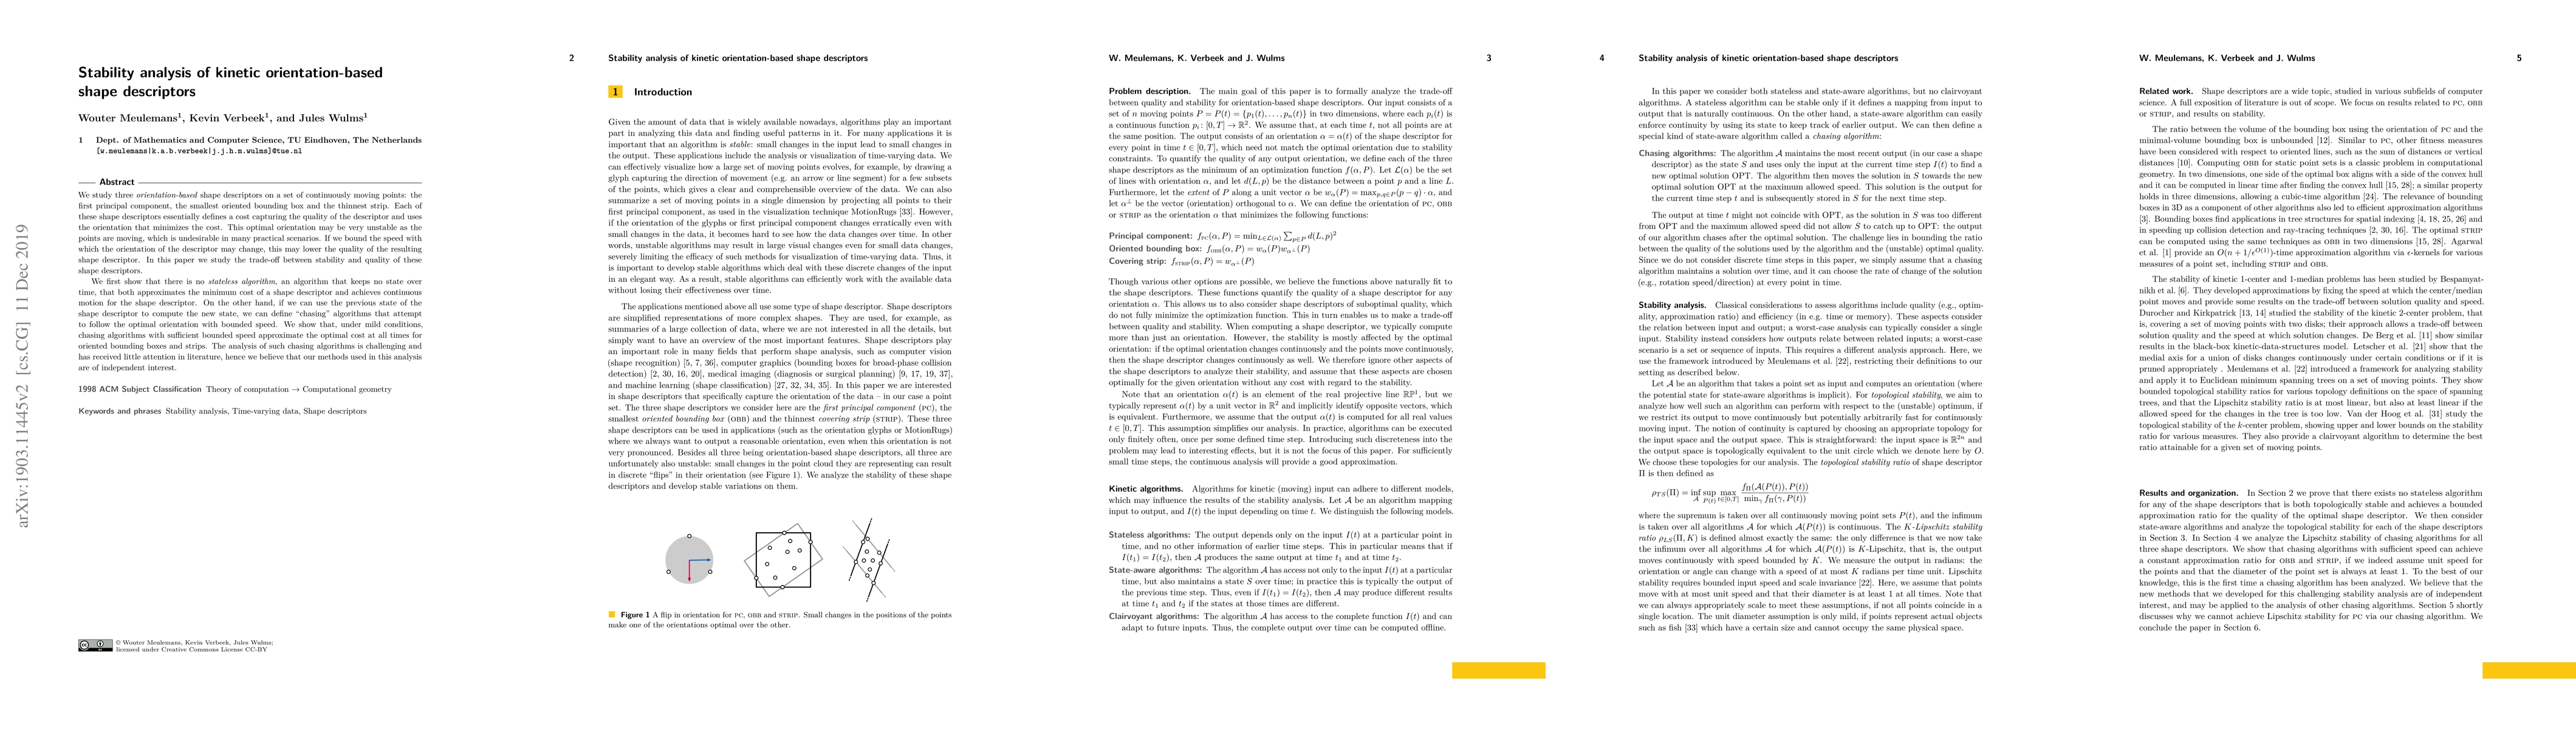
We study three orientation-based shape descriptors on a set of continuously moving points: the first principal component, the smallest oriented bounding box and the thinnest strip. Each of these sha...
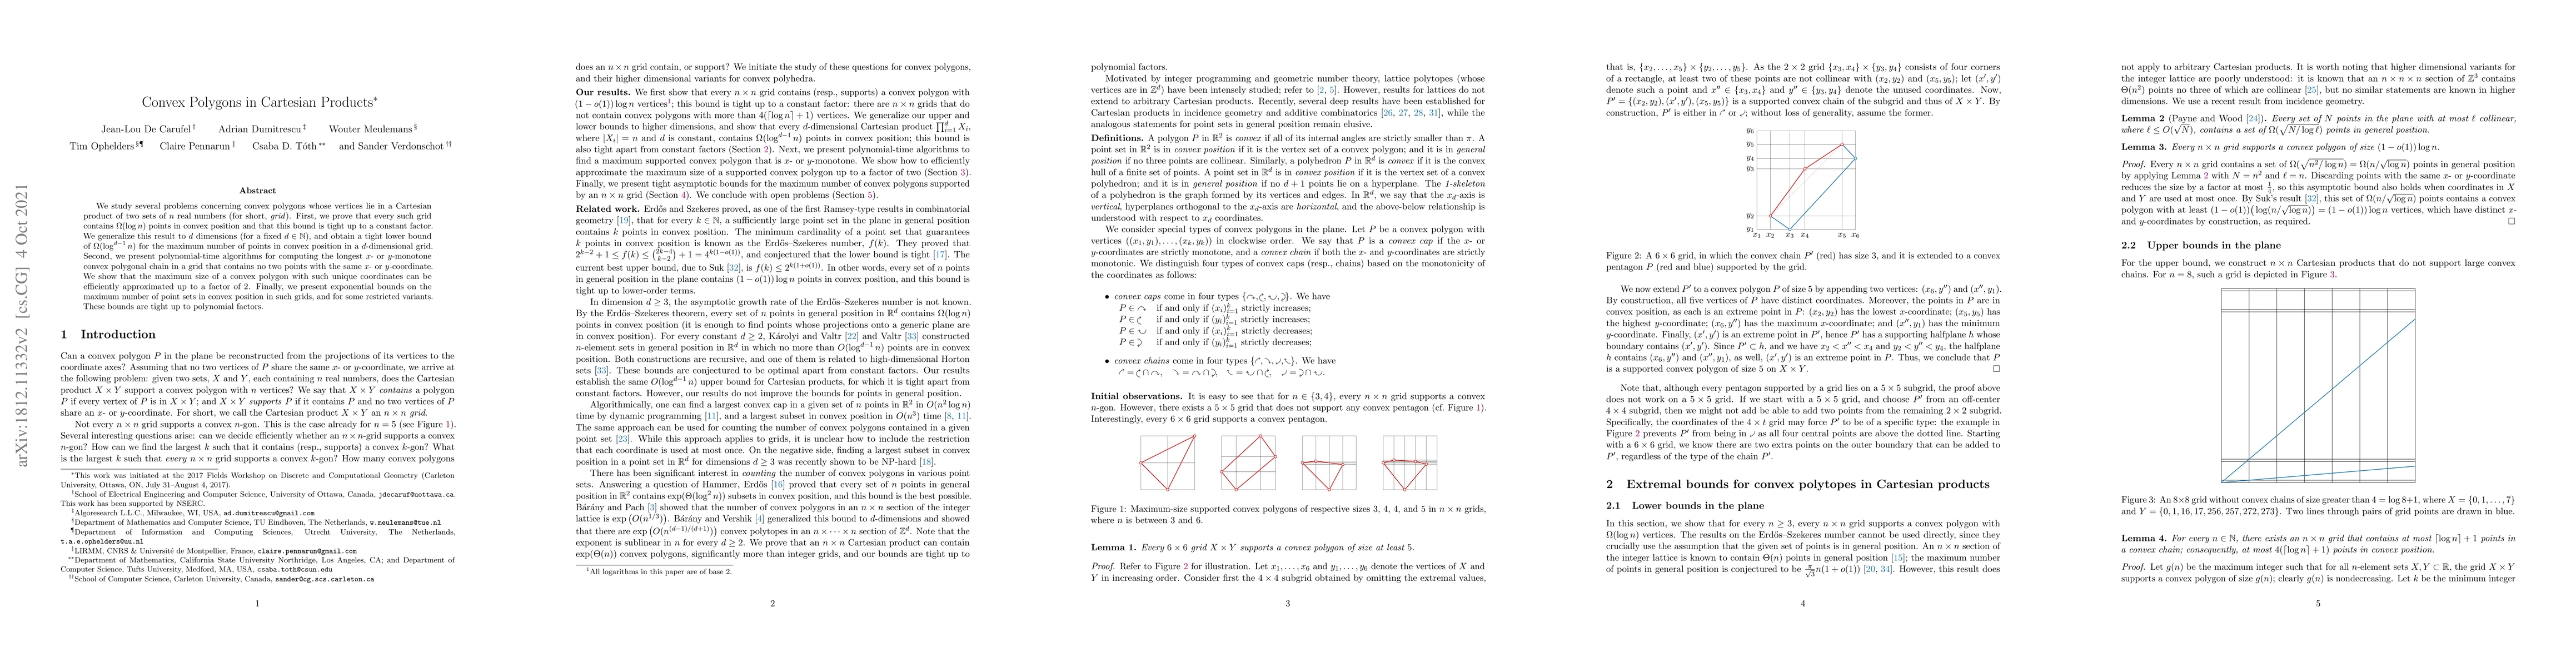
We study several problems concerning convex polygons whose vertices lie in a Cartesian product of two sets of $n$ real numbers (for short, \emph{grid}). First, we prove that every such grid contains...
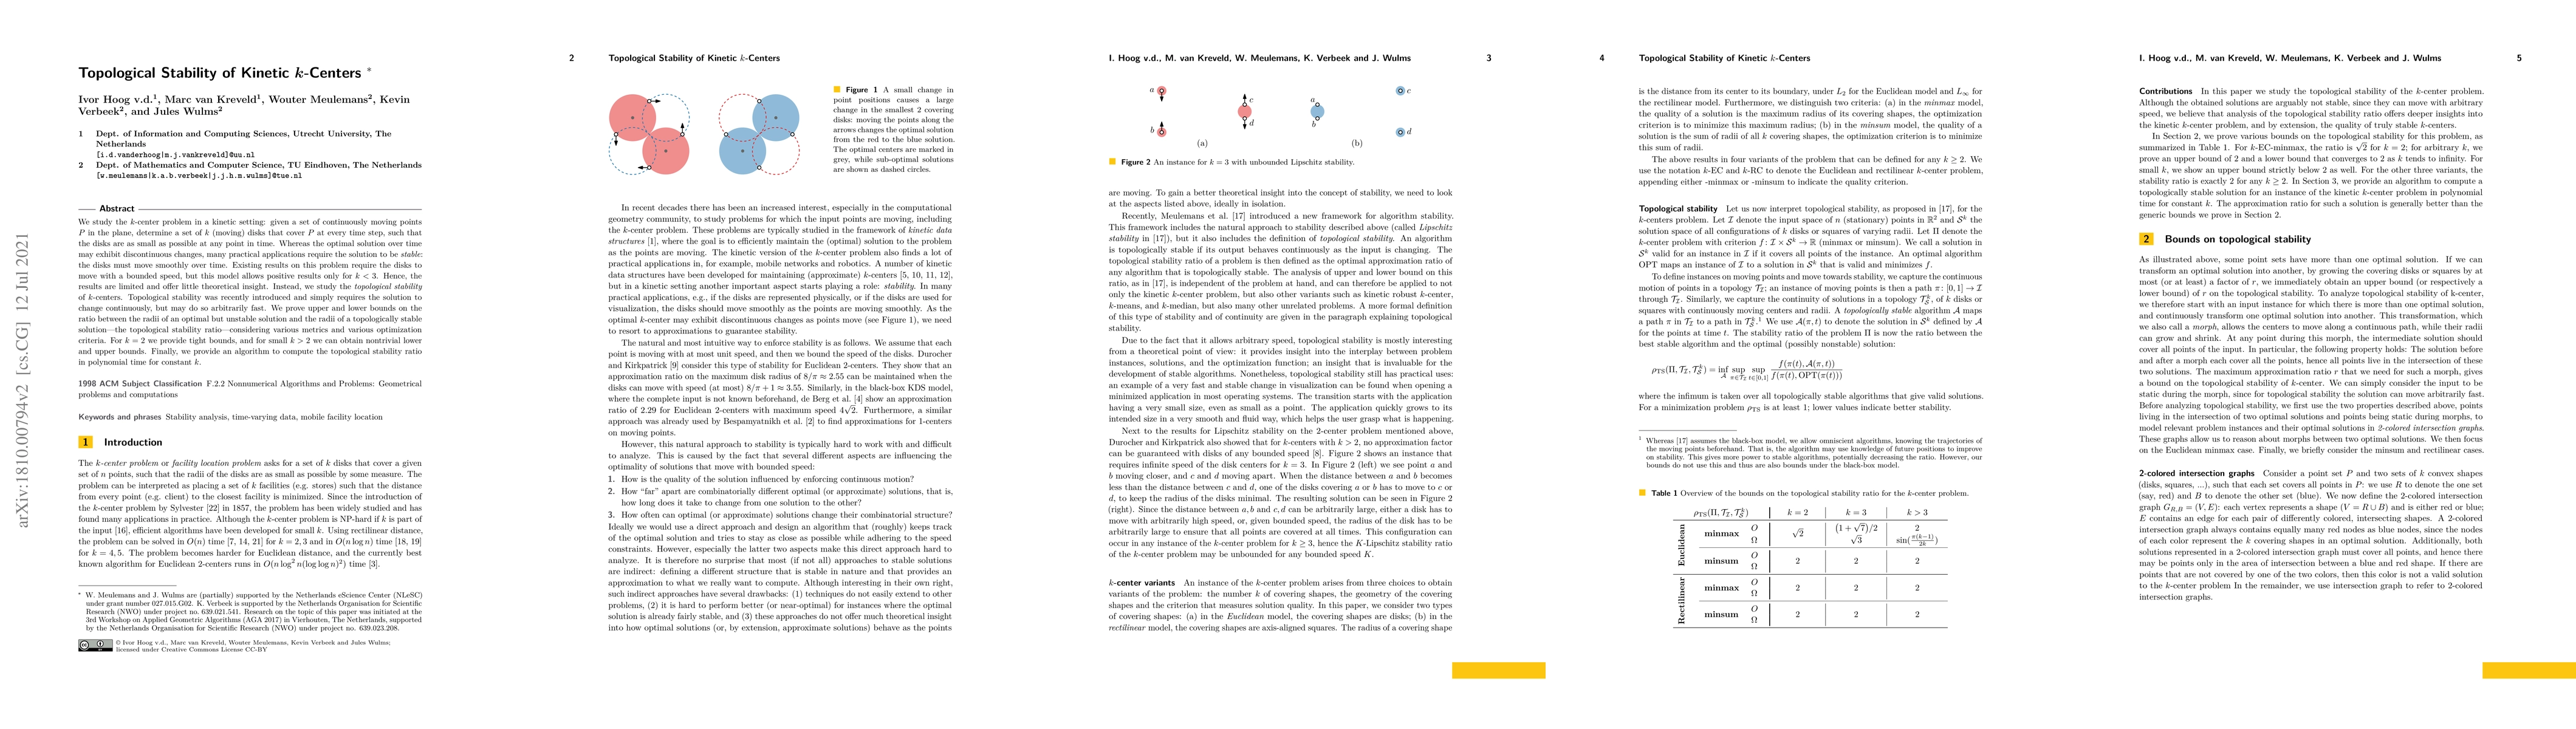
We study the $k$-center problem in a kinetic setting: given a set of continuously moving points $P$ in the plane, determine a set of $k$ (moving) disks that cover $P$ at every time step, such that t...
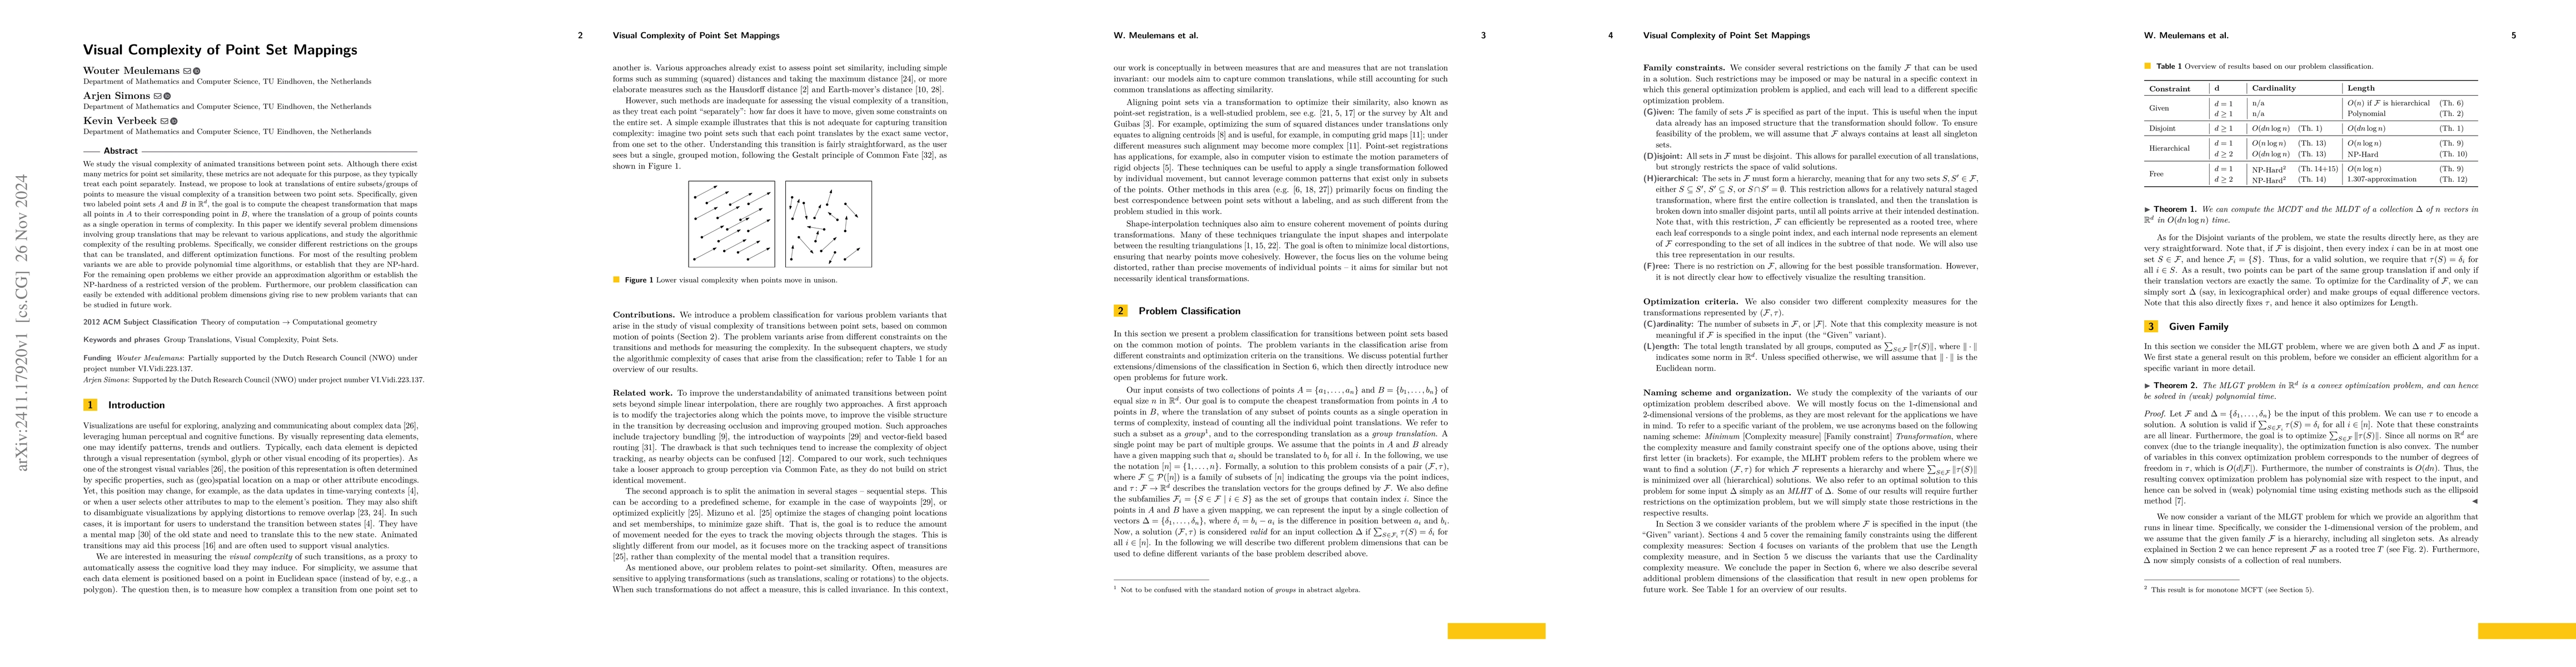
We study the visual complexity of animated transitions between point sets. Although there exist many metrics for point set similarity, these metrics are not adequate for this purpose, as they typicall...
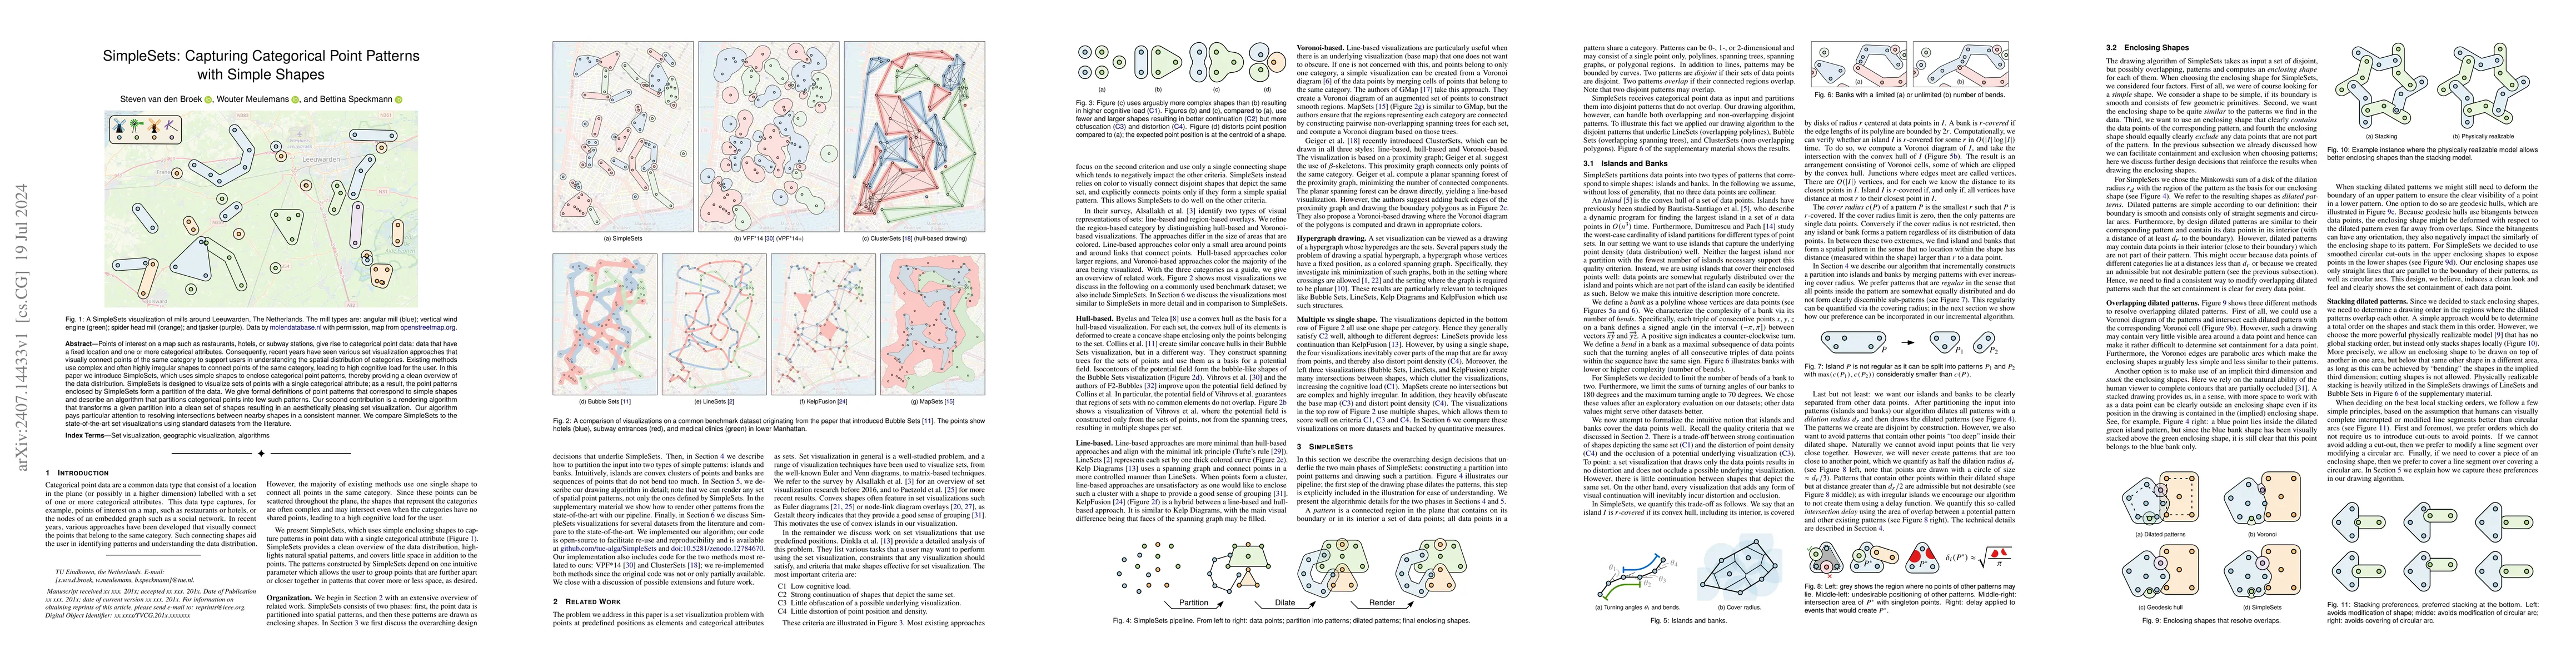
Points of interest on a map such as restaurants, hotels, or subway stations, give rise to categorical point data: data that have a fixed location and one or more categorical attributes. Consequently, ...
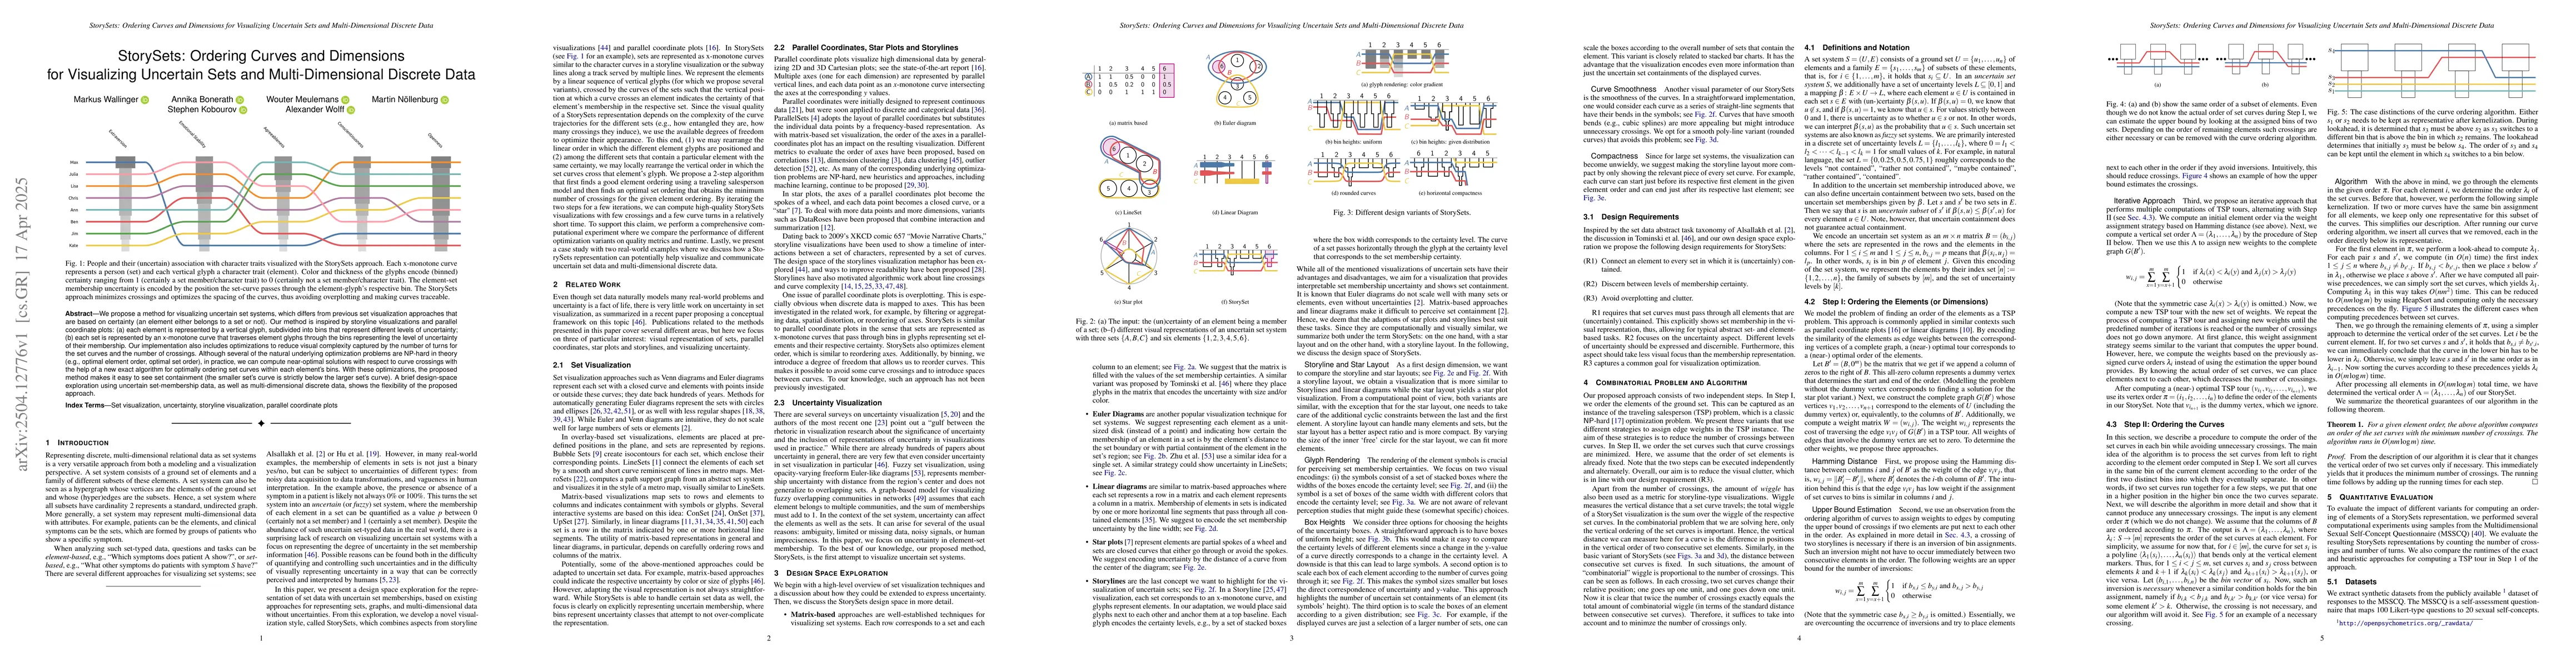
We propose a method for visualizing uncertain set systems, which differs from previous set visualization approaches that are based on certainty (an element either belongs to a set or not). Our method ...
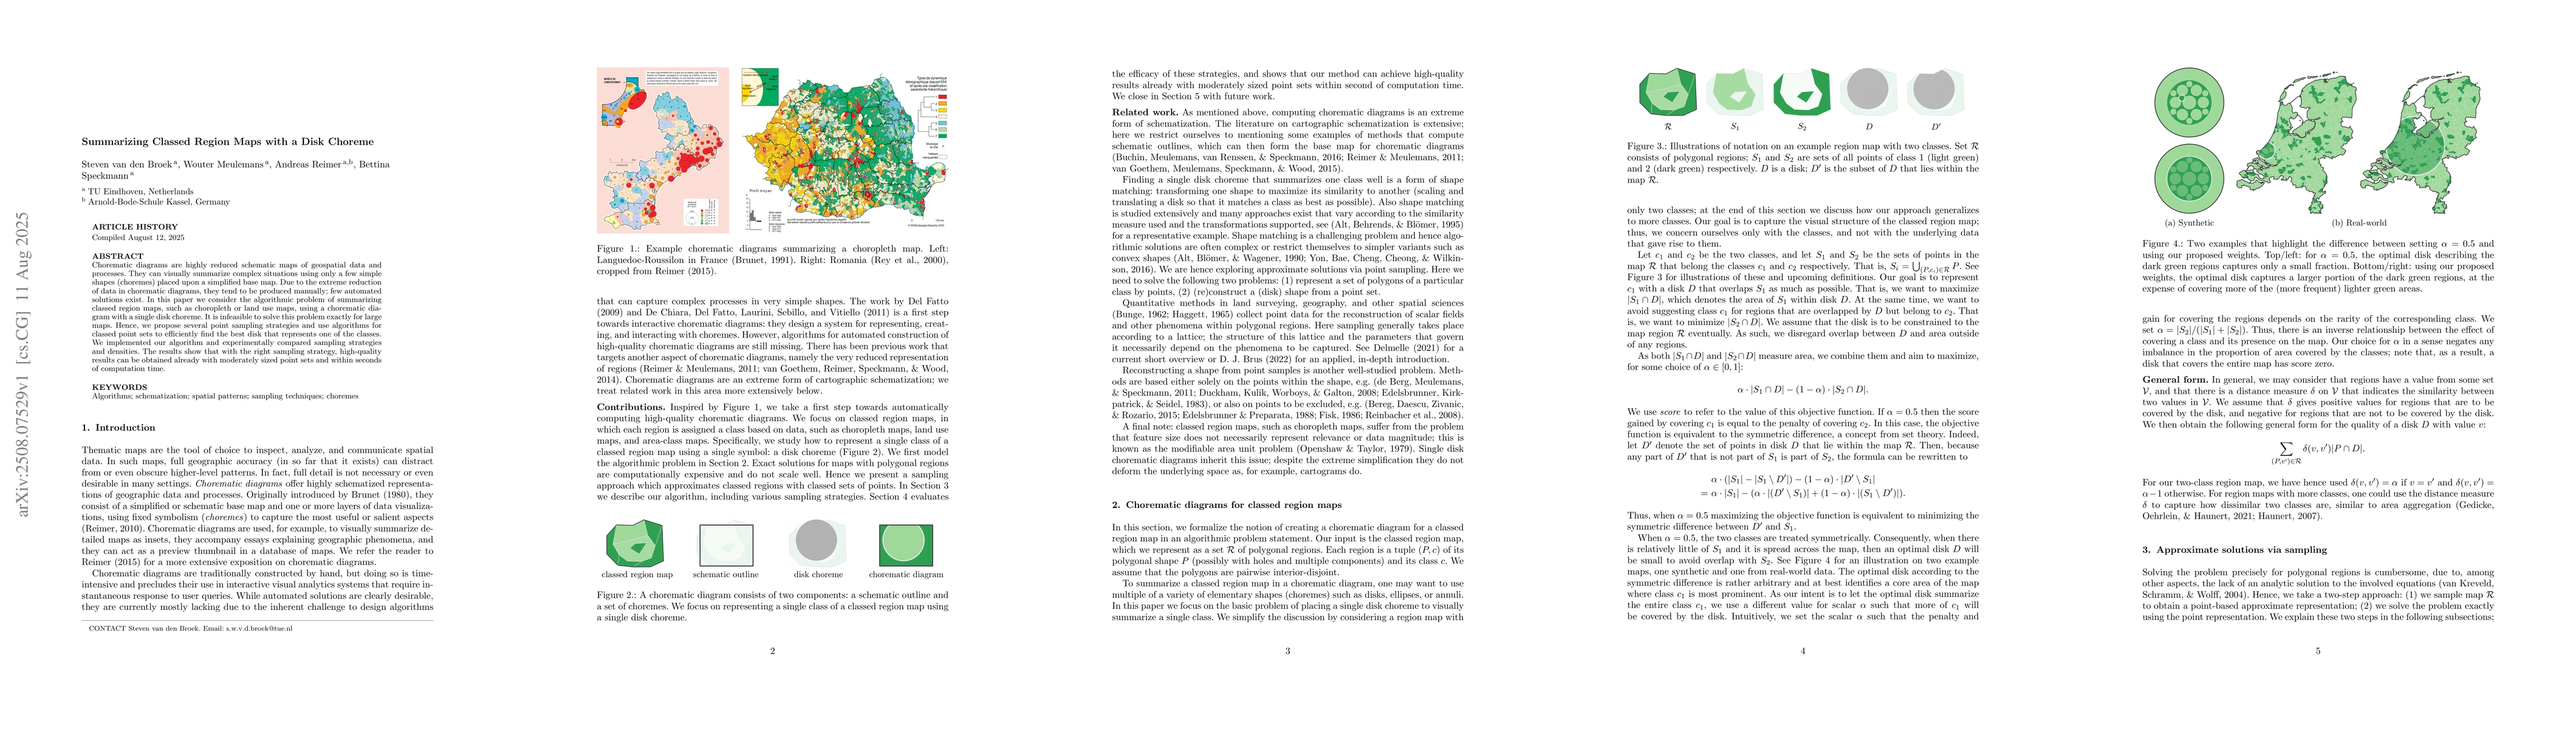
Chorematic diagrams are highly reduced schematic maps of geospatial data and processes. They can visually summarize complex situations using only a few simple shapes (choremes) placed upon a simplifie...
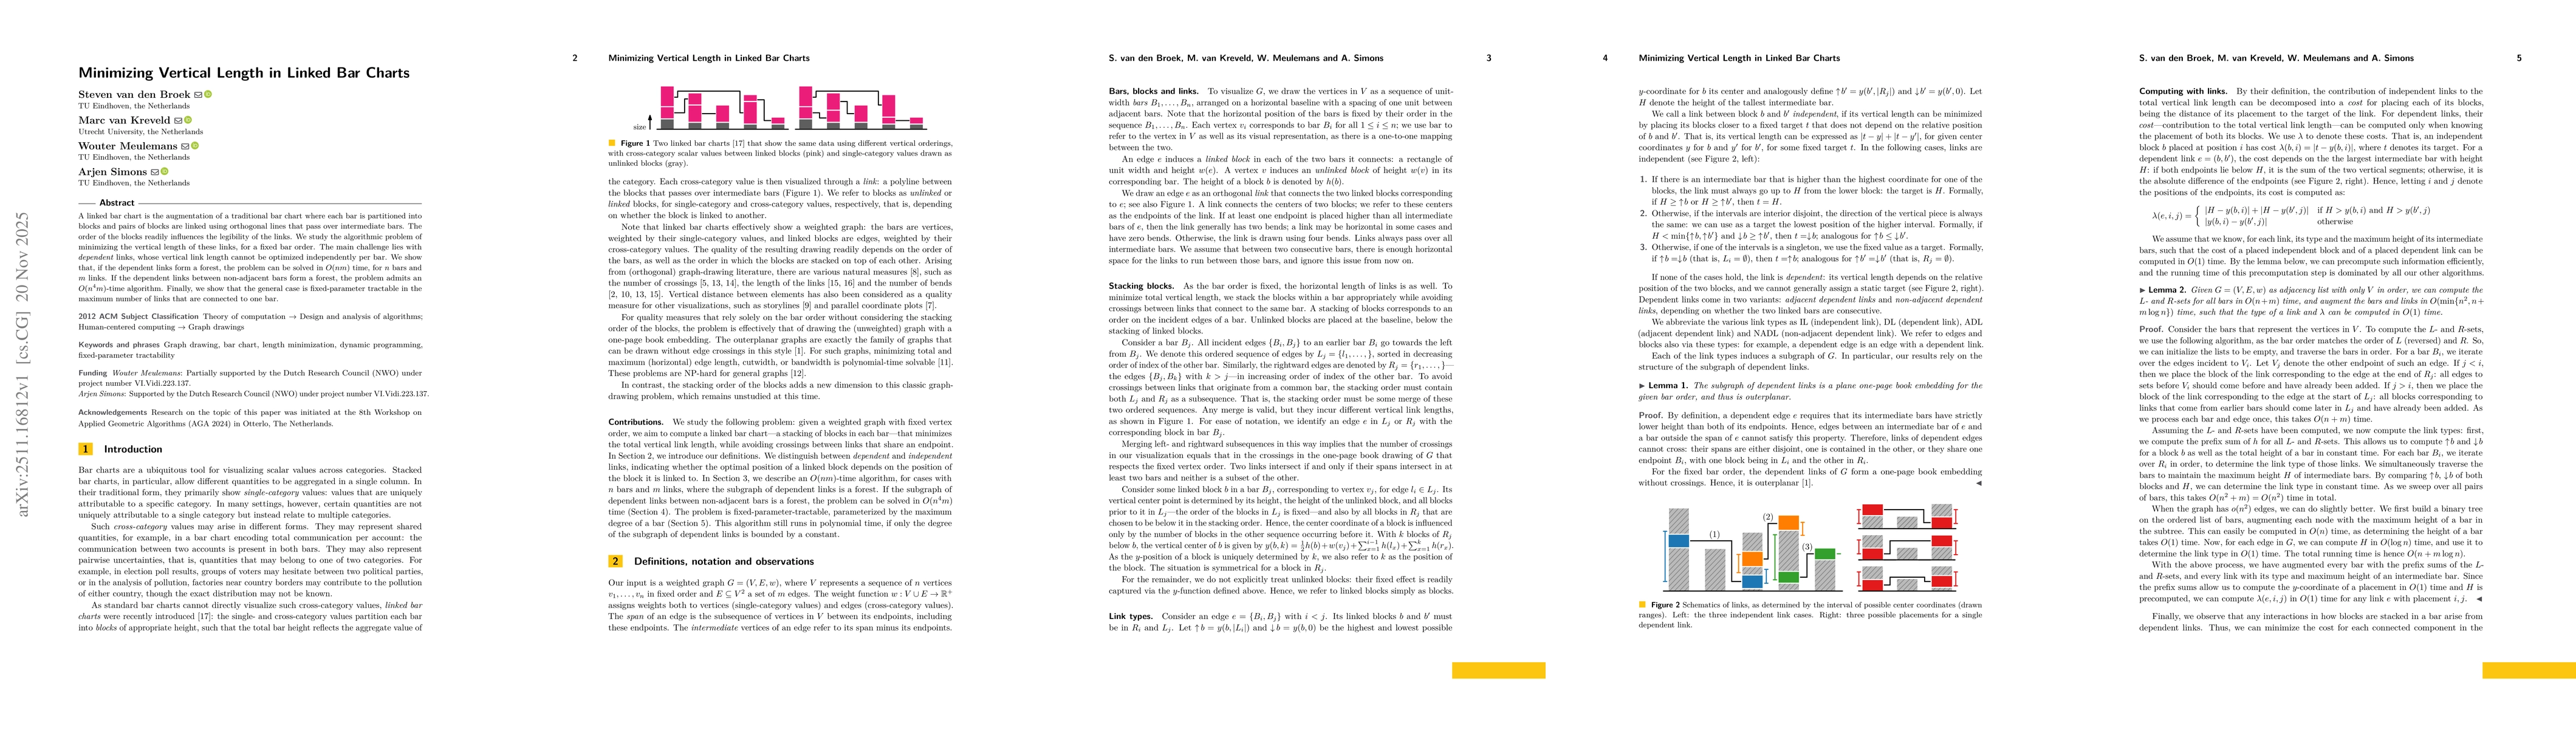
A linked bar chart is the augmentation of a traditional bar chart where each bar is partitioned into blocks and pairs of blocks are linked using orthogonal lines that pass over intermediate bars. The ...
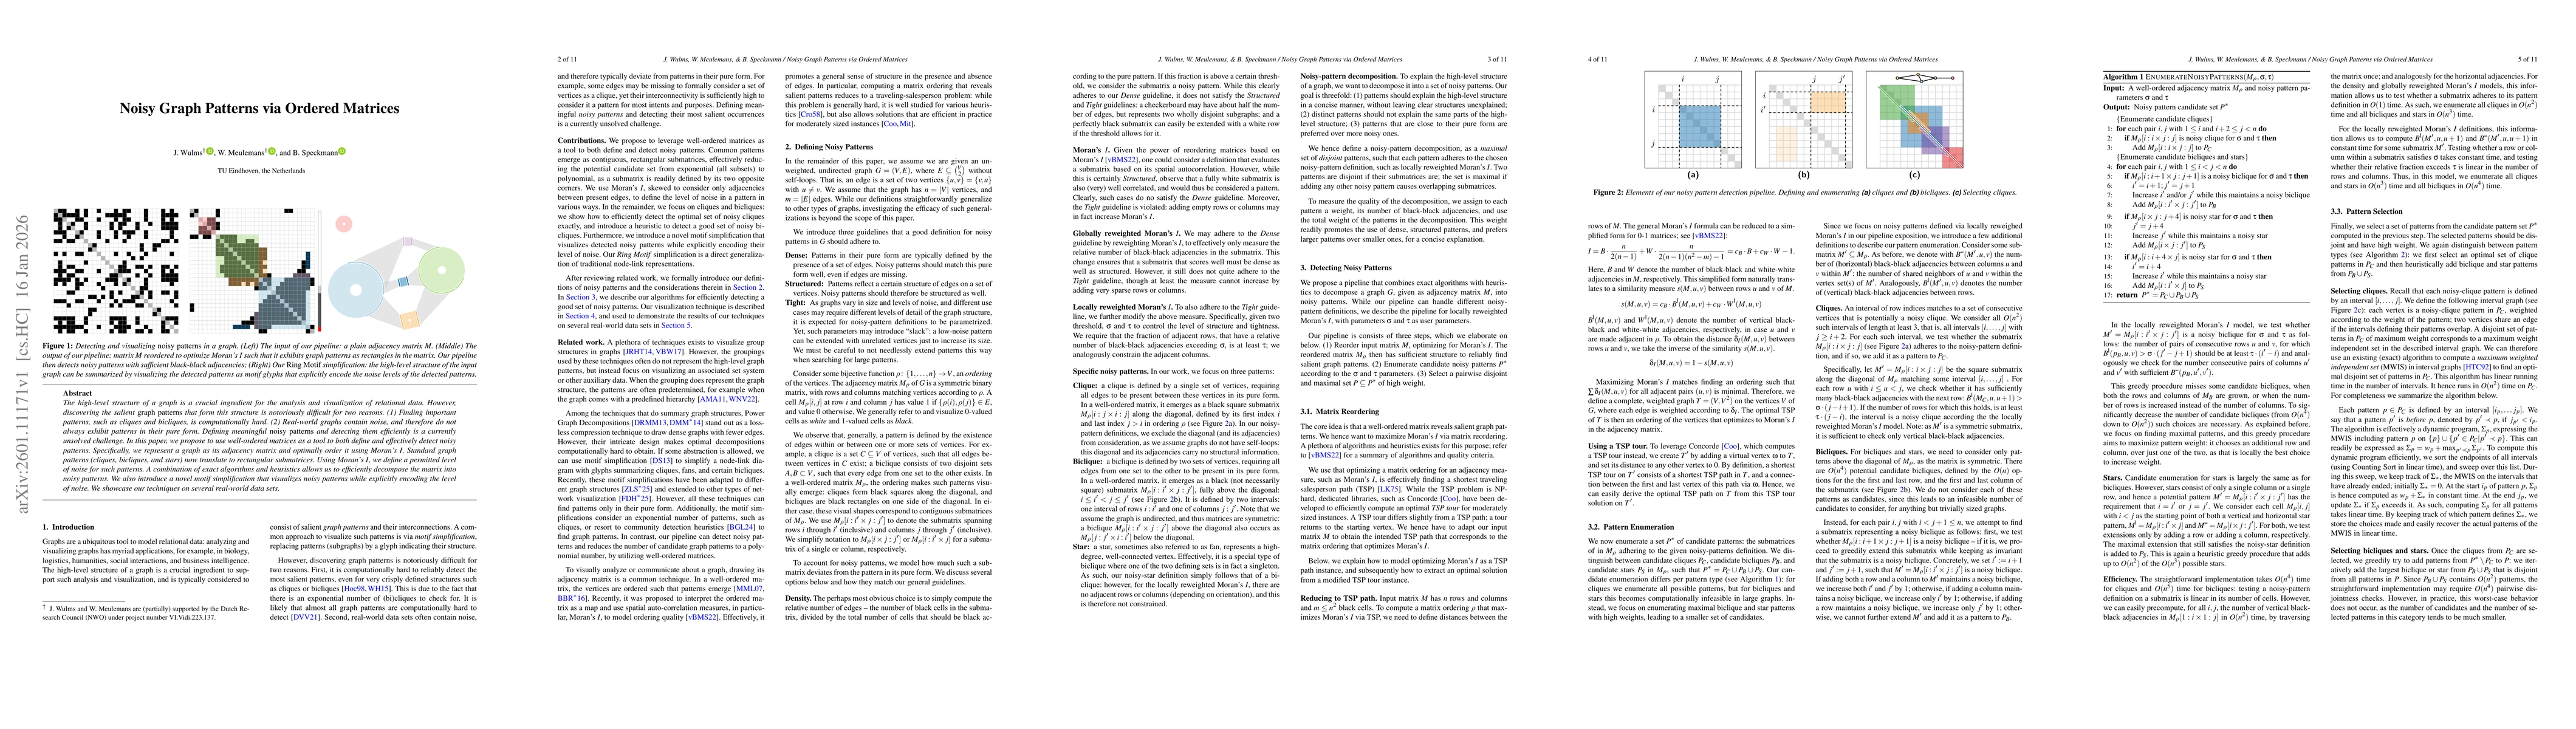
The high-level structure of a graph is a crucial ingredient for the analysis and visualization of relational data. However, discovering the salient graph patterns that form this structure is notorious...
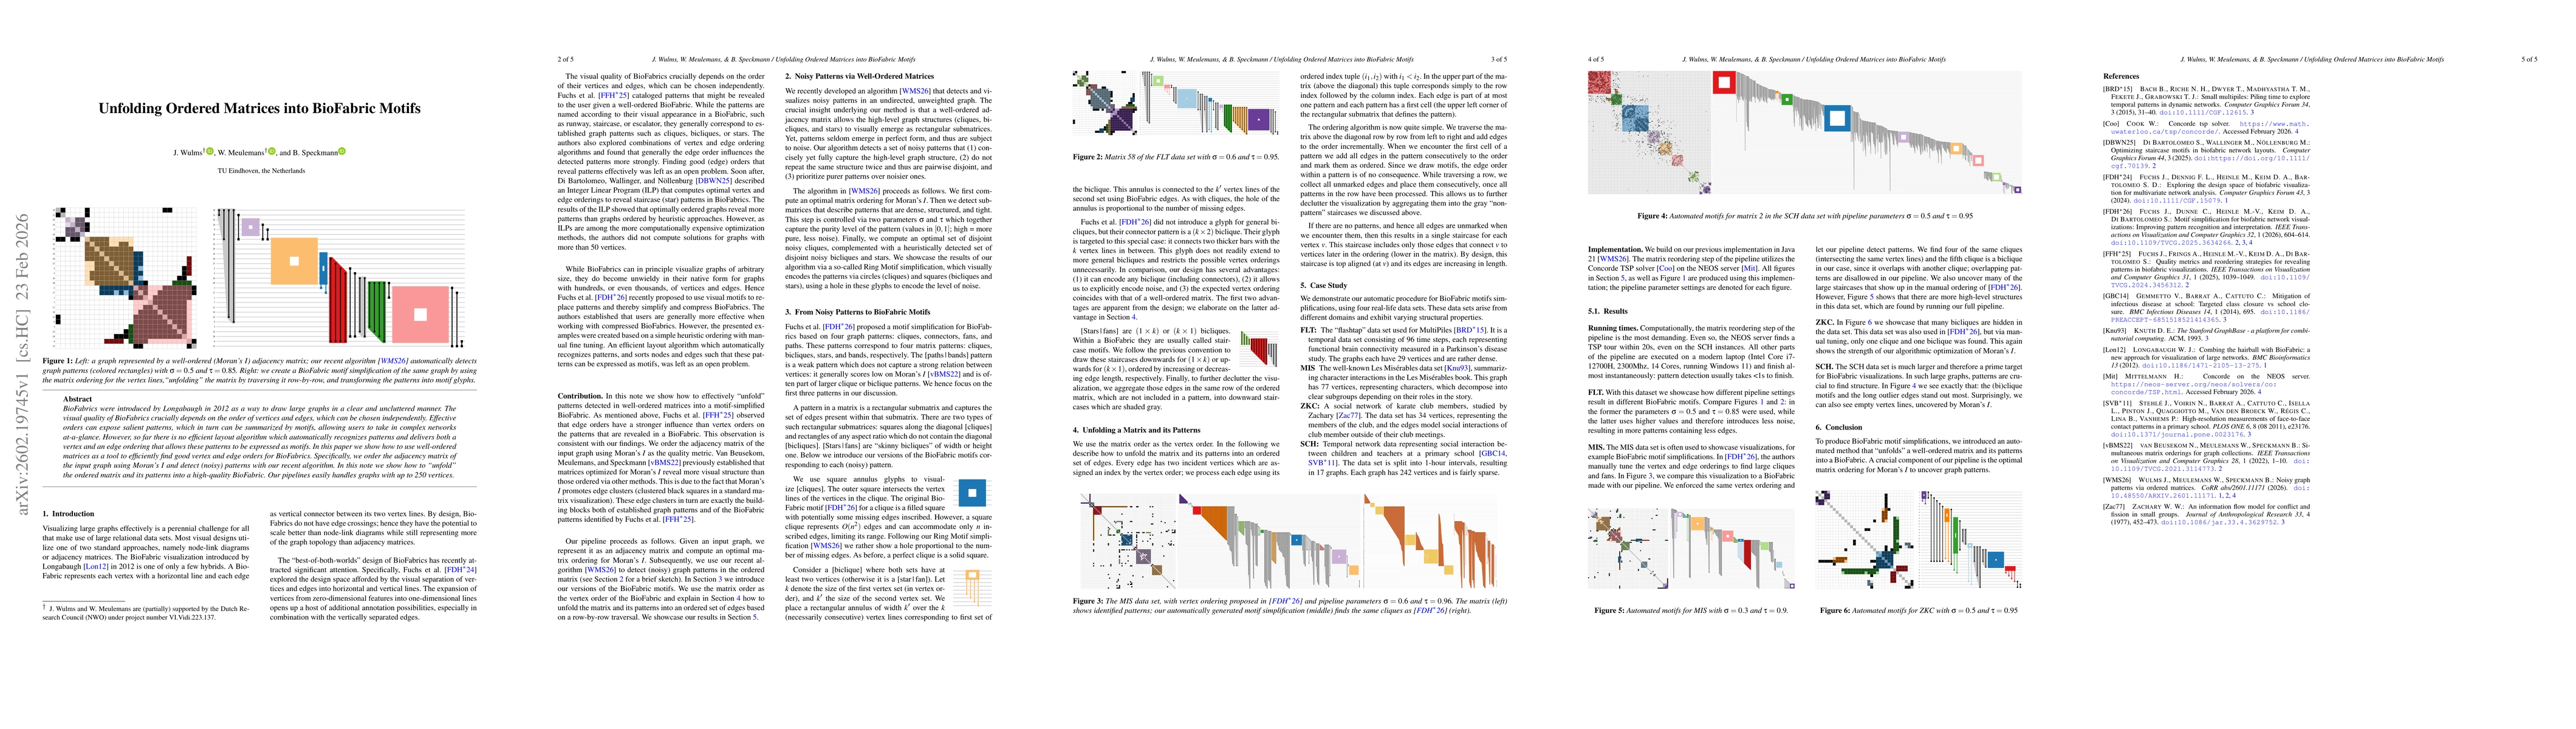
BioFabrics were introduced by Longabaugh in 2012 as a way to draw large graphs in a clear and uncluttered manner. The visual quality of BioFabrics crucially depends on the order of vertices and edges,...
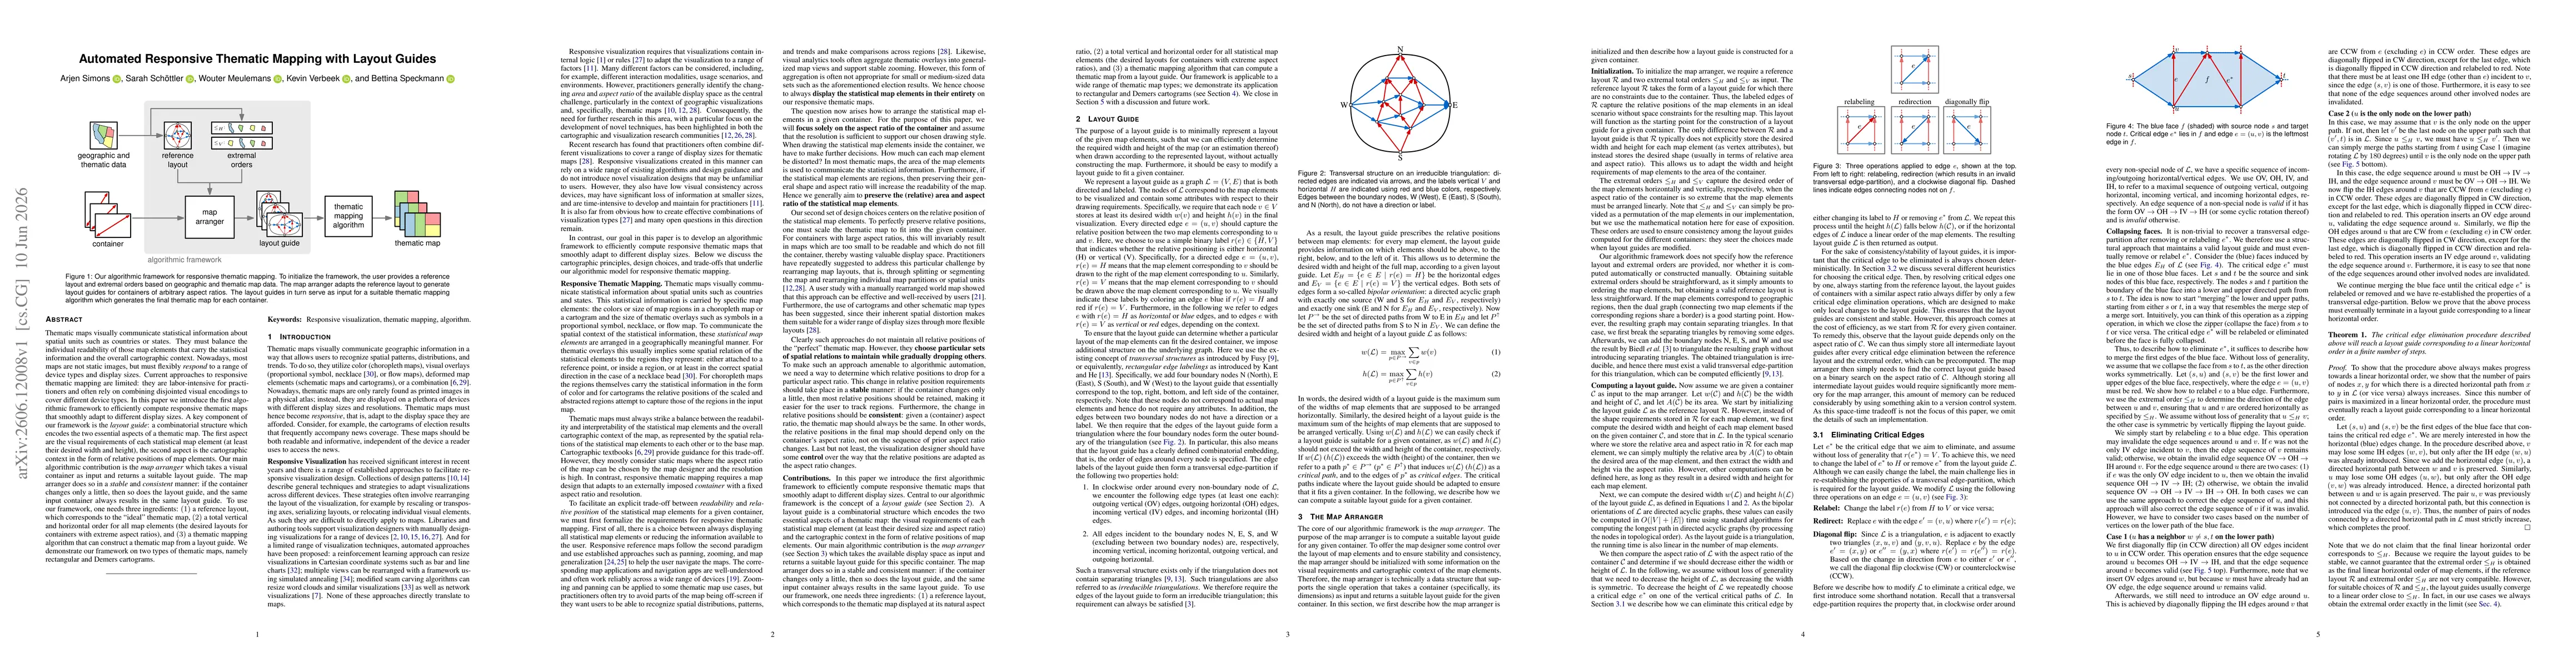
Thematic maps visually communicate statistical information about spatial units such as countries or states. They must balance the individual readability of those map elements that carry the statistica...