Summary
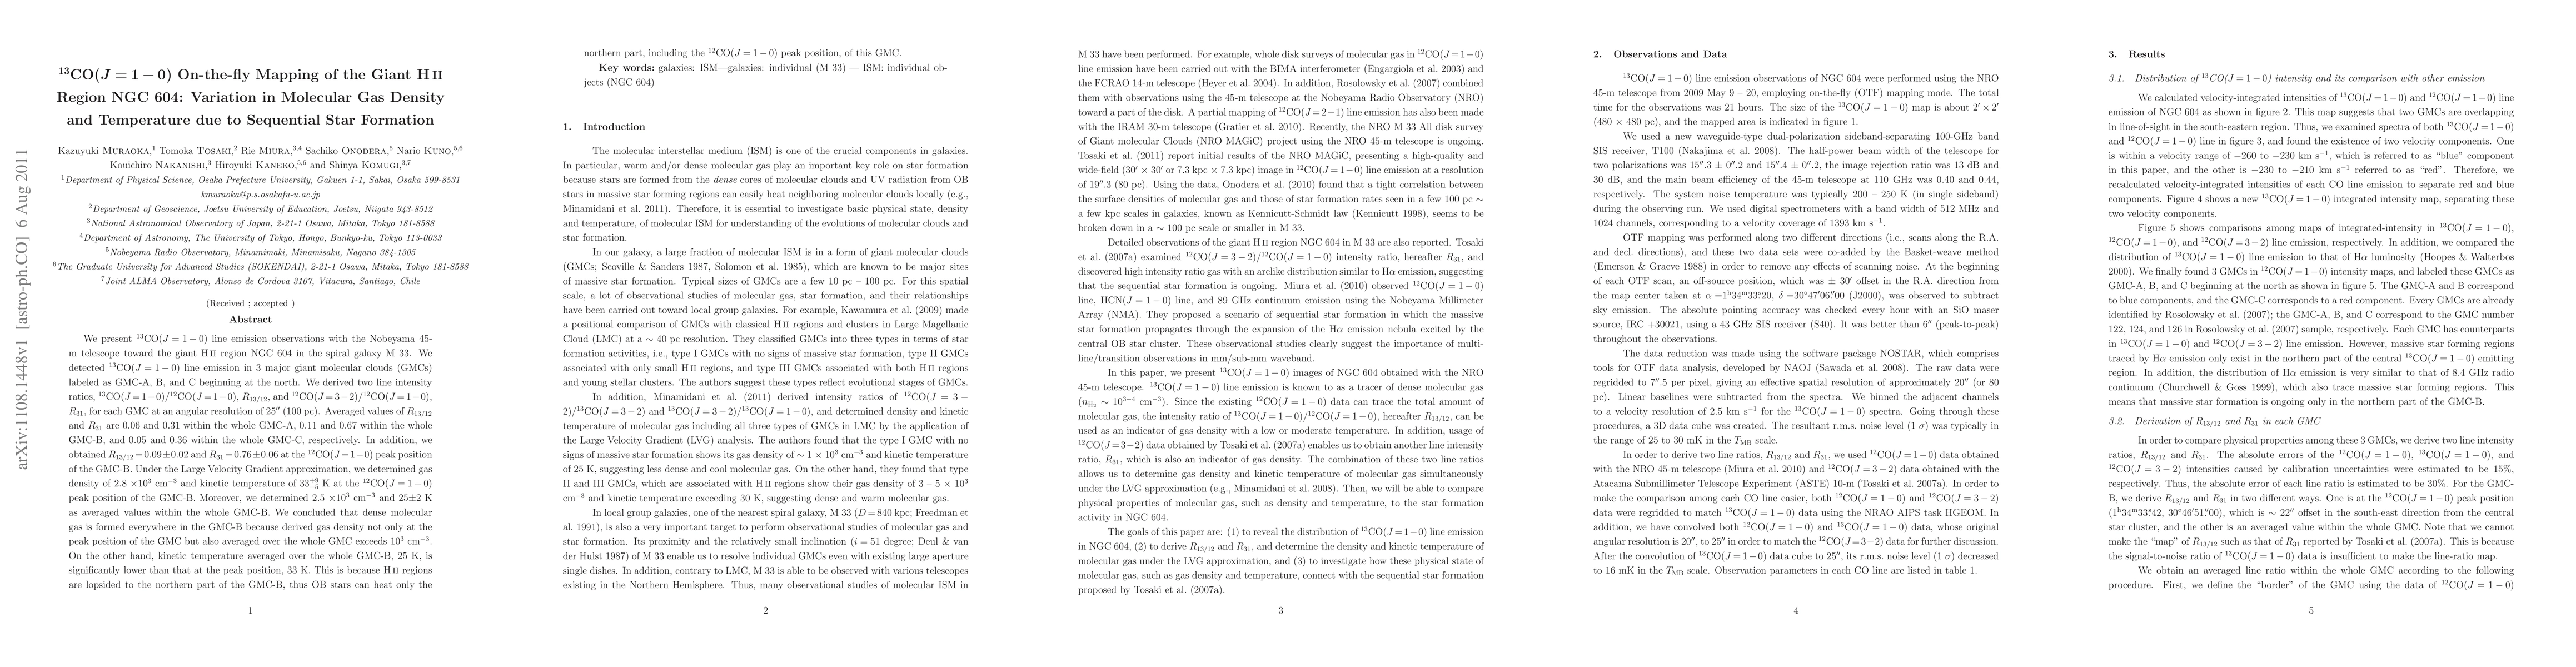
We present 13CO(J=1-0) line emission observations with the Nobeyama 45-m telescope toward the giant HII region NGC 604 in the spiral galaxy M 33. We detected 13CO(J=1-0) line emission in 3 major giant molecular clouds (GMCs) labeled as GMC-A, B, and C beginning at the north. We derived two line intensity ratios, 13CO(J=1-0)/12CO(J =1-0), R13/12, and 12CO(J=3-2)/12CO(J =1-0), R31, for each GMC at an angular resolution of 25" (100 pc). Averaged values of R13/12 and R31 are 0.06 and 0.31 within the whole GMC-A, 0.11 and 0.67 within the whole GMC-B, and 0.05 and 0.36 within the whole GMC-C, respectively. In addition, we obtained R13/12=0.09\pm0.02 and R31=0.76\pm0.06 at the 12CO(J=1-0) peak position of the GMC-B. Under the Large Velocity Gradient approximation, we determined gas density of 2.8 \times10^3 cm^-3 and kinetic temperature of 33+9-5 K at the 12CO(J=1-0) peak position of the GMC-B. Moreover, we determined 2.5 \times10^3 cm^-3 and 25\pm2 K as averaged values within the whole GMC-B. We concluded that dense molecular gas is formed everywhere in the GMC-B because derived gas density not only at the peak position of the GMC but also averaged over the whole GMC exceeds 10^3 cm^-3. On the other hand, kinetic temperature averaged over the whole GM-B, 25 K, is significantly lower than that at the peak position, 33 K. This is because HII regions are lopsided to the northern part of the GMC-B, thus OB stars can heat only the northern part, including the 12CO(J=1-0) peak position, of this GMC.
AI Key Findings
Get AI-generated insights about this paper's methodology, results, and significance.
Paper Details
PDF Preview
Key Terms
Citation Network
Current paper (gray), citations (green), references (blue)
Display is limited for performance on very large graphs.
Similar Papers
Found 4 papers| Title | Authors | Year | Actions |
|---|
Comments (0)