Publication
Metrics
AI Quick Summary
This paper introduces $\tt{SlicerAstro}$, an open-source tool for visualizing and analyzing 3-D HI spectral line imaging data, essential for processing upcoming large HI survey datasets. The tool extends 3DSlicer and offers features like 3-D filtering, selection, and comparative modeling.
Paper Preview
Abstract
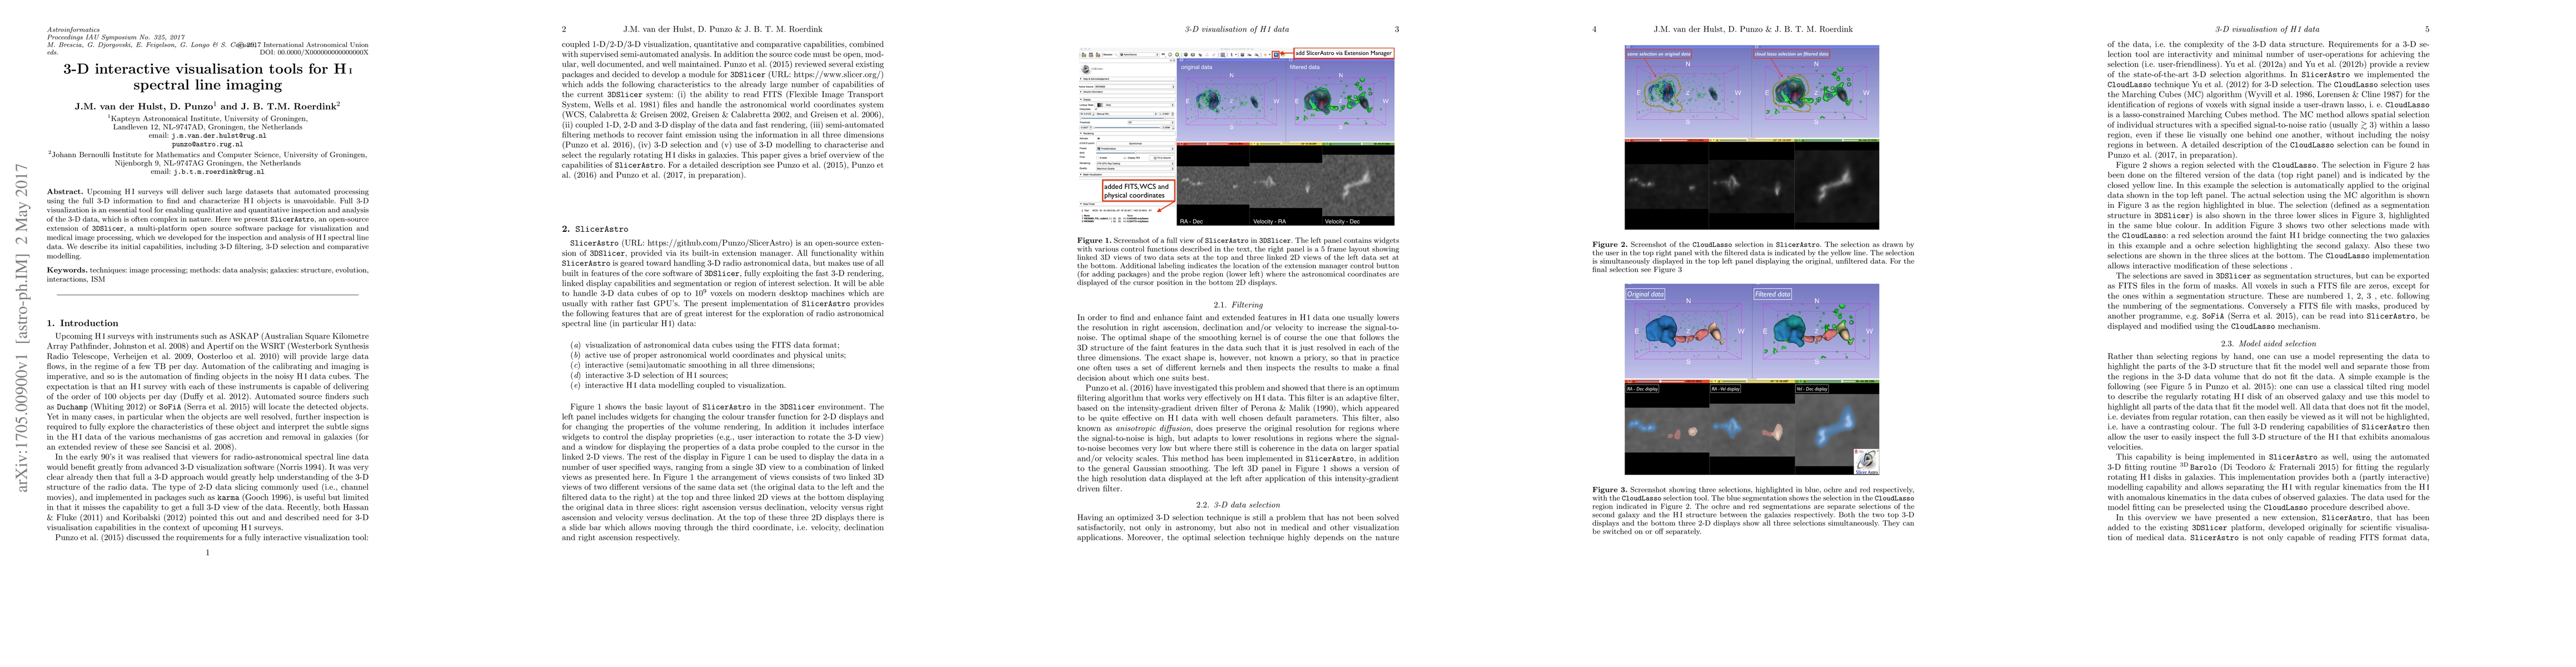
Upcoming HI surveys will deliver such large datasets that automated processing using the full 3-D information to find and characterize HI objects is unavoidable. Full 3-D visualization is an essential tool for enabling qualitative and quantitative inspection and analysis of the 3-D data, which is often complex in nature. Here we present $\tt{SlicerAstro}$, an open-source extension of 3DSlicer, a multi-platform open source software package for visualization and medical image processing, which we developed for the inspection and analysis of HI spectral line data. We describe its initial capabilities, including 3-D filtering, 3-D selection and comparative modelling.
AI Key Findings
Get AI-generated insights about this paper's methodology, results, significance, and more — seven facets brought into focus.
Impact
Paper Details
PDF Preview
Key Terms
Citation Network
Current paper (gray), citations (green), references (blue)
Display is limited for performance on very large graphs.
Discussion 0