Publication
Metrics
AI Quick Summary
This paper presents the first 3D radiative MHD simulations of starspots on G2V, K0V, and M0V stars, revealing that higher effective temperature stars exhibit larger temperature differences between spots and surrounding photospheres, and magnetic field strengths range from 3-4.5 kG, with M0V stars having higher field strengths.
Paper Preview
Abstract
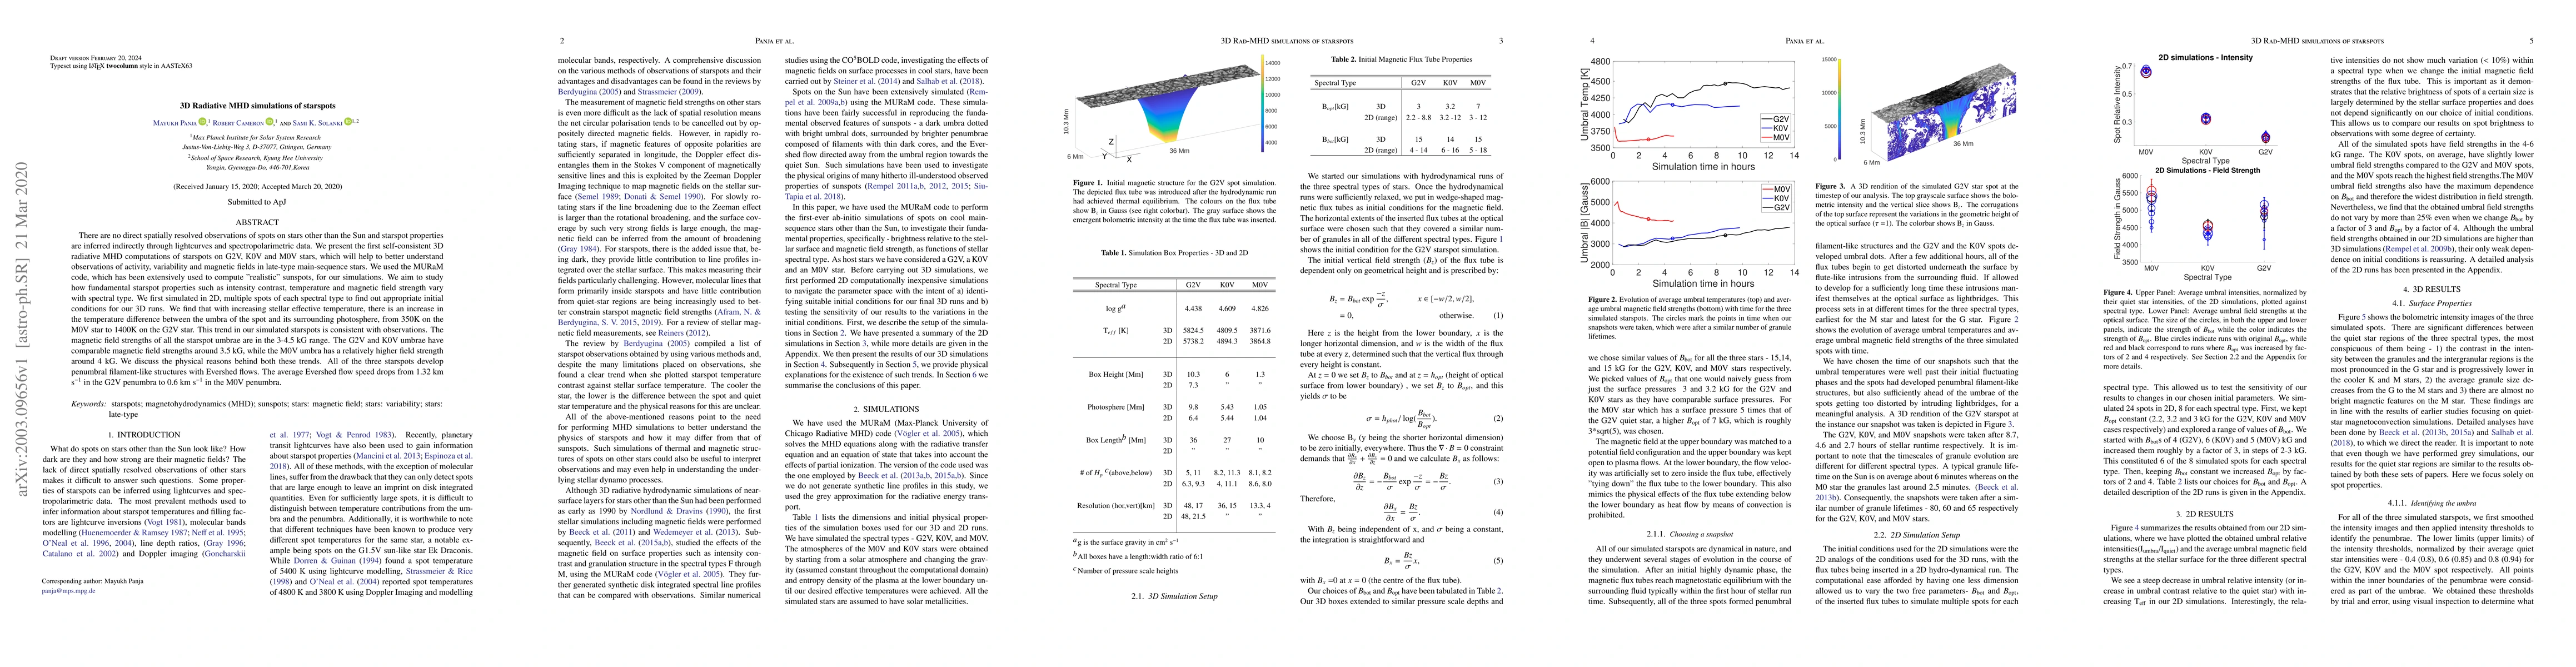
There are no direct spatially resolved observations of spots on stars other than the Sun and starspot properties are inferred indirectly through lightcurves and spectropolarimetric data. We present the first self-consistent 3D radiative MHD computations of starspots on G2V, K0V and M0V stars, which will help to better understand observations of activity, variability and magnetic fields in late-type main-sequence stars. We used the MURaM code, which has been extensively used to compute "realistic" sunspots, for our simulations. We aim to study how fundamental starspot properties such as intensity contrast, temperature and magnetic field strength vary with spectral type. We first simulated in 2D, multiple spots of each spectral type to find out appropriate initial conditions for our 3D runs. We find that with increasing stellar effective temperature, there is an increase in the temperature difference between the umbra of the spot and its surrounding photosphere, from 350K on the M0V star to 1400K on the G2V star. This trend in our simulated starspots is consistent with observations. The magnetic field strengths of all the starspot umbrae are in the 3-4.5 kG range. The G2V and K0V umbrae have comparable magnetic field strengths around 3.5 kG, while the M0V umbra has a relatively higher field strength around 4 kG. We discuss the physical reasons behind both these trends. All of the three starspots develop penumbral filament-like structures with Evershed flows. The average Evershed flow speed drops from 1.32 km s$^{-1}$ in the G2V penumbra to 0.6 km s$^{-1}$ in the M0V penumbra.
AI Key Findings
Get AI-generated insights about this paper's methodology, results, significance, and more — seven facets brought into focus.
Impact
Paper Details
Authors
PDF Preview
Key Terms
Citation Network
Current paper (gray), citations (green), references (blue)
Display is limited for performance on very large graphs.
Discussion 0