3D seismic data denoising using two-dimensional sparse coding scheme
Publication
Metrics
AI Quick Summary
This paper proposes a seismic data denoising method using a two-dimensional sparse coding scheme based on learning-type overcomplete dictionaries. The method employs tensor-linear combinations and an alternating minimization algorithm to achieve optimal sparse representation, demonstrating reduced computational costs and improved signal-to-noise ratio in experiments.
Paper Preview
Abstract
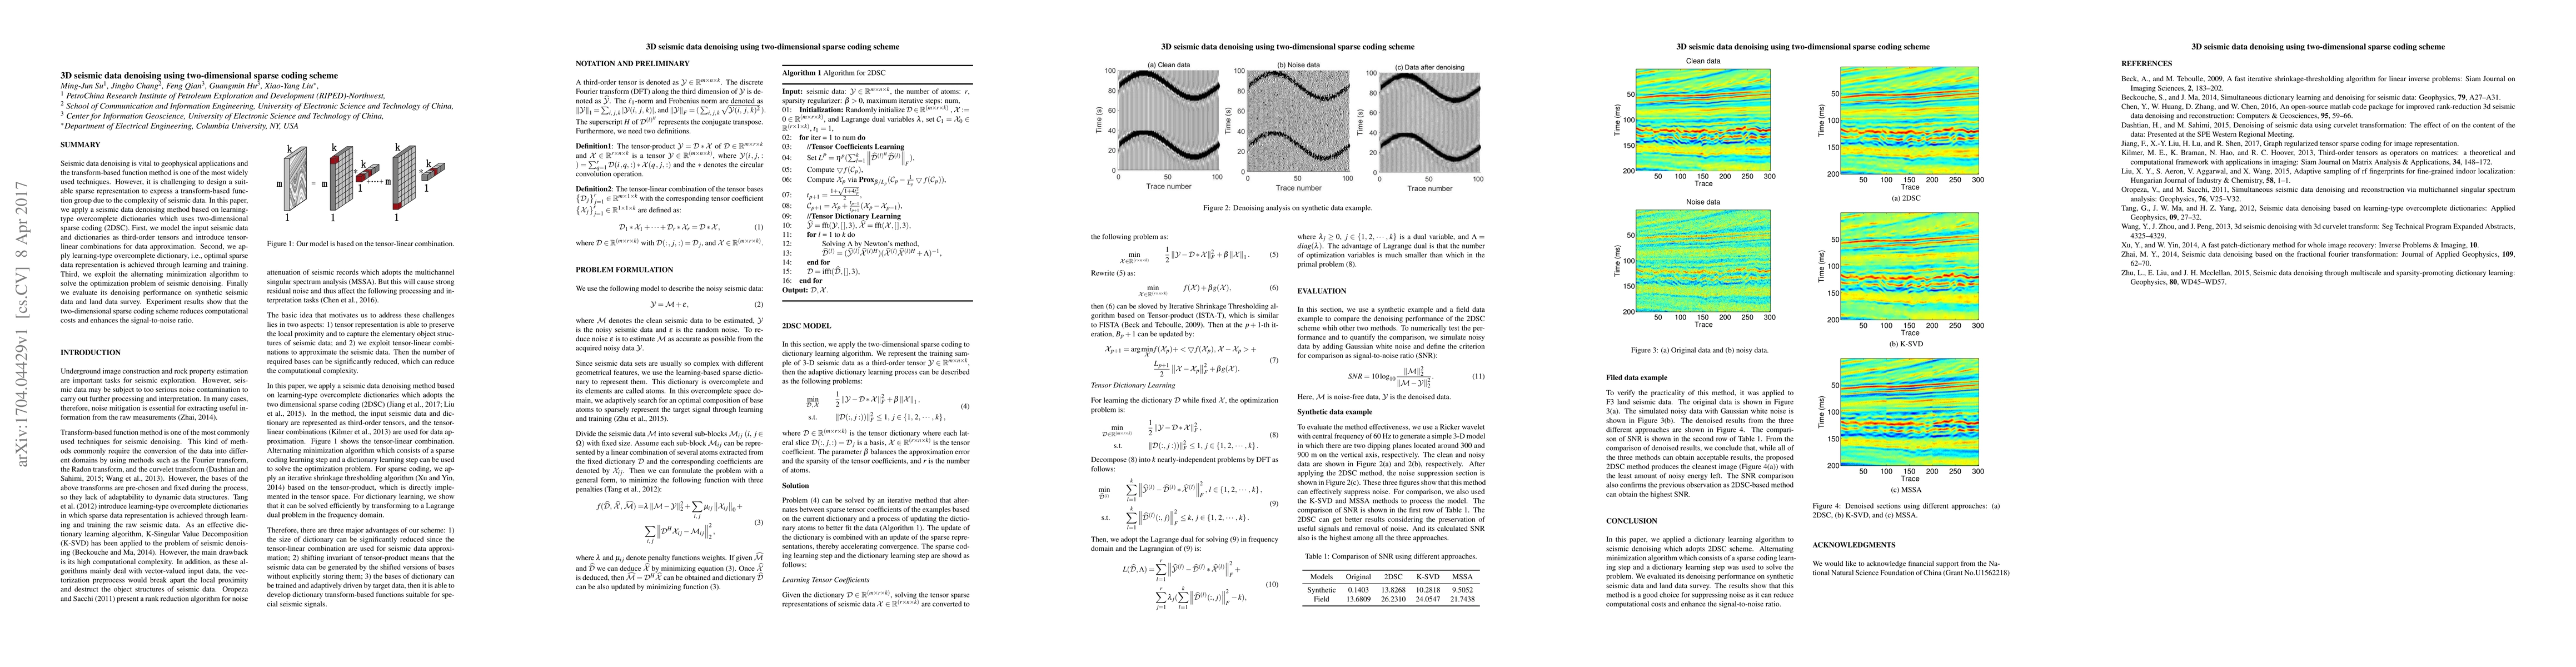
Seismic data denoising is vital to geophysical applications and the transform-based function method is one of the most widely used techniques. However, it is challenging to design a suit- able sparse representation to express a transform-based func- tion group due to the complexity of seismic data. In this paper, we apply a seismic data denoising method based on learning- type overcomplete dictionaries which uses two-dimensional sparse coding (2DSC). First, we model the input seismic data and dictionaries as third-order tensors and introduce tensor- linear combinations for data approximation. Second, we ap- ply learning-type overcomplete dictionary, i.e., optimal sparse data representation is achieved through learning and training. Third, we exploit the alternating minimization algorithm to solve the optimization problem of seismic denoising. Finally we evaluate its denoising performance on synthetic seismic data and land data survey. Experiment results show that the two-dimensional sparse coding scheme reduces computational costs and enhances the signal-to-noise ratio.
AI Key Findings
Get AI-generated insights about this paper's methodology, results, significance, and more — seven facets brought into focus.
Impact
Paper Details
PDF Preview
Key Terms
Citation Network
Current paper (gray), citations (green), references (blue)
Display is limited for performance on very large graphs.
Discussion 0