Authors
Summary
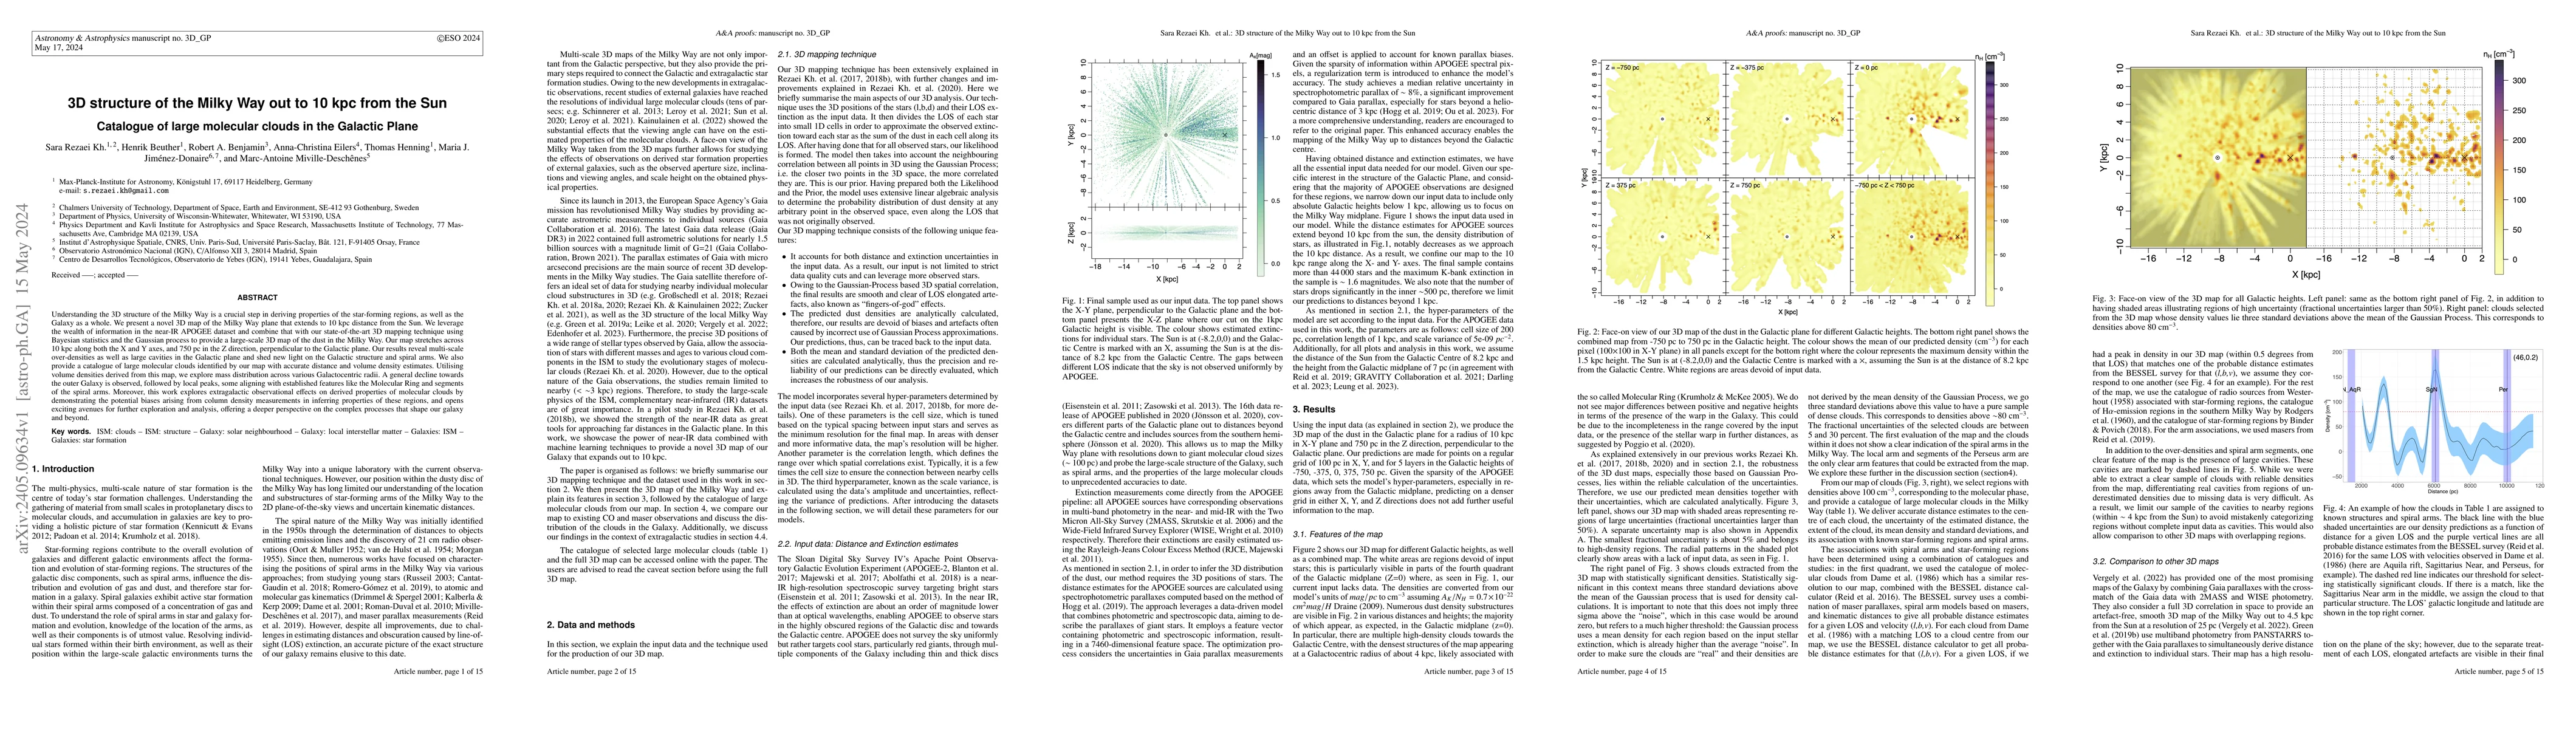
Understanding the 3D structure of the Milky Way is a crucial step in deriving properties of the star-forming regions, as well as the Galaxy as a whole. We present a novel 3D map of the Milky Way plane that extends to 10 kpc distance from the Sun. We leverage the wealth of information in the near-IR APOGEE dataset and combine that with our state-of-the-art 3D mapping technique using Bayesian statistics and the Gaussian process to provide a large-scale 3D map of the dust in the Milky Way. Our map stretches across 10 kpc along both the X and Y axes, and 750 pc in the Z direction, perpendicular to the Galactic plane. Our results reveal multi-scale over-densities as well as large cavities in the Galactic plane and shed new light on the Galactic structure and spiral arms. We also provide a catalogue of large molecular clouds identified by our map with accurate distance and volume density estimates. Utilising volume densities derived from this map, we explore mass distribution across various Galactocentric radii. A general decline towards the outer Galaxy is observed, followed by local peaks, some aligning with established features like the Molecular Ring and segments of the spiral arms. Moreover, this work explores extragalactic observational effects on derived properties of molecular clouds by demonstrating the potential biases arising from column density measurements in inferring properties of these regions, and opens exciting avenues for further exploration and analysis, offering a deeper perspective on the complex processes that shape our galaxy and beyond.
AI Key Findings
Get AI-generated insights about this paper's methodology, results, and significance.
Paper Details
PDF Preview
Key Terms
Citation Network
Current paper (gray), citations (green), references (blue)
Display is limited for performance on very large graphs.
Similar Papers
Found 4 papersDark matter in the Milky Way: Measurements up to 3 kpc from the Galactic plane above the Sun
O. Bienaymé, A. C. Robin, J. -B. Salomon et al.
Bird's eye view of molecular clouds in the Milky Way: II. Cloud kinematics from sub-pc to kpc scales
Jan Orkisz, Jouni Kainulainen, Andri Spilker
A parsec-scale Galactic 3D dust map out to 1.25 kpc from the Sun
Joshua S. Speagle, Gordian Edenhofer, Philipp Frank et al.
No citations found for this paper.
Comments (0)