6DVF: Data Visualisation Framework for mHealth Apps
Publication
Metrics
AI Quick Summary
The 6DVF framework aims to enhance data visualisations for mHealth apps by addressing the needs of non-expert users, the nature of represented data, and mobile environments. Initial findings from a designer evaluation show promising results in improving visualisation design.
Paper Preview
Abstract
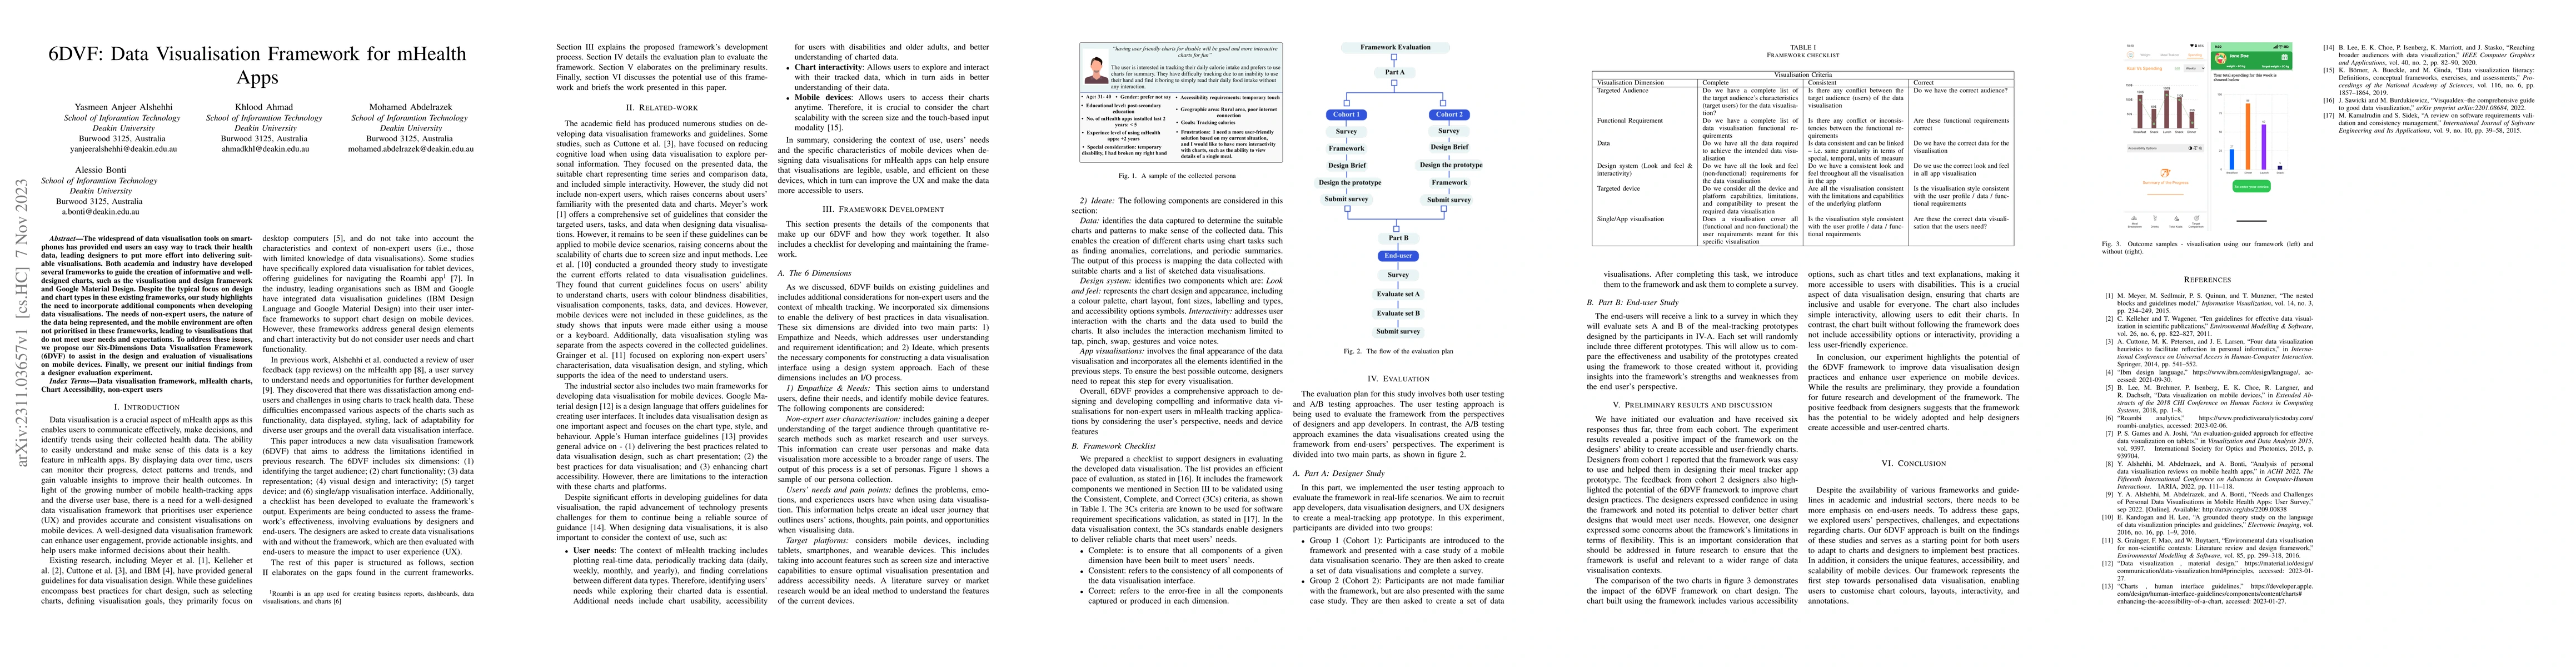
The widespread of data visualisation tools on smartphones has provided end users an easy way to track their health data, leading designers to put more effort into delivering suitable visualisations. Both academia and industry have developed several frameworks to guide the creation of informative and well-designed charts, such as the visualisation and design framework and Google Material Design. Despite the typical focus on design and chart types in these existing frameworks, our study highlights the need to incorporate additional components when developing data visualisations. The needs of non-expert users, the nature of the data being represented, and the mobile environment are often not prioritised in these frameworks, leading to visualisations that do not meet user needs and expectations. To address these issues, we propose our Six-Dimensions Data Visualisation Framework (6DVF) to assist in the design and evaluation of visualisations on mobile devices. Finally, we present our initial findings from a designer evaluation experiment.
AI Key Findings
Get AI-generated insights about this paper's methodology, results, significance, and more — seven facets brought into focus.
Impact
Paper Details
Authors
PDF Preview
Key Terms
Citation Network
Current paper (gray), citations (green), references (blue)
Display is limited for performance on very large graphs.
Discussion 0