A Bayesian modelling framework to quantify multiple sources of spatial variation for disease mapping
Publication
Metrics
AI Quick Summary
This paper proposes a Bayesian modelling framework using penalised smoothing splines to create flexible, non-stationary spatial surfaces for disease mapping, allowing for multiple sources of spatial variation without pre-defined spatial structures. The approach performs competitively with existing methods and enables exploration of various connectivity measures.
Paper Preview
Abstract
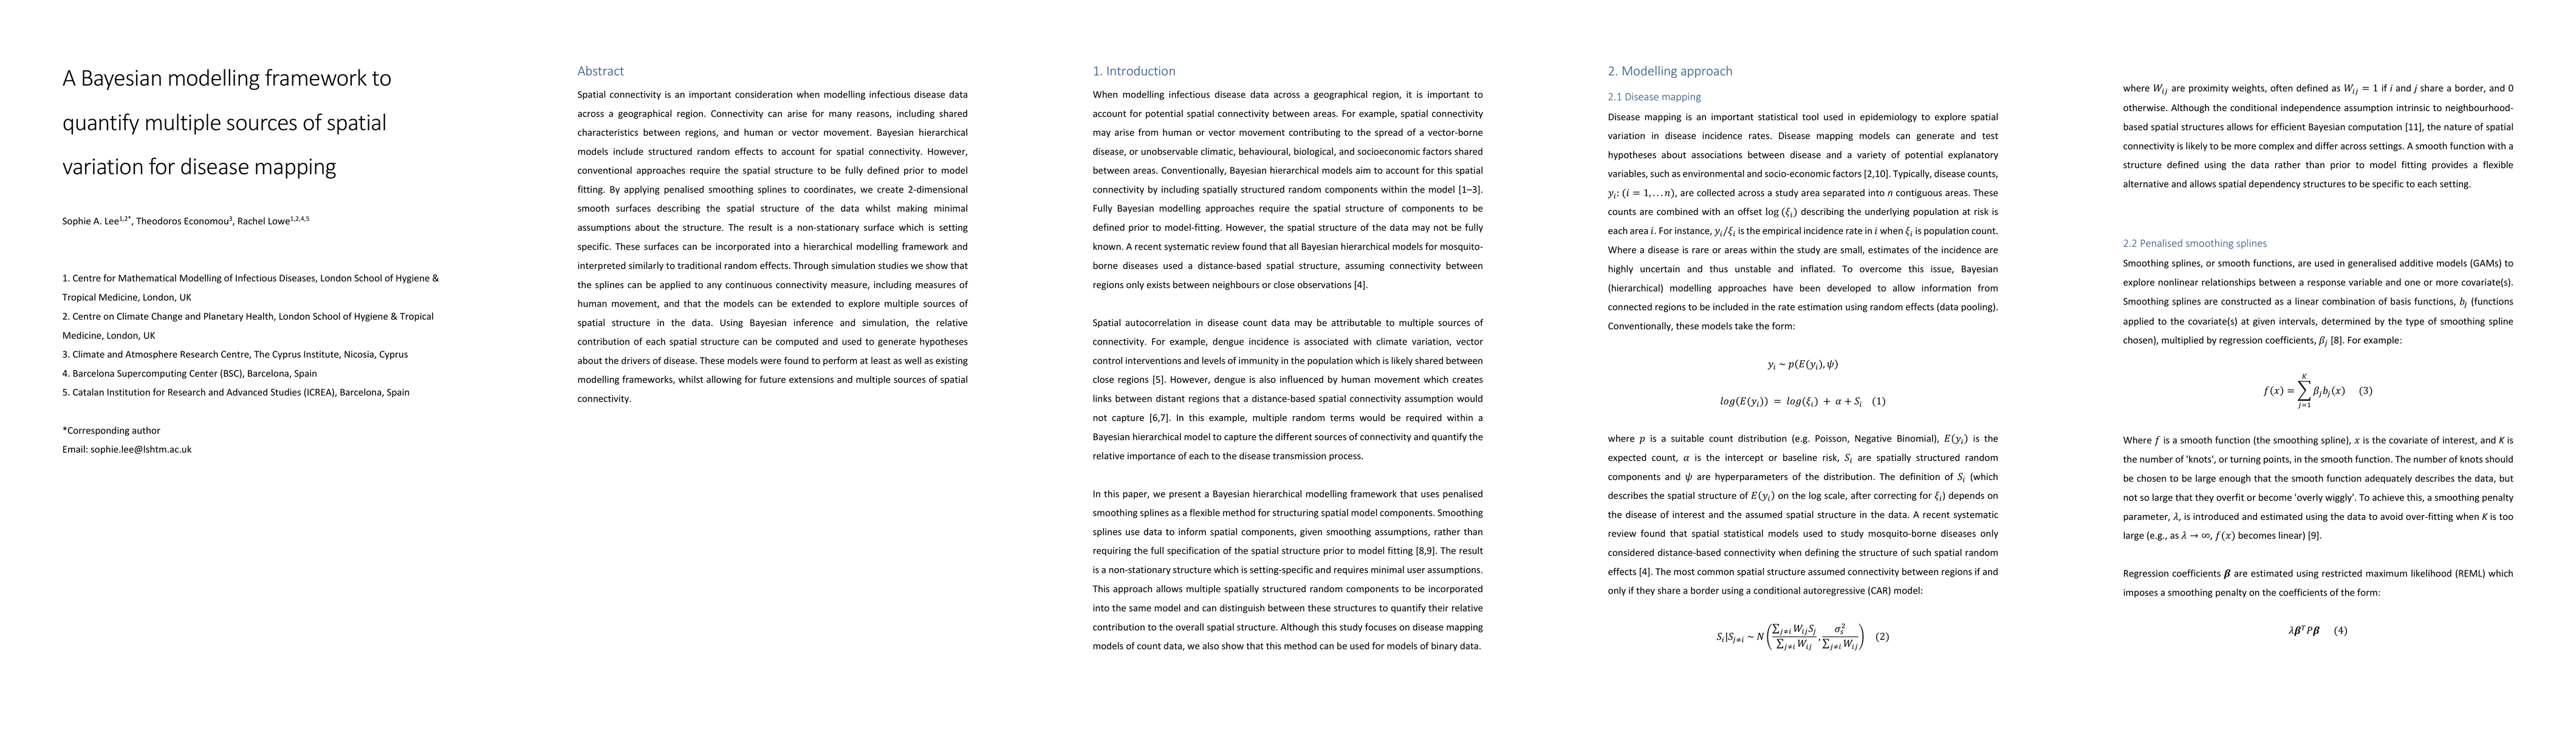
Spatial connectivity is an important consideration when modelling infectious disease data across a geographical region. Connectivity can arise for many reasons, including shared characteristics between regions, and human or vector movement. Bayesian hierarchical models include structured random effects to account for spatial connectivity. However, conventional approaches require the spatial structure to be fully defined prior to model fitting. By applying penalised smoothing splines to coordinates, we create 2-dimensional smooth surfaces describing the spatial structure of the data whilst making minimal assumptions about the structure. The result is a non-stationary surface which is setting specific. These surfaces can be incorporated into a hierarchical modelling framework and interpreted similarly to traditional random effects. Through simulation studies we show that the splines can be applied to any continuous connectivity measure, including measures of human movement, and that the models can be extended to explore multiple sources of spatial structure in the data. Using Bayesian inference and simulation, the relative contribution of each spatial structure can be computed and used to generate hypotheses about the drivers of disease. These models were found to perform at least as well as existing modelling frameworks, whilst allowing for future extensions and multiple sources of spatial connectivity.
AI Key Findings
Get AI-generated insights about this paper's methodology, results, significance, and more — seven facets brought into focus.
Impact
Paper Details
Authors
PDF Preview
Key Terms
Citation Network
Current paper (gray), citations (green), references (blue)
Display is limited for performance on very large graphs.
Discussion 0