A Co-analysis Framework for Exploring Multivariate Scientific Data
Publication
Metrics
AI Quick Summary
Researchers propose a co-analysis framework to explore complex multivariate data by identifying clusters of variables and voxels with similar scalar-value patterns. The framework facilitates interactive exploration of local relationships among variables, biclusters, and scalar values in the data.
Paper Preview
Abstract
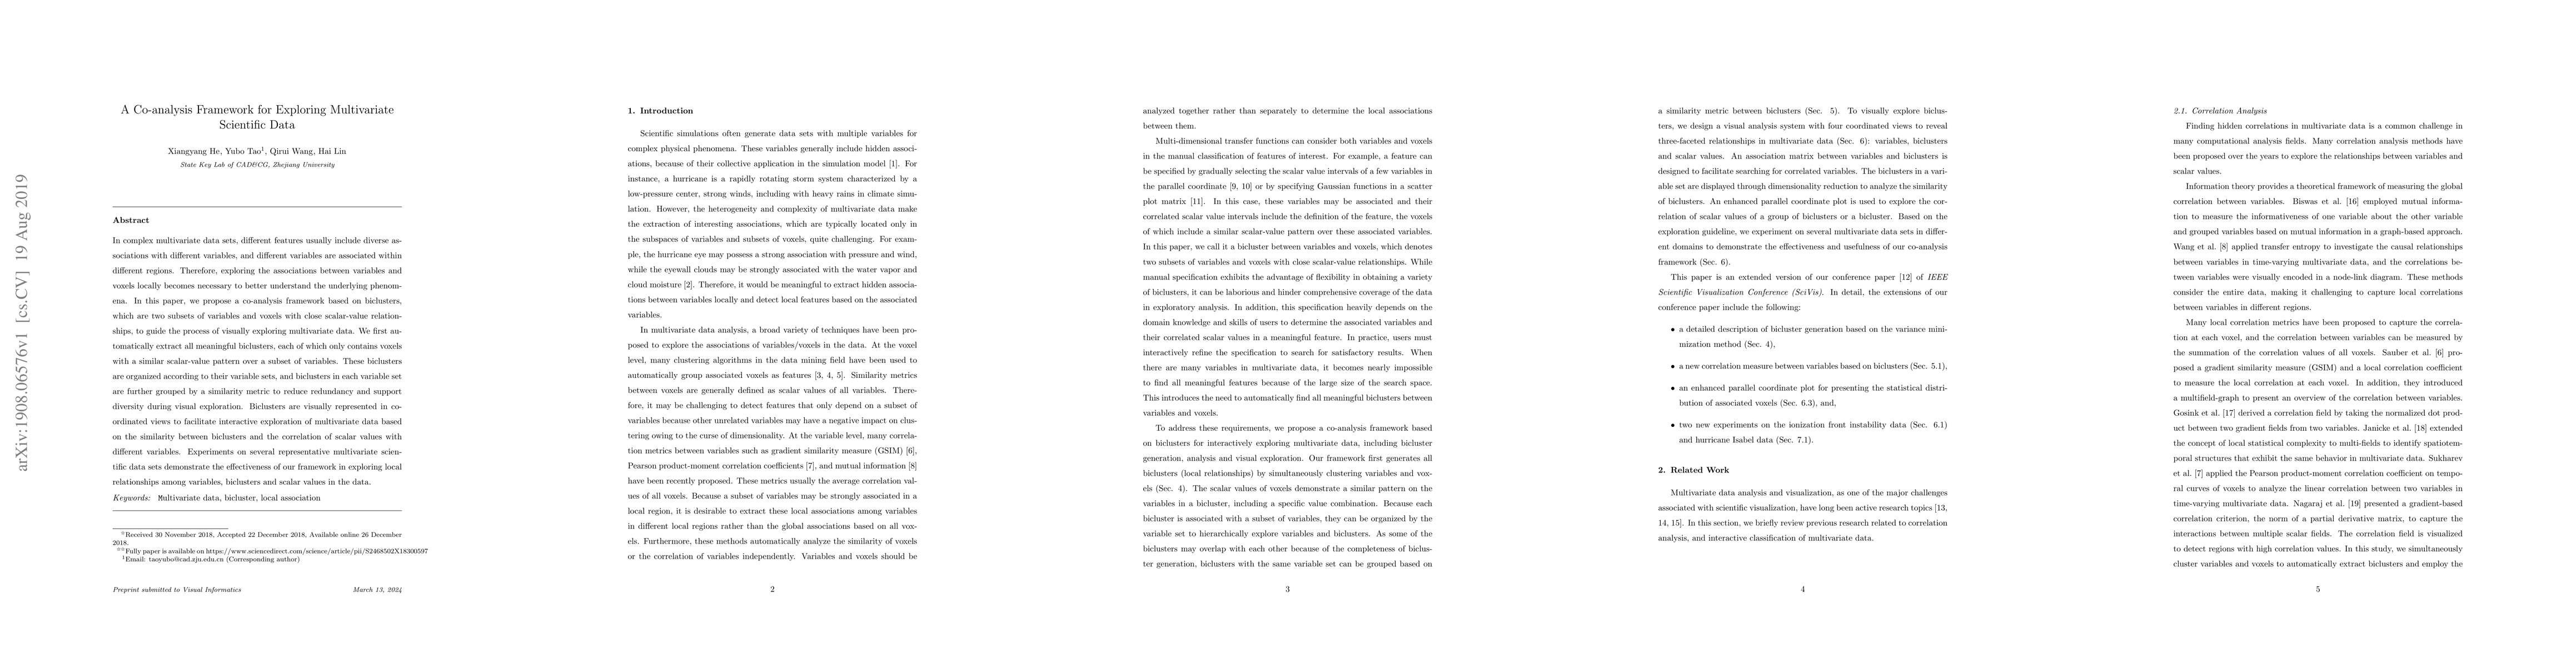
In complex multivariate data sets, different features usually include diverse associations with different variables, and different variables are associated within different regions. Therefore, exploring the associations between variables and voxels locally becomes necessary to better understand the underlying phenomena. In this paper, we propose a co-analysis framework based on biclusters, which are two subsets of variables and voxels with close scalar-value relationships, to guide the process of visually exploring multivariate data. We first automatically extract all meaningful biclusters, each of which only contains voxels with a similar scalar-value pattern over a subset of variables. These biclusters are organized according to their variable sets, and biclusters in each variable set are further grouped by a similarity metric to reduce redundancy and support diversity during visual exploration. Biclusters are visually represented in coordinated views to facilitate interactive exploration of multivariate data based on the similarity between biclusters and the correlation of scalar values with different variables. Experiments on several representative multivariate scientific data sets demonstrate the effectiveness of our framework in exploring local relationships among variables, biclusters and scalar values in the data.
AI Key Findings
Get AI-generated insights about this paper's methodology, results, significance, and more — seven facets brought into focus.
Impact
Paper Details
Authors
PDF Preview
Key Terms
Citation Network
Current paper (gray), citations (green), references (blue)
Display is limited for performance on very large graphs.
Discussion 0