A Comparative Evaluation of Visual Summarization Techniques for Event Sequences
Publication
Metrics
AI Quick Summary
This paper evaluates three visual summarization techniques—CoreFlow, SentenTree, and Sequence Synopsis—through a crowdsourcing experiment. Results show that Sequence Synopsis generates the highest-quality summaries, though it takes the longest to comprehend, while participants assess summary quality based on content and interpretability.
Paper Preview
Abstract
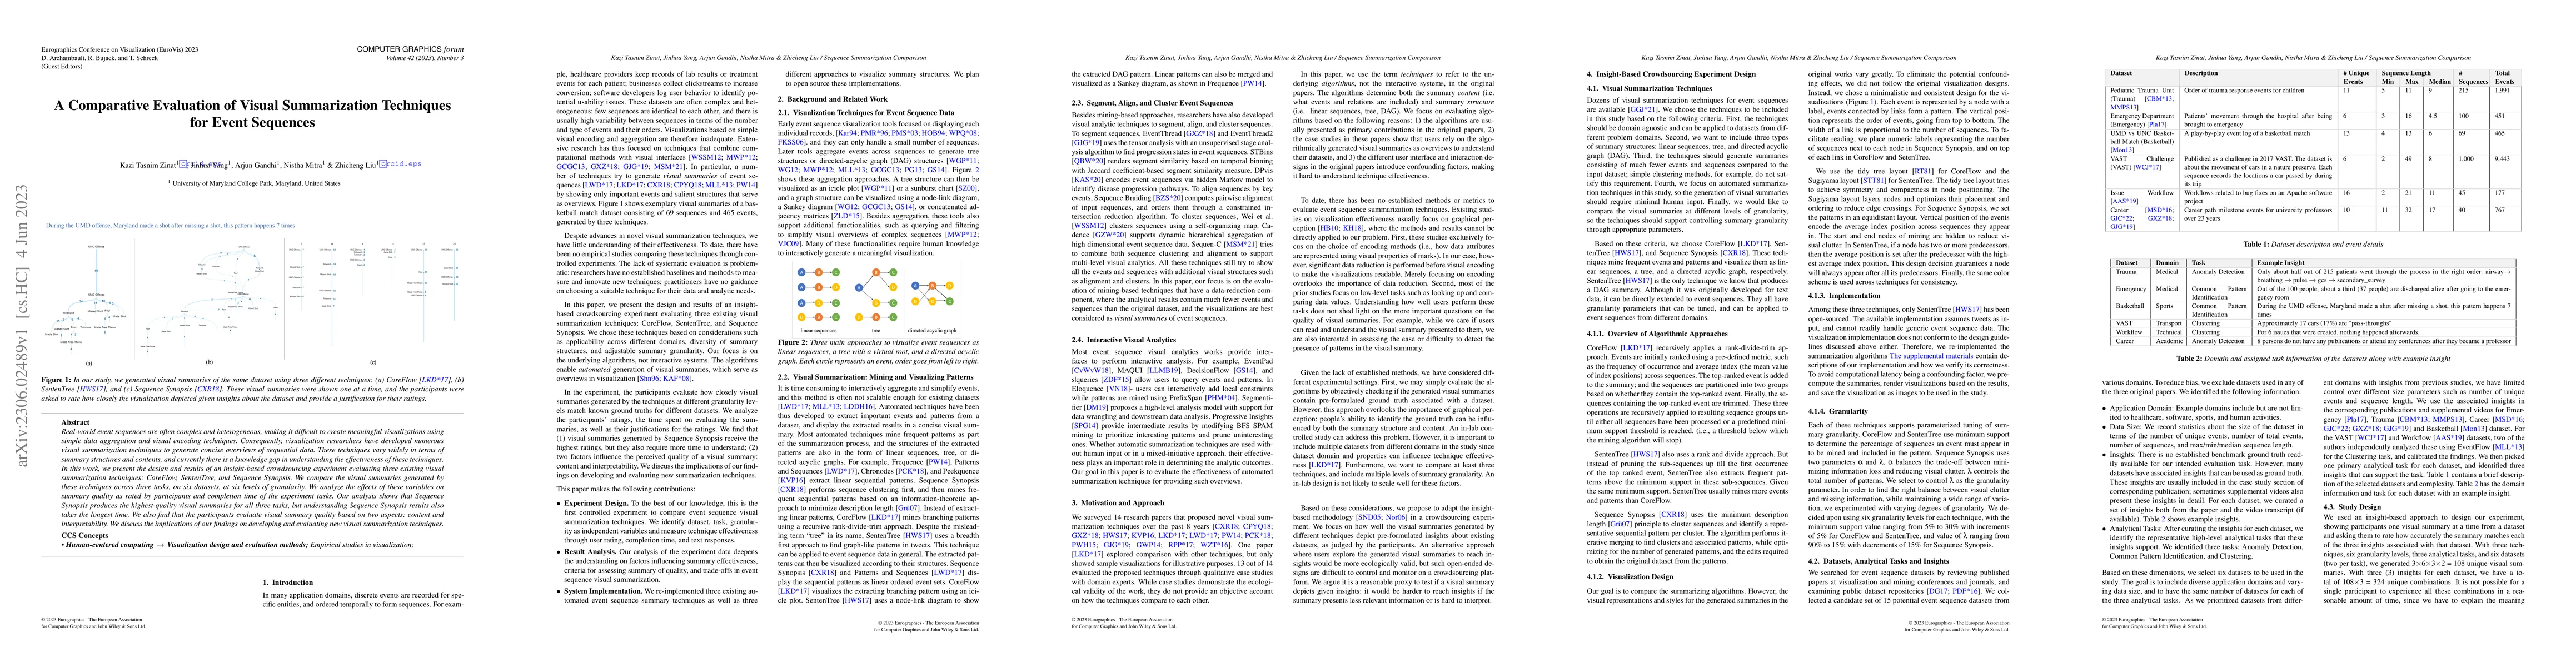
Real-world event sequences are often complex and heterogeneous, making it difficult to create meaningful visualizations using simple data aggregation and visual encoding techniques. Consequently, visualization researchers have developed numerous visual summarization techniques to generate concise overviews of sequential data. These techniques vary widely in terms of summary structures and contents, and currently there is a knowledge gap in understanding the effectiveness of these techniques. In this work, we present the design and results of an insight-based crowdsourcing experiment evaluating three existing visual summarization techniques: CoreFlow, SentenTree, and Sequence Synopsis. We compare the visual summaries generated by these techniques across three tasks, on six datasets, at six levels of granularity. We analyze the effects of these variables on summary quality as rated by participants and completion time of the experiment tasks. Our analysis shows that Sequence Synopsis produces the highest-quality visual summaries for all three tasks, but understanding Sequence Synopsis results also takes the longest time. We also find that the participants evaluate visual summary quality based on two aspects: content and interpretability. We discuss the implications of our findings on developing and evaluating new visual summarization techniques.
AI Key Findings
Get AI-generated insights about this paper's methodology, results, significance, and more — seven facets brought into focus.
Impact
Paper Details
Authors
PDF Preview
Key Terms
Citation Network
Current paper (gray), citations (green), references (blue)
Display is limited for performance on very large graphs.
Discussion 0