Publication
Metrics
AI Quick Summary
This paper reviews four Gamma Markov chains used in temporal non-negative matrix factorization (NMF) and identifies a common flaw: the lack of a well-defined stationary distribution. It introduces a fifth model, BGAR(1), which addresses this issue and compares all five models in a MAP framework for prediction tasks under a Poisson likelihood.
Paper Preview
Abstract
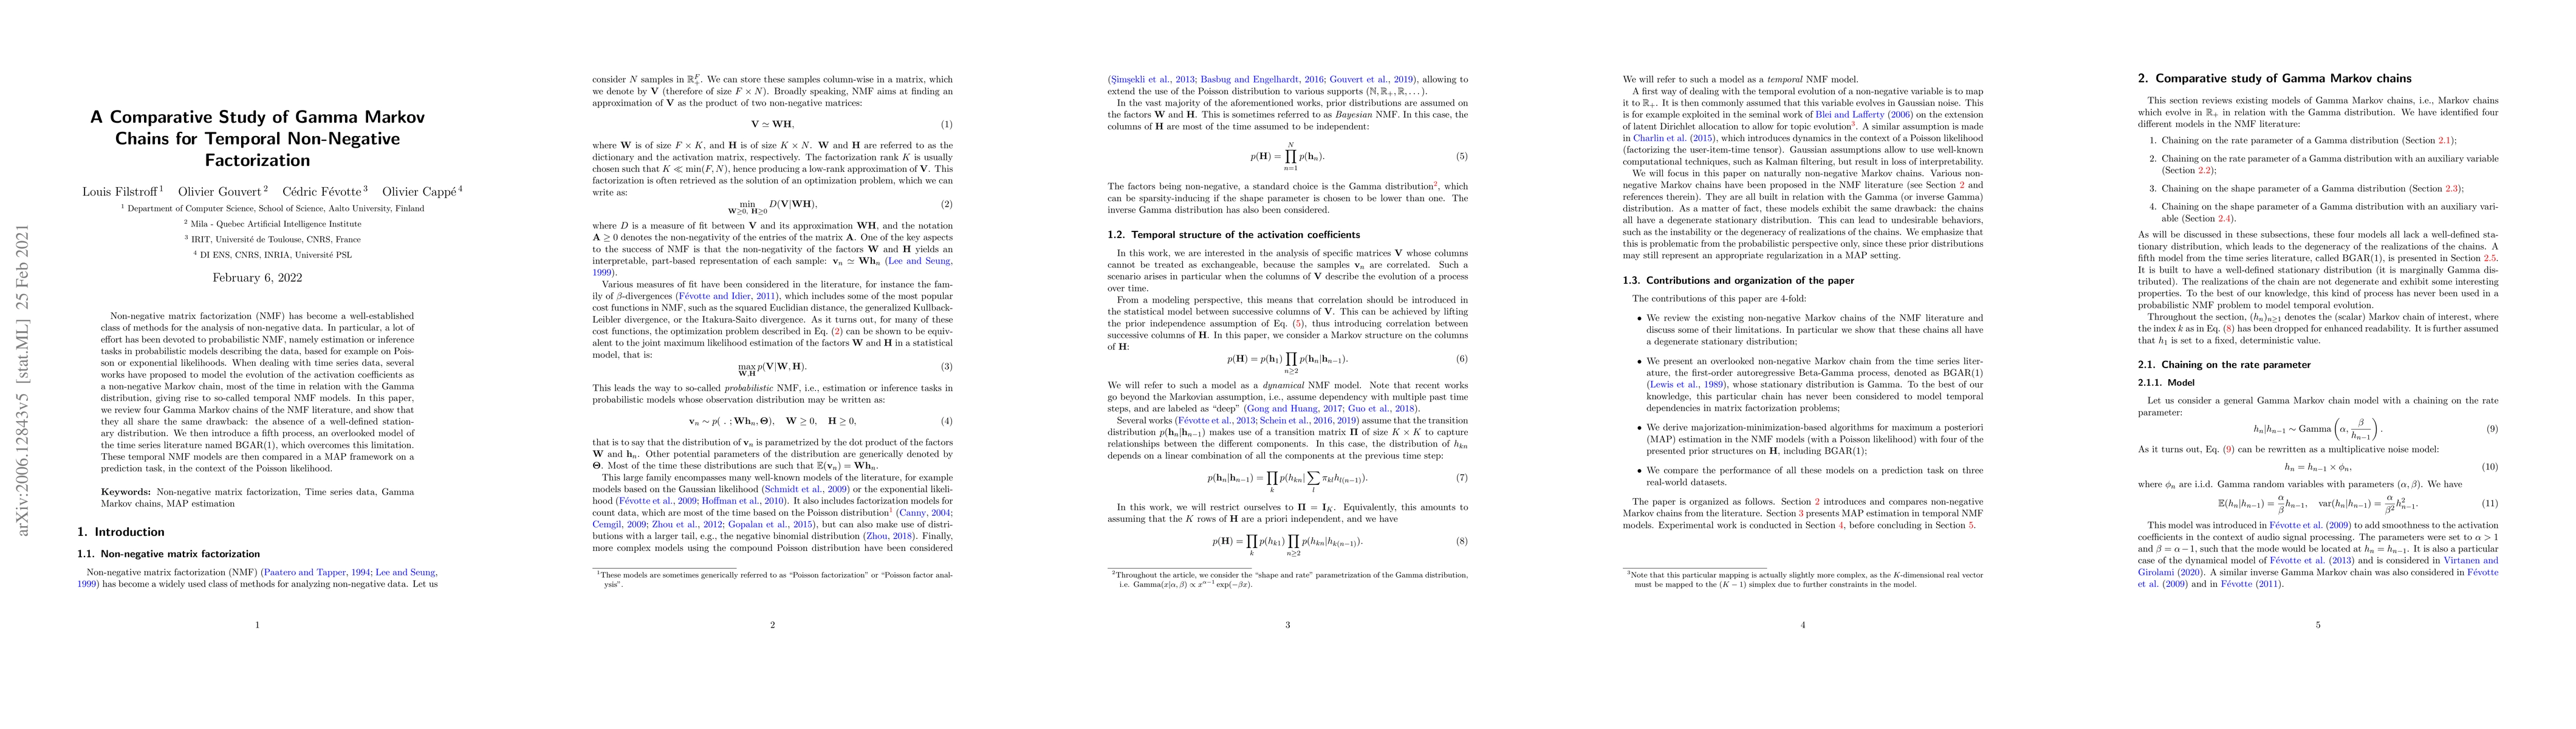
Non-negative matrix factorization (NMF) has become a well-established class of methods for the analysis of non-negative data. In particular, a lot of effort has been devoted to probabilistic NMF, namely estimation or inference tasks in probabilistic models describing the data, based for example on Poisson or exponential likelihoods. When dealing with time series data, several works have proposed to model the evolution of the activation coefficients as a non-negative Markov chain, most of the time in relation with the Gamma distribution, giving rise to so-called temporal NMF models. In this paper, we review four Gamma Markov chains of the NMF literature, and show that they all share the same drawback: the absence of a well-defined stationary distribution. We then introduce a fifth process, an overlooked model of the time series literature named BGAR(1), which overcomes this limitation. These temporal NMF models are then compared in a MAP framework on a prediction task, in the context of the Poisson likelihood.
AI Key Findings
Get AI-generated insights about this paper's methodology, results, significance, and more — seven facets brought into focus.
Impact
Paper Details
PDF Preview
Citation Network
Current paper (gray), citations (green), references (blue)
Display is limited for performance on very large graphs.
Discussion 0