A Comparative Study of Table Sized Physicalization and Digital Visualization
Publication
Metrics
AI Quick Summary
This study compares large-size physical models and digital screens for visualizing school building history data, finding that physicalization enhances both initial comprehension and long-term memory retention, with higher user satisfaction. The results advocate for the use of physical models in educational and public data visualization contexts.
Paper Preview
Abstract
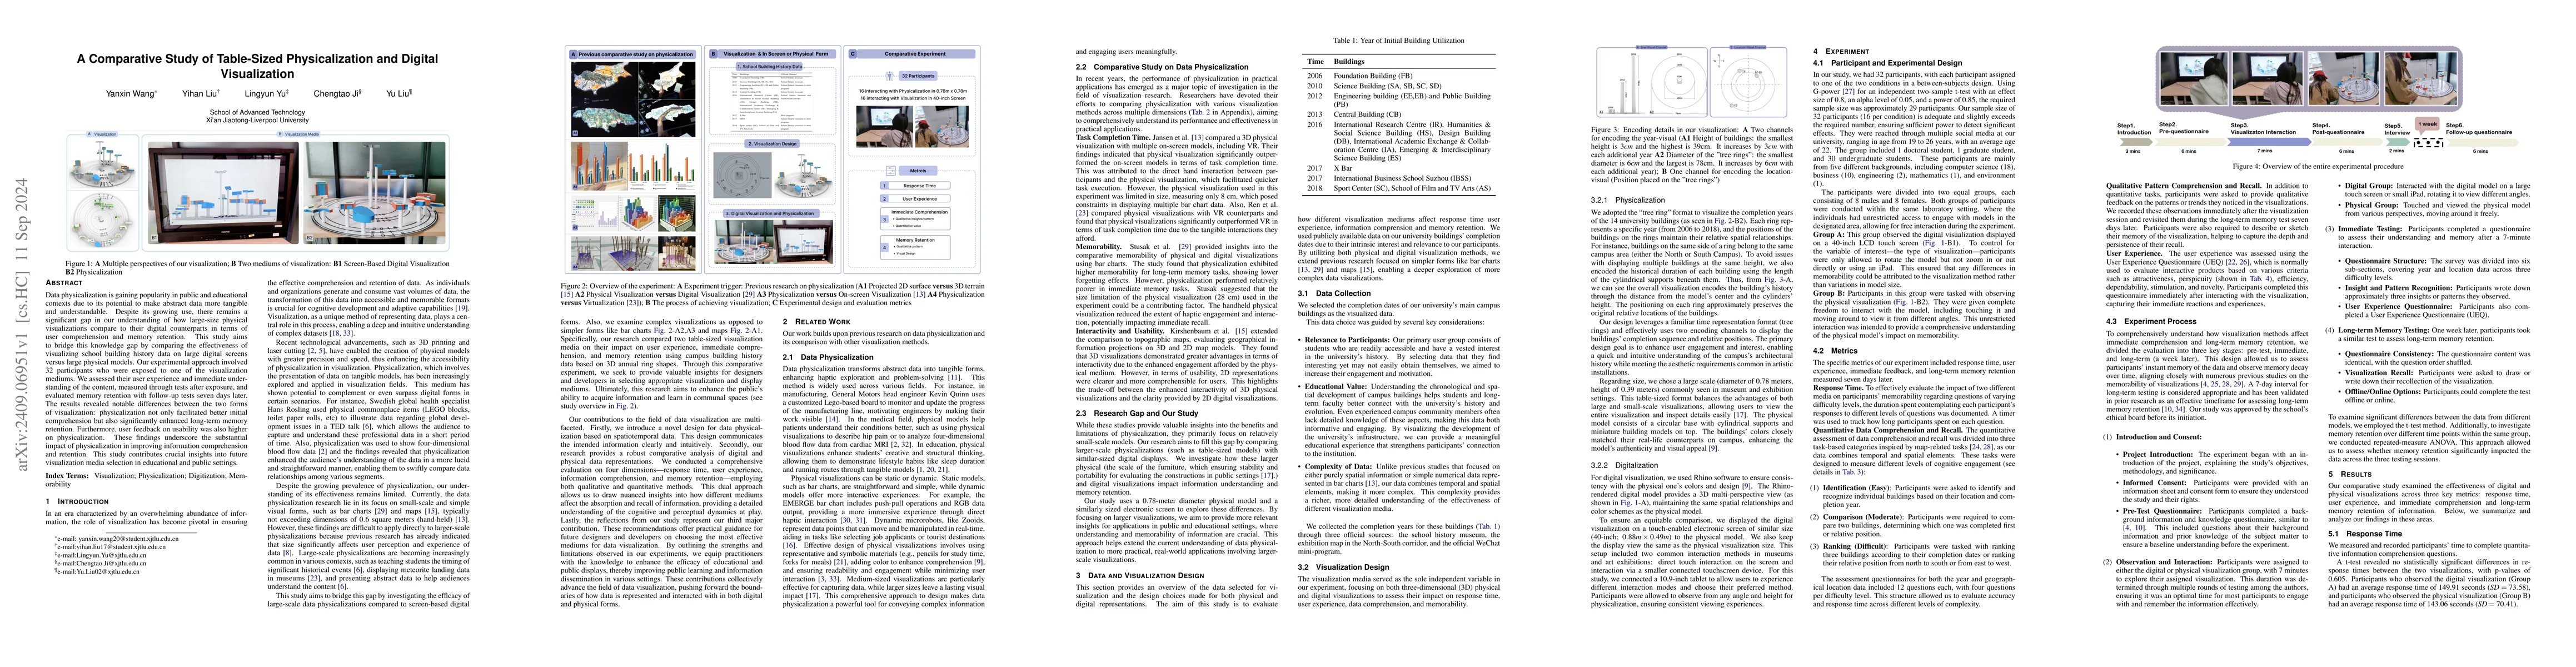
Data physicalization is gaining popularity in public and educational contexts due to its potential to make abstract data more tangible and understandable. Despite its growing use, there remains a significant gap in our understanding of how large-size physical visualizations compare to their digital counterparts in terms of user comprehension and memory retention. This study aims to bridge this knowledge gap by comparing the effectiveness of visualizing school building history data on large digital screens versus large physical models. Our experimental approach involved 32 participants who were exposed to one of the visualization mediums. We assessed their user experience and immediate understanding of the content, measured through tests after exposure, and evaluated memory retention with follow-up tests seven days later. The results revealed notable differences between the two forms of visualization: physicalization not only facilitated better initial comprehension but also significantly enhanced long-term memory retention. Furthermore, user feedback on usability was also higher on physicalization. These findings underscore the substantial impact of physicalization in improving information comprehension and retention. This study contributes crucial insights into future visualization media selection in educational and public settings.
AI Key Findings
Get AI-generated insights about this paper's methodology, results, significance, and more — seven facets brought into focus.
Impact
Paper Details
Authors
PDF Preview
Citation Network
Current paper (gray), citations (green), references (blue)
Display is limited for performance on very large graphs.
Discussion 0