A Comparative Visual Analytics Framework for Evaluating Evolutionary Processes in Multi-objective Optimization
Publication
Metrics
AI Quick Summary
This paper presents a visual analytics framework to enhance comparative analysis of evolutionary multi-objective optimization algorithms by enabling interactive exploration of their internal evolutionary processes. The framework supports detailed comparison of intermediate generations and solution sets, demonstrated through case studies on both benchmarking and real-world optimization problems.
Paper Preview
Abstract
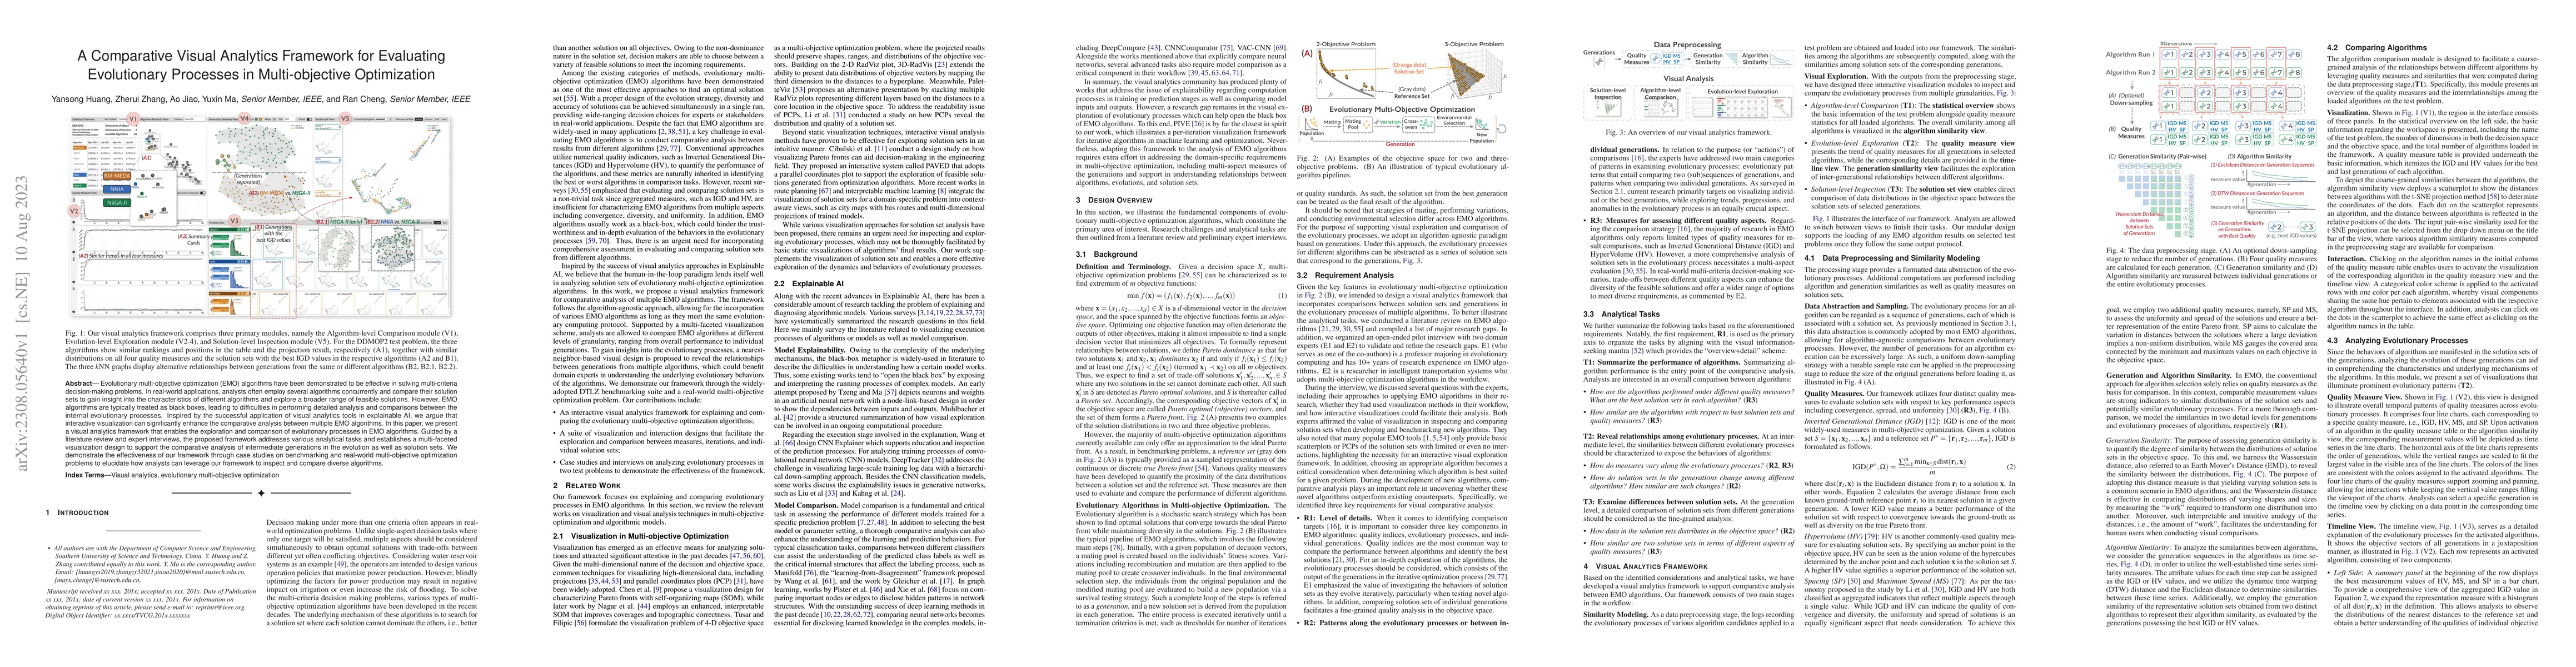
Evolutionary multi-objective optimization (EMO) algorithms have been demonstrated to be effective in solving multi-criteria decision-making problems. In real-world applications, analysts often employ several algorithms concurrently and compare their solution sets to gain insight into the characteristics of different algorithms and explore a broader range of feasible solutions. However, EMO algorithms are typically treated as black boxes, leading to difficulties in performing detailed analysis and comparisons between the internal evolutionary processes. Inspired by the successful application of visual analytics tools in explainable AI, we argue that interactive visualization can significantly enhance the comparative analysis between multiple EMO algorithms. In this paper, we present a visual analytics framework that enables the exploration and comparison of evolutionary processes in EMO algorithms. Guided by a literature review and expert interviews, the proposed framework addresses various analytical tasks and establishes a multi-faceted visualization design to support the comparative analysis of intermediate generations in the evolution as well as solution sets. We demonstrate the effectiveness of our framework through case studies on benchmarking and real-world multi-objective optimization problems to elucidate how analysts can leverage our framework to inspect and compare diverse algorithms.
AI Key Findings
Get AI-generated insights about this paper's methodology, results, significance, and more — seven facets brought into focus.
Impact
Paper Details
Authors
PDF Preview
Key Terms
Citation Network
Current paper (gray), citations (green), references (blue)
Display is limited for performance on very large graphs.
Discussion 0