Summary
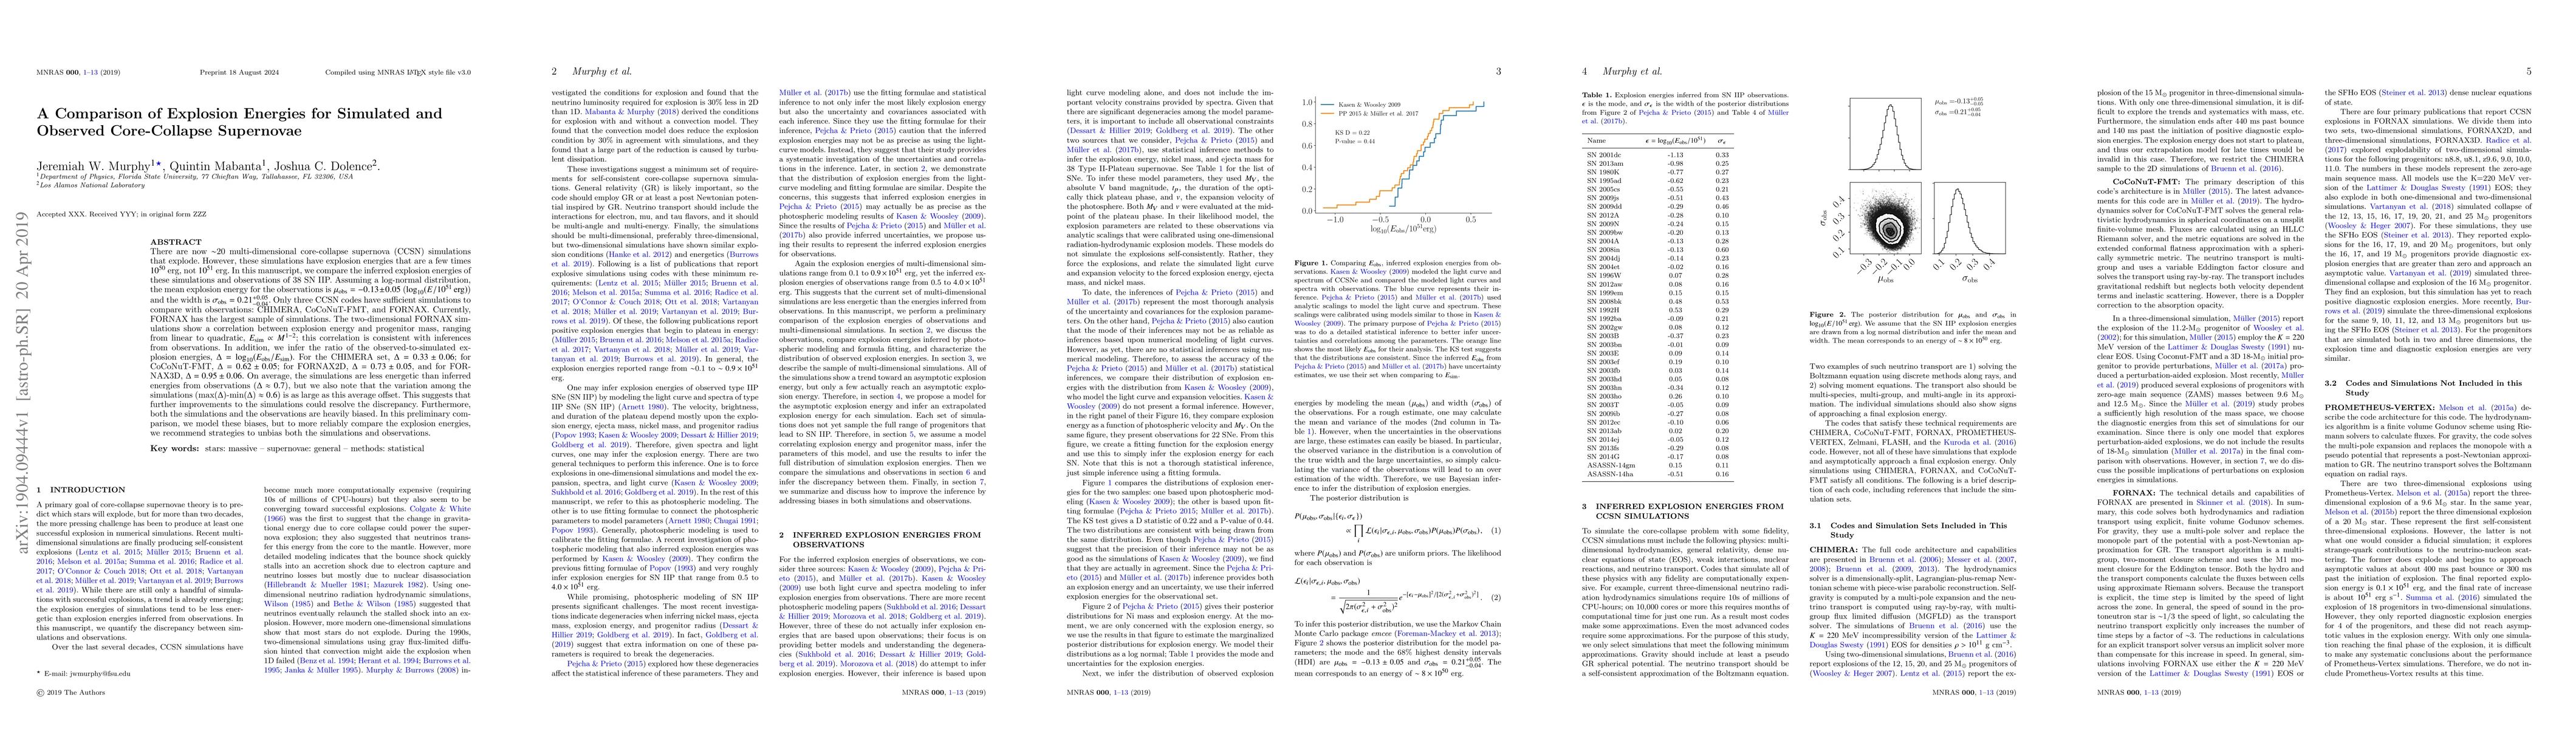
There are now $\sim$20 multi-dimensional core-collapse supernova (CCSN) simulations that explode. However, these simulations have explosion energies that are a few times $10^{50}$ erg, not $10^{51}$ erg. In this manuscript, we compare the inferred explosion energies of these simulations and observations of 38 SN~IIP. Assuming a log-normal distribution, the mean explosion energy for the observations is $\mu_{\rm obs} = -0.13\pm 0.05$ ($\log_{10}(E/10^{51}\, {\rm erg})$) and the width is $\sigma_{\rm obs} = 0.21^{+0.05}_{-0.04}$. Only three CCSN codes have sufficient simulations to compare with observations: CHIMERA, CoCoNuT-FMT, and FORNAX. Currently, FORNAX has the largest sample of simulations. The two-dimensional FORNAX simulations show a correlation between explosion energy and progenitor mass, ranging from linear to quadratic, $E_{\rm sim} \propto M^{1-2}$; this correlation is consistent with inferences from observations. In addition, we infer the ratio of the observed-to-simulated explosion energies, $\Delta=\log_{10}(E_{\rm obs}/E_{\rm sim})$. For the CHIMERA set, $\Delta=0.33\pm0.06$; for CoCoNuT-FMT, $\Delta=0.62\pm0.05$; for FORNAX2D, $\Delta=0.73\pm0.05$, and for FORNAX3D, $\Delta=0.95\pm0.06$. On average, the simulations are less energetic than inferred energies from observations ($\Delta \approx 0.7$), but we also note that the variation among the simulations (max($\Delta$)-min($\Delta$) $\approx 0.6$) is as large as this average offset. This suggests that further improvements to the simulations could resolve the discrepancy. Furthermore, both the simulations and the observations are heavily biased. In this preliminary comparison, we model these biases, but to more reliably compare the explosion energies, we recommend strategies to un-bias both the simulations and observations.
AI Key Findings
Get AI-generated insights about this paper's methodology, results, and significance.
Paper Details
PDF Preview
Key Terms
Citation Network
Current paper (gray), citations (green), references (blue)
Display is limited for performance on very large graphs.
Similar Papers
Found 4 papers| Title | Authors | Year | Actions |
|---|
Comments (0)