Authors
Summary
Multidimensional poverty measurement is crucial for capturing deprivation beyond income-based metrics. This study compares the Alkire-Foster (AF) method and a Markov Random Field (MRF) approach for classifying multidimensional poverty using a simulation-based analysis. The AF method applies a deterministic threshold-based classification, while the MRF approach leverages probabilistic graphical modelling to account for correlations between deprivation indicators. Using a synthetic dataset of 50,000 individuals with ten binary deprivation indicators, we assess classification accuracy, false positive/negative trade-offs, and agreement between the methods. Results show that AF achieves higher classification accuracy (89.5%) compared to MRF (75.4%), with AF minimizing false negatives and MRF reducing false positives. The overall agreement between the two methods is 65%, with discrepancies primarily occurring when AF classifies individuals as poor while MRF does not. While AF is transparent and easy to implement, it does not capture interdependencies among indicators, potentially leading to misclassification. MRF, though computationally intensive, offers a more nuanced understanding of deprivation clusters. These findings highlight the trade-offs in multidimensional poverty measurement and provide insights for policymakers on method selection based on data availability and policy objectives. Future research should extend these approaches to non-binary indicators and real-world datasets.
AI Key Findings
Generated Jun 10, 2025
Methodology
This study compares the Alkire-Foster (AF) method and a Markov Random Field (MRF) approach using a synthetic dataset of 50,000 individuals with ten binary deprivation indicators. The comparison is based on classification accuracy, false positive/negative trade-offs, and agreement between the methods, assessed through a simulation-based analysis.
Key Results
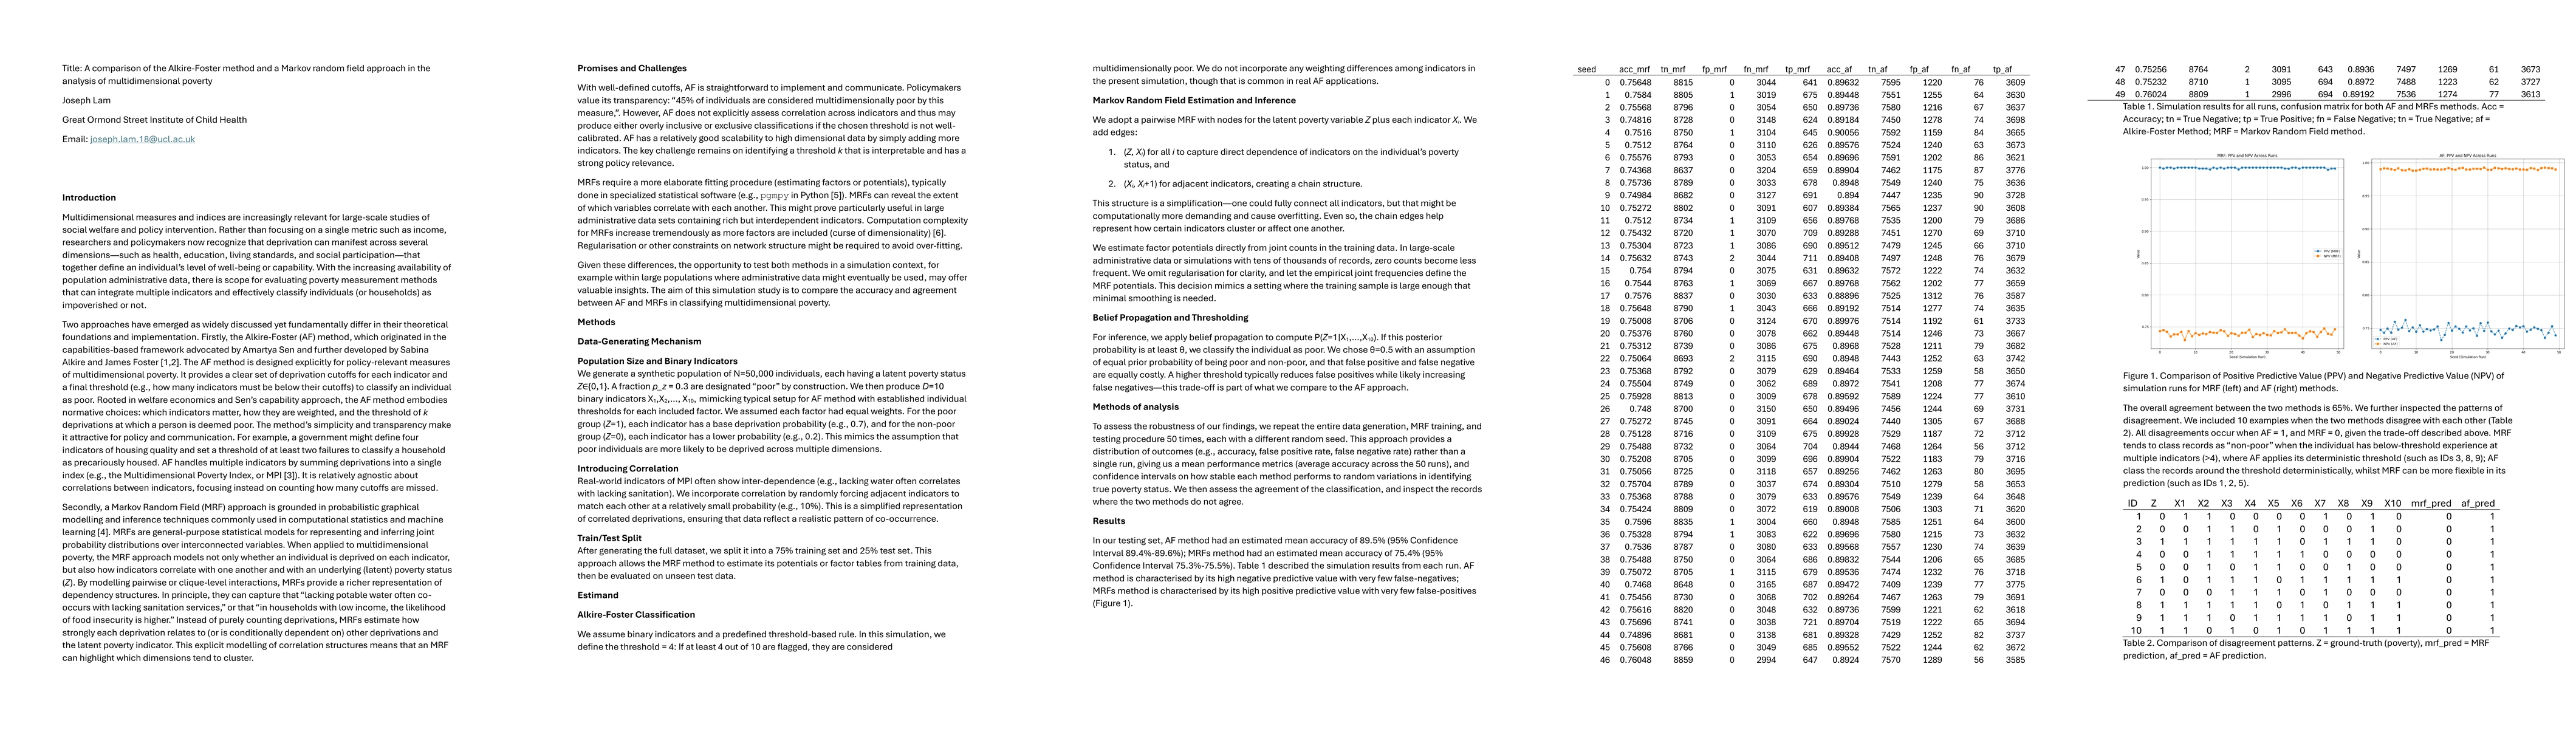
- The Alkire-Foster method achieved higher classification accuracy (89.5%) compared to the MRF approach (75.4%).
- The Alkire-Foster method minimized false negatives, while the MRF reduced false positives.
- The overall agreement between the two methods was 65%, with discrepancies primarily occurring when AF classified individuals as poor while MRF did not.
- The AF method is transparent and easy to implement, but it does not capture interdependencies among indicators, potentially leading to misclassification.
- The MRF approach, though computationally intensive, offers a more nuanced understanding of deprivation clusters.
Significance
This research highlights the trade-offs in multidimensional poverty measurement, providing insights for policymakers on method selection based on data availability and policy objectives.
Technical Contribution
The paper presents a detailed comparison of two poverty measurement methods, analyzing their performance in terms of classification accuracy, false positives, and false negatives.
Novelty
The research offers a unique comparison of the Alkire-Foster method and a Markov Random Field approach in the context of multidimensional poverty measurement, emphasizing their respective strengths and weaknesses.
Limitations
- The study uses a synthetic dataset with binary indicators, which may not fully capture the complexities of real-world multidimensional poverty data.
- The findings are based on a specific MRF model structure; different models might yield varying results.
Future Work
- Extend these approaches to non-binary indicators and real-world datasets.
- Investigate the performance of these methods with varying numbers of indicators and different deprivation indicator correlations.
Paper Details
PDF Preview
Citation Network
Current paper (gray), citations (green), references (blue)
Display is limited for performance on very large graphs.
Similar Papers
Found 4 papersIt Takes Three to Ceilidh: Pension System and Multidimensional Poverty Mitigation in China
Cheng Yuan, Yansong David Wang, Tao Louie Xu
No citations found for this paper.
Comments (0)