Authors
Summary
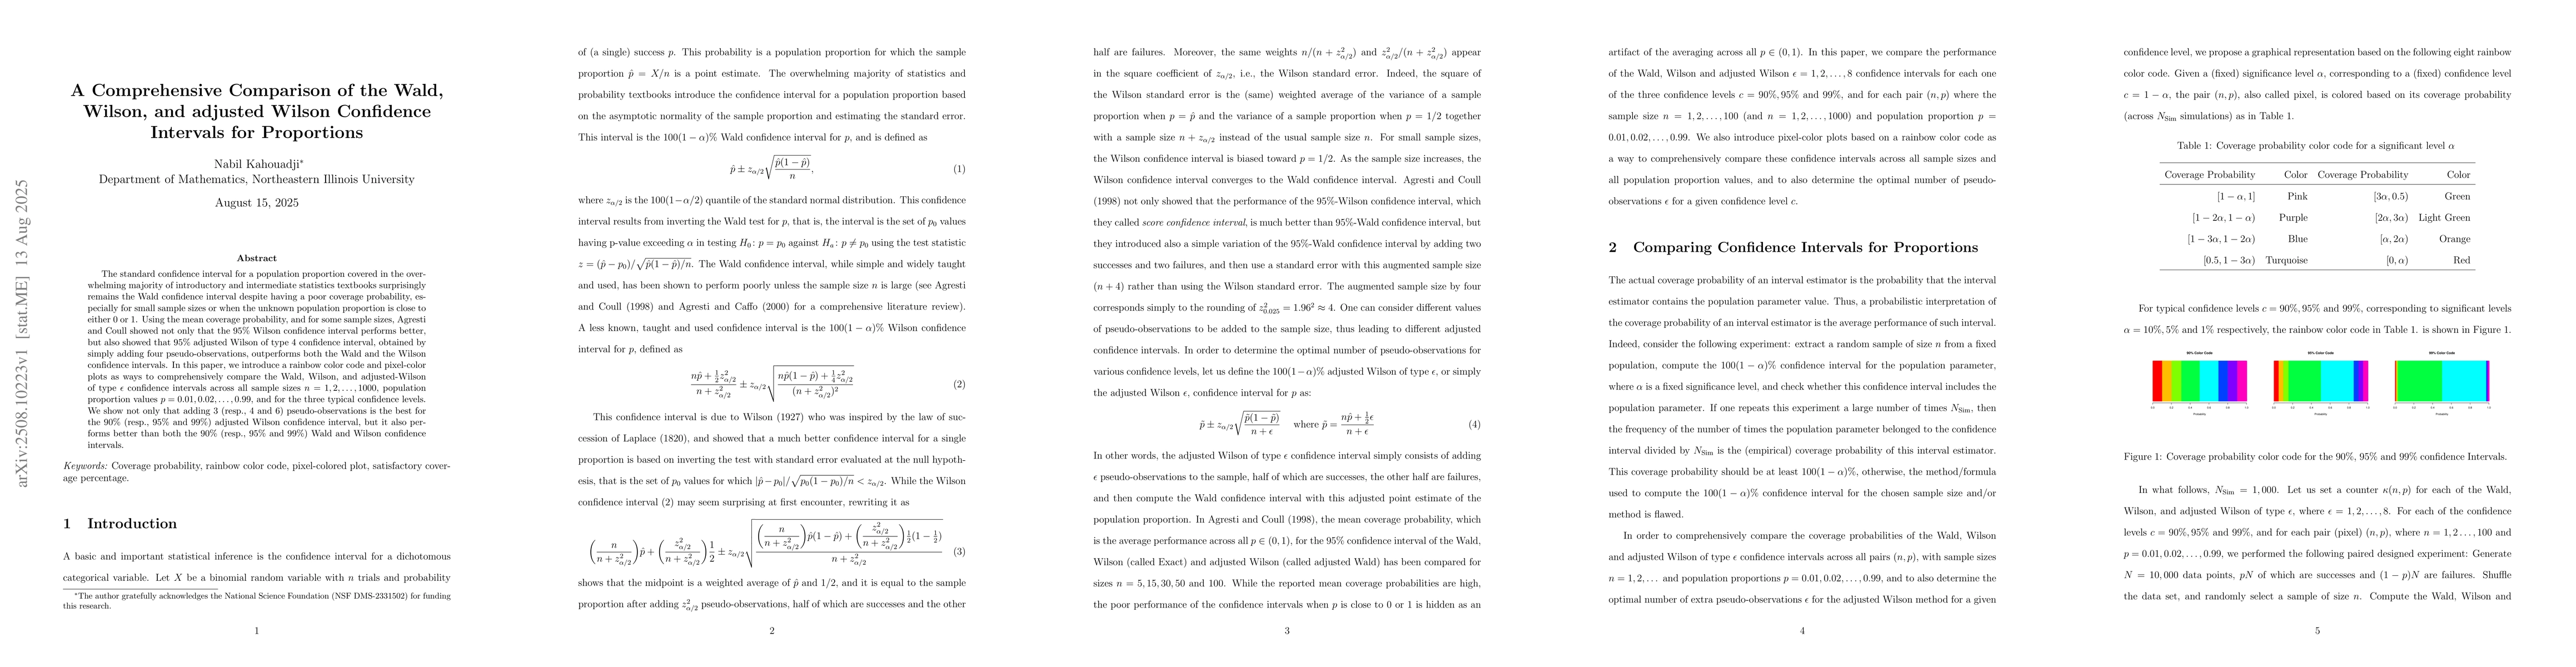
The standard confidence interval for a population proportion covered in the overwhelming majority of introductory and intermediate statistics textbooks surprisingly remains the Wald confidence interval despite having a poor coverage probability, especially for small sample sizes or when the unknown population proportion is close to either 0 or 1. Using the mean coverage probability, and for some sample sizes, Agresti and Coull showed not only that the 95\% Wilson confidence interval performs better, but also showed that 95\% adjusted Wilson of type 4 confidence interval, obtained by simply adding four pseudo-observations, outperforms both the Wald and the Wilson confidence intervals. In this paper, we introduce a rainbow color code and pixel-color plots as ways to comprehensively compare the Wald, Wilson, and adjusted-Wilson of type $\epsilon$ confidence intervals across all sample sizes $n=1, 2, \dots, 1000$, population proportion values $p=0.01, 0.02, \dots, 0.99$, and for the three typical confidence levels. We show not only that adding 3 (resp., 4 and 6) pseudo-observations is the best for the 90\% (resp., 95\% and 99\%) adjusted Wilson confidence interval, but it also performs better than both the 90\% (resp., 95\% and 99\%) Wald and Wilson confidence intervals.
AI Key Findings
Get AI-generated insights about this paper's methodology, results, and significance.
Paper Details
PDF Preview
Similar Papers
Found 4 papersConfidence Intervals for the F1 Score: A Comparison of Four Methods
Kevin Fu Yuan Lam, Vikneswaran Gopal, Jiang Qian
Differentially Private Confidence Intervals for Proportions under Stratified Random Sampling
Adam Smith, Mark Bun, Marco Gaboardi et al.
Comments (0)