Summary
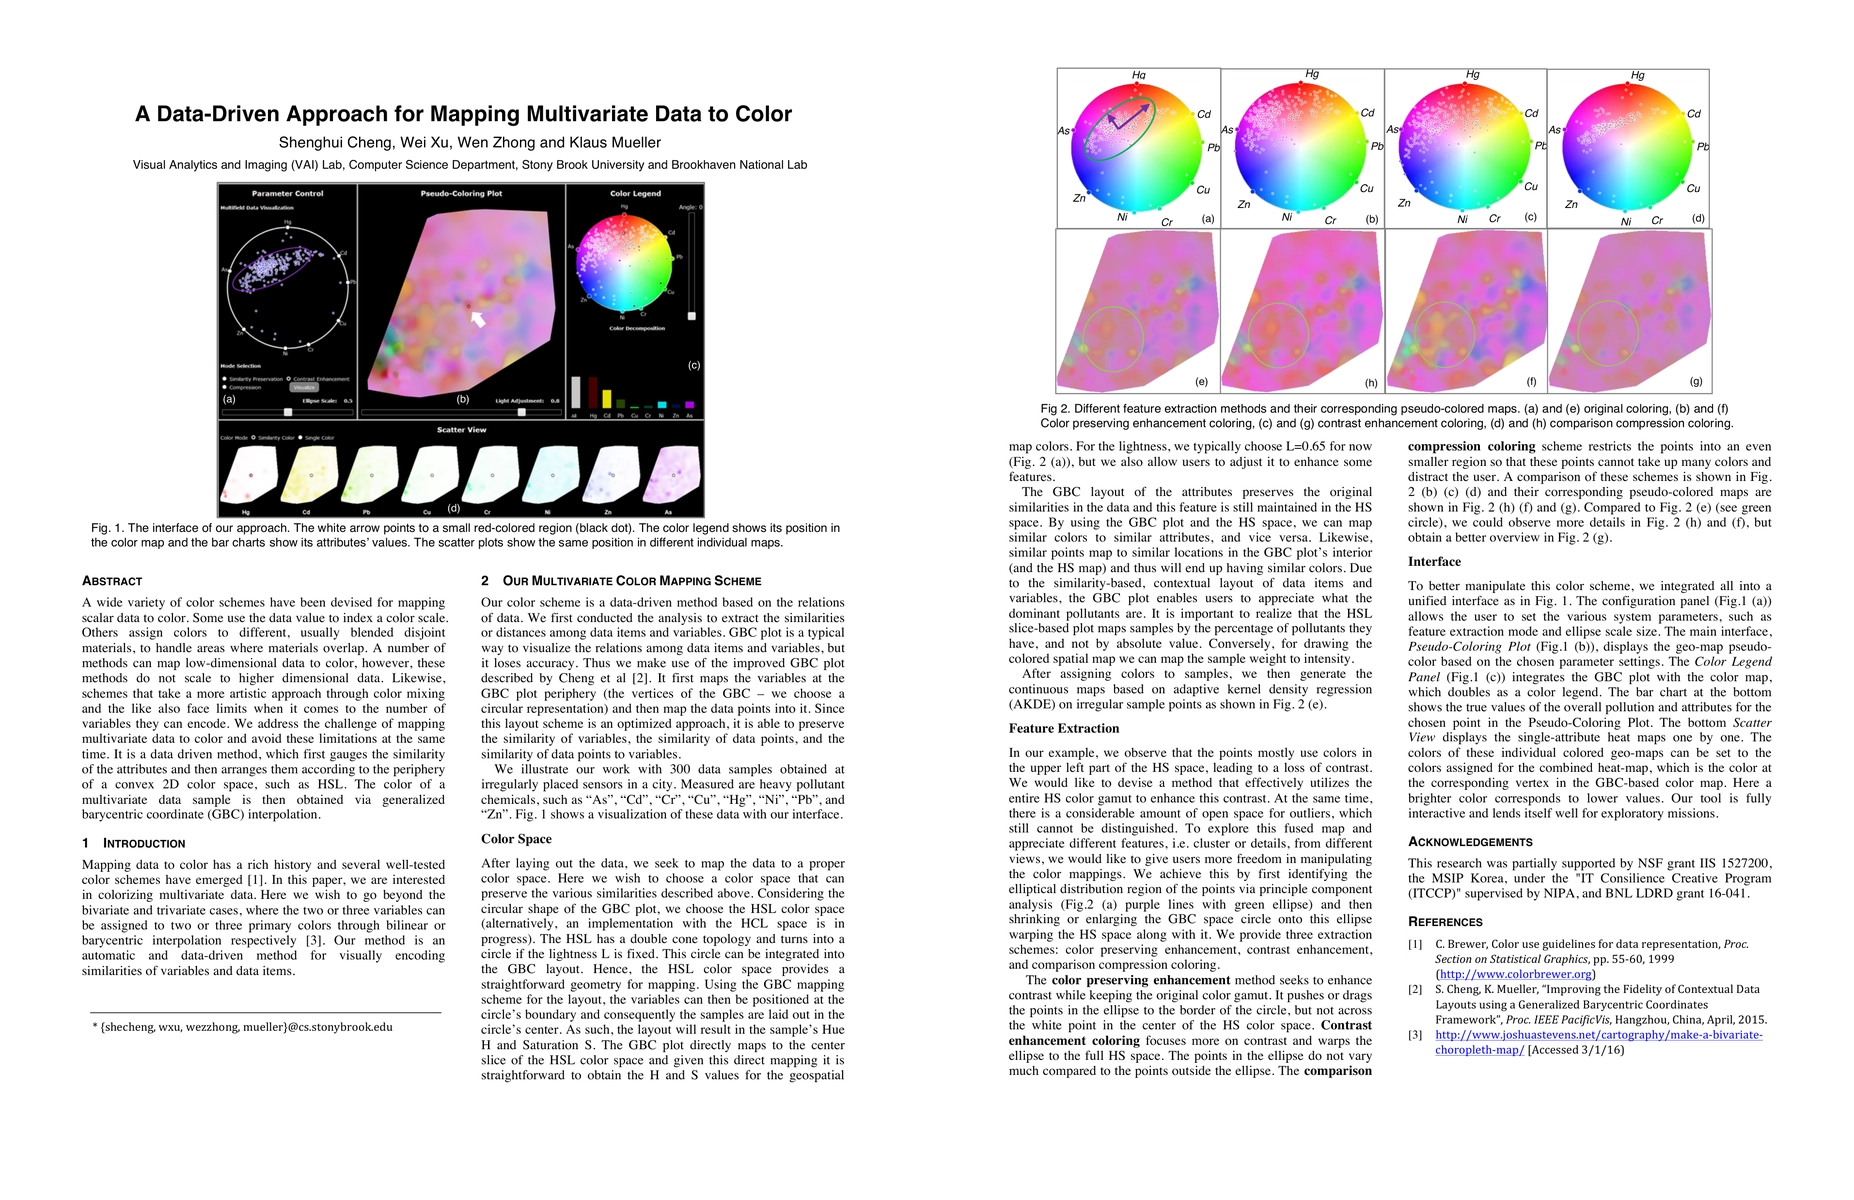
A wide variety of color schemes have been devised for mapping scalar data to color. Some use the data value to index a color scale. Others assign colors to different, usually blended disjoint materials, to handle areas where materials overlap. A number of methods can map low-dimensional data to color, however, these methods do not scale to higher dimensional data. Likewise, schemes that take a more artistic approach through color mixing and the like also face limits when it comes to the number of variables they can encode. We address the challenge of mapping multivariate data to color and avoid these limitations at the same time. It is a data driven method, which first gauges the similarity of the attributes and then arranges them according to the periphery of a convex 2D color space, such as HSL. The color of a multivariate data sample is then obtained via generalized barycentric coordinate (GBC) interpolation.
AI Key Findings
Get AI-generated insights about this paper's methodology, results, and significance.
Paper Details
PDF Preview
Key Terms
Citation Network
Current paper (gray), citations (green), references (blue)
Display is limited for performance on very large graphs.
Similar Papers
Found 4 papersA Criterion for Multivariate Regionalization of Spatial Data
Christopher K. Wikle, Scott H. Holan, Jonathan R. Bradley et al.
| Title | Authors | Year | Actions |
|---|

Comments (0)