Authors
Summary
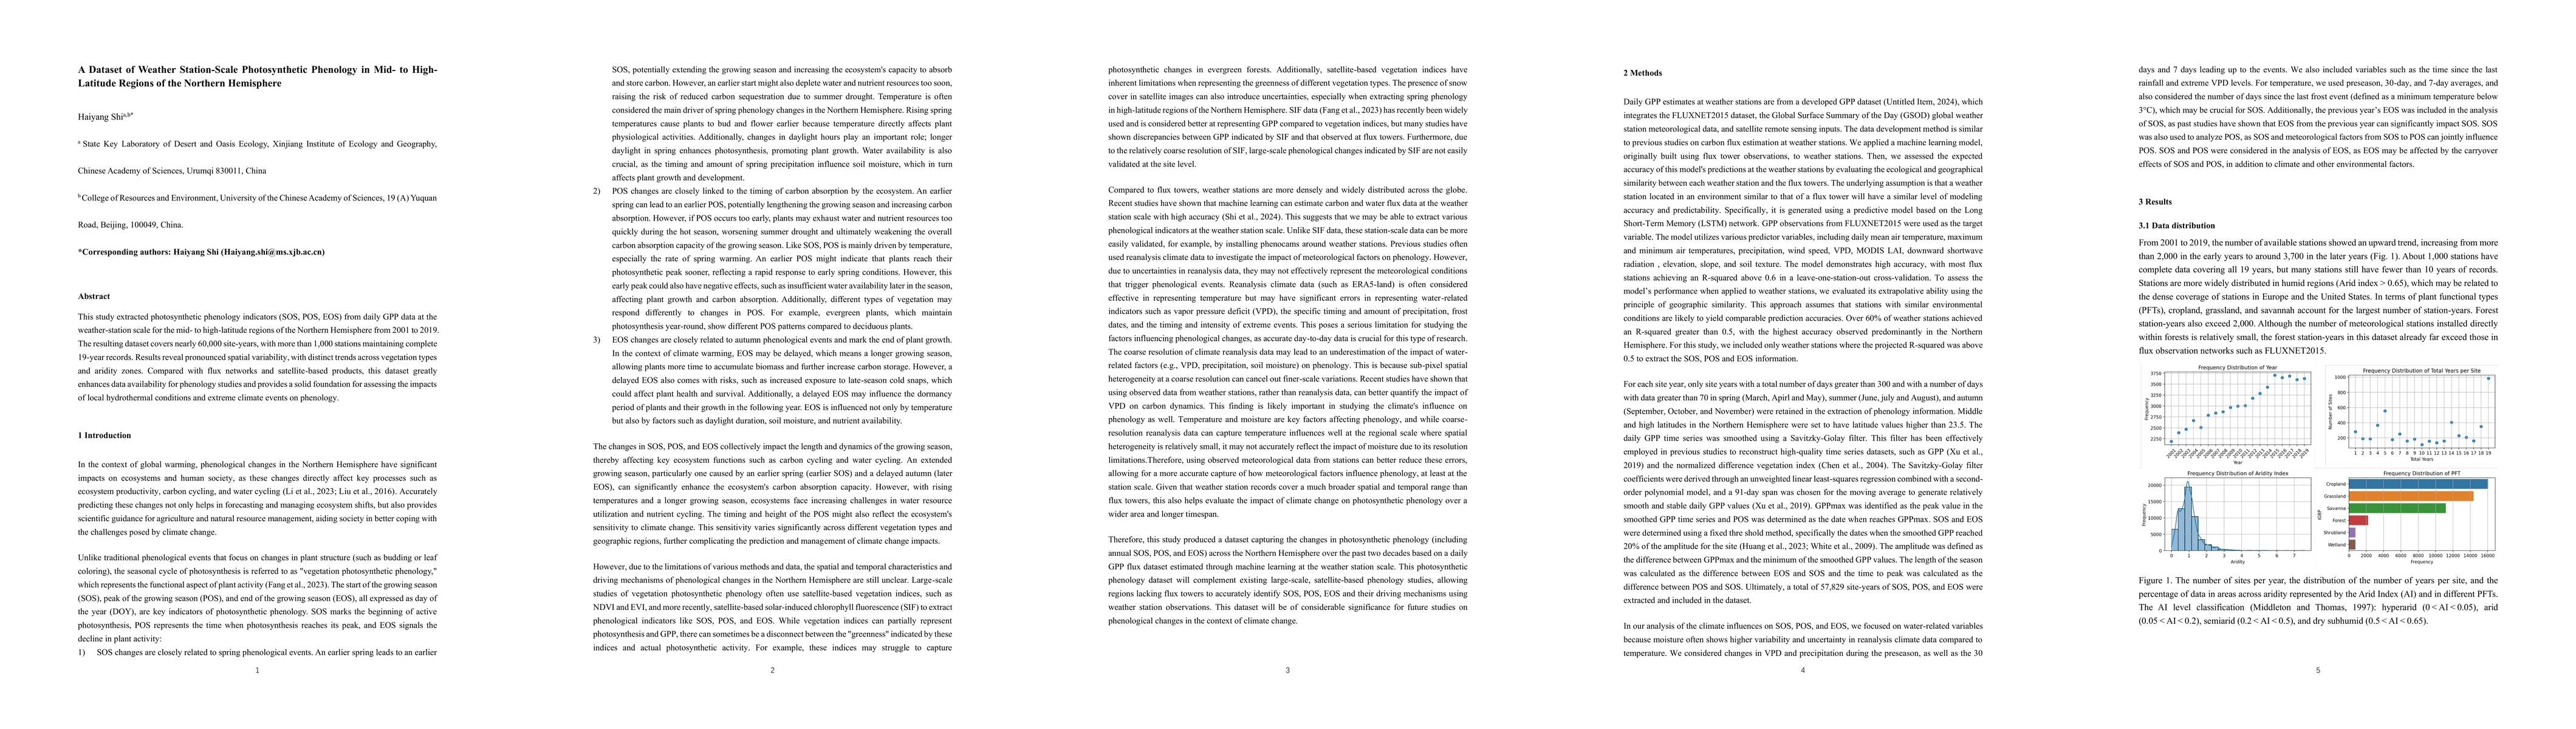
This study extracted photosynthetic phenology indicators (SOS, POS, EOS) from daily GPP data at the weather-station scale for the mid- to high-latitude regions of the Northern Hemisphere from 2001 to 2019. The resulting dataset covers nearly 60,000 site-years, with more than 1,000 stations maintaining complete 19-year records. Results reveal pronounced spatial variability, with distinct trends across vegetation types and aridity zones. Compared with flux networks and satellite-based products, this dataset greatly enhances data availability for phenology studies and provides a solid foundation for assessing the impacts of local hydrothermal conditions and extreme climate events on phenology.
AI Key Findings
Get AI-generated insights about this paper's methodology, results, and significance.
Paper Details
PDF Preview
Similar Papers
Found 4 papersAgnostic detection of large-scale weather patterns in the northern hemisphere: from blockings to teleconnections
Alessandro Laio, Valerio Lucarini, Sebastian Springer et al.
The intensification of winter mid-latitude storms in the Southern Hemisphere
Janni Yuval, Yi Ming, Rei Chemke
Meridional energy transport extremes and the general circulation of Northern Hemisphere mid-latitudes: dominant weather regimes and preferred zonal wavenumbers
Valerio Lucarini, Vera Melinda Galfi, Rune Graversen et al.
Comments (0)