A Declarative Specification for Authoring Metrics Dashboards
Publication
Metrics
AI Quick Summary
This paper proposes a high-level specification for creating metrics dashboards, aiming to simplify the manual, time-consuming process of dashboard authoring. The authors introduce Quick Dashboard, a graphical interface based on this specification, which facilitates a data-first approach by allowing users to define dashboard sections that repeat across the same dimensions.
Paper Preview
Abstract
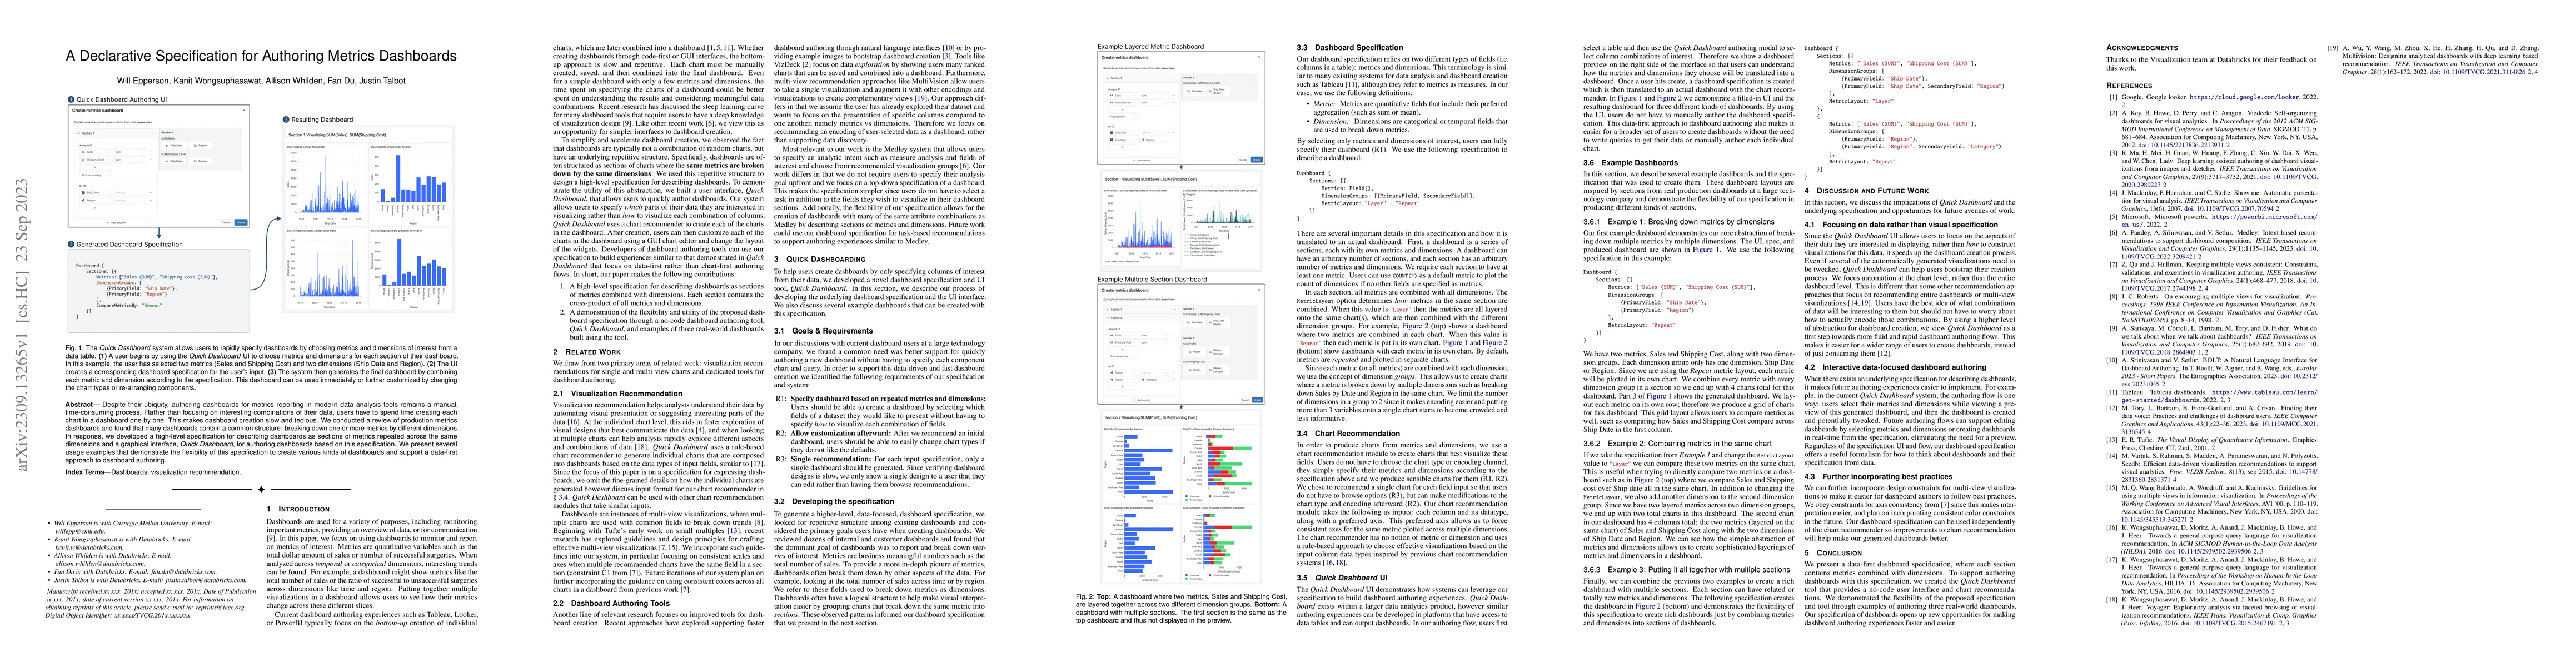
Despite their ubiquity, authoring dashboards for metrics reporting in modern data analysis tools remains a manual, time-consuming process. Rather than focusing on interesting combinations of their data, users have to spend time creating each chart in a dashboard one by one. This makes dashboard creation slow and tedious. We conducted a review of production metrics dashboards and found that many dashboards contain a common structure: breaking down one or more metrics by different dimensions. In response, we developed a high-level specification for describing dashboards as sections of metrics repeated across the same dimensions and a graphical interface, Quick Dashboard, for authoring dashboards based on this specification. We present several usage examples that demonstrate the flexibility of this specification to create various kinds of dashboards and support a data-first approach to dashboard authoring.
AI Key Findings
Get AI-generated insights about this paper's methodology, results, significance, and more — seven facets brought into focus.
Impact
Paper Details
Authors
PDF Preview
Key Terms
Citation Network
Current paper (gray), citations (green), references (blue)
Display is limited for performance on very large graphs.
Discussion 0