This paper introduces a comprehensive design space of vision science methods to enhance visualization research, providing a shared lexicon and detailing experimental paradigms, adjustment types, response types, and dependent measures. It advocates for a stronger collaboration between visualization and vision science to advance methodological understanding and design guidelines.
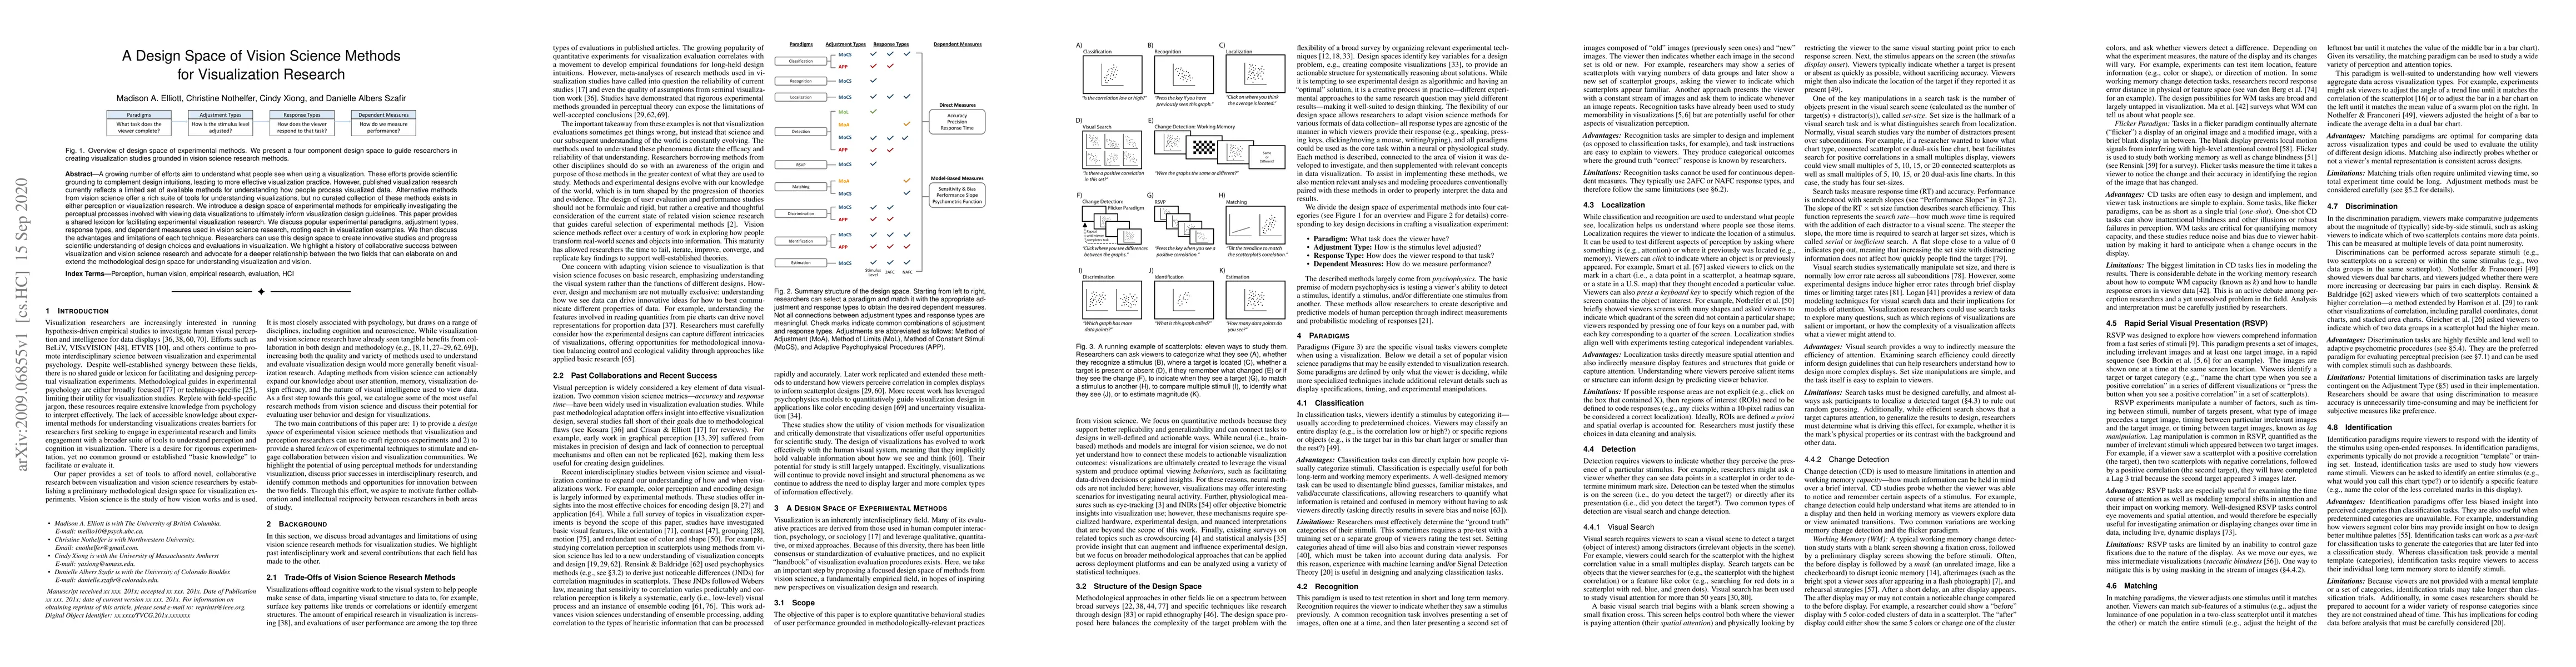
A growing number of efforts aim to understand what people see when using a visualization. These efforts provide scientific grounding to complement design intuitions, leading to more effective visualization practice. However, published visualization research currently reflects a limited set of available methods for understanding how people process visualized data. Alternative methods from vision science offer a rich suite of tools for understanding visualizations, but no curated collection of these methods exists in either perception or visualization research. We introduce a design space of experimental methods for empirically investigating the perceptual processes involved with viewing data visualizations to ultimately inform visualization design guidelines. This paper provides a shared lexicon for facilitating experimental visualization research. We discuss popular experimental paradigms, adjustment types, response types, and dependent measures used in vision science research, rooting each in visualization examples. We then discuss the advantages and limitations of each technique. Researchers can use this design space to create innovative studies and progress scientific understanding of design choices and evaluations in visualization. We highlight a history of collaborative success between visualization and vision science research and advocate for a deeper relationship between the two fields that can elaborate on and extend the methodological design space for understanding visualization and vision.
Get AI-generated insights about this paper's methodology, results, and significance.
Current paper (gray), citations (green), references (blue)
Usman Alim, Roberta Mota, Ehud Sharlin
Title | Authors | Year | Actions |
---|---|---|---|
Size-Encoding methods for depth information in augmented reality
|
Xiaozhou Zhou, Jiayu Ji, Jing Zhang, Yuqing Zhou
|
2025
|
View Paper |
Old Wine in a New Bottle? Analysis of Visual Lineups with Signal Detection Theory Position paper
|
Sheng Long, Matthew Kay
|
2024
|
View Paper |
Tasks and Telephones: Threats to Experimental Validity due to Misunderstandings of Visualisation Tasks and Strategies Position Paper
|
Abhraneel Sarma, Sheng Long, Michael Correll, Matthew Kay
|
2024
|
View Paper |
Shape It Up: An Empirically Grounded Approach for Designing Shape Palettes
|
Chin Tseng, Arran Zeyu Wang, Ghulam Jilani Quadri, D. Szafir
|
2024
|
View Paper |
Motion-Based Visual Encoding Can Improve Performance on Perceptual Tasks with Dynamic Time Series
|
Songwen Hu, Ouxun Jiang, Jeffrey Riedmiller, Cindy Xiong Bearfield
|
2024
|
View Paper |
Effects of Spatial Abilities and Domain on Estimation of Pearson's Correlation Coefficient
|
Sara Tandon, Alfie Abdul-Rahman, Rita Borgo
|
2024
|
View Paper |
Use of the perceptual point-spread function to assess dysphotopsias
|
K. Petelczyc, Jan Bolek, K. Kakarenko, Karolina Krix-Jachym, Andrzej Kołodziejczyk, Marek Rękas
|
2024
|
View Paper |
Parallel Chords: an audio-visual analytics design for parallel coordinates
|
Elias Elmquist, Kajetan Enge, A. Rind, C. Navarra, Robert Höldrich, Michael Iber, A. Bock, A. Ynnerman, Wolfgang Aigner, N. Rönnberg
|
2024
|
View Paper |
A Design Space for Visualization with Large Scale-Item Ratios
|
Mara Solen, Tamara Munzner
|
2024
|
View Paper |
Do You See What I See? A Qualitative Study Eliciting High-Level Visualization Comprehension
|
Ghulam Jilani Quadri, Arran Zeyu Wang, Zhehao Wang, Jennifer Adorno, Paul Rosen, D. Szafir
|
2024
|
View Paper |
Decoupling Judgment and Decision Making: A Tale of Two Tails
|
Başak Oral, Pierre Dragicevic, Alexandru Telea, Evanthia Dimara
|
2023
|
View Paper |
Incidental graphical perception: How marks and display time influence accuracy
|
João Moreira, Daniel Mendes, Daniel Gonçalves
|
2023
|
View Paper |
VisLab: Enabling Visualization Designers to Gather Empirically Informed Design Feedback
|
Jinhan Choi, Changhoon Oh, Yea-Seul Kim, N. Kim
|
2023
|
View Paper |
Visual Task Performance and Spatial Abilities: An Investigation of Artists and Mathematicians
|
Sara Tandon, Alfie Abdul-Rahman, R. Borgo
|
2023
|
View Paper |
A Perception Study for Unit Charts in the Context of Large-Magnitude Data Representation
|
Yun Lin, Yi Tang, Yanfei Zhu, Fangbin Song, Wenzhe Tang
|
2023
|
View Paper |
Using Processing Fluency as a Metric of Trust in Scatterplot Visualizations
|
Hamza Elhamdadi, Lace M. K. Padilla, Cindy Xiong
|
2022
|
View Paper |
Evaluating the Use of Uncertainty Visualisations for Imputations of Data Missing At Random in Scatterplots
|
Abhraneel Sarma, Shunan Guo, J. Hoffswell, R. Rossi, F. Du, E. Koh, M. Kay
|
2022
|
View Paper |
Comparing Visual Encodings for the Task of Anomaly Detection
|
Meirav Taieb-Maimon, Eden Ya’akobi, Nevo Itzhak, Yossi Zaltsman
|
2022
|
View Paper |
Measuring Effects of Spatial Visualization and Domain on Visualization Task Performance: A Comparative Study
|
Sara Tandon, Alfie Abdul-Rahman, R. Borgo
|
2022
|
View Paper |
Investigating Perceptual Biases in Icon Arrays
|
Cindy Xiong, Ali Sarvghad, D. Goldstein, Jake M. Hofman, Çağatay Demiralp
|
2022
|
View Paper |
Research and Implementation of Colour Optimal Matching Model for Art Design Based on Bayesian Decision-Making
|
Yuwei Zhai
|
2022
|
View Paper |
Two graphs walk into a bar: Readout-based measurement reveals the Bar-Tip Limit error, a common, categorical misinterpretation of mean bar graphs
|
Sarah Kerns, J. Wilmer
|
2021
|
View Paper |
Which emphasis technique to use? Perception of emphasis techniques with varying distractors, backgrounds, and visualization types
|
Aristides Mairena, C. Gutwin, A. Cockburn
|
2021
|
View Paper |
Visualization as a stimulus domain for vision science
|
Ronald A. Rensink
|
2021
|
View Paper |
A Survey of Perception-Based Visualization Studies by Task
|
Ghulam Jilani Quadri, P. Rosen
|
2021
|
View Paper |
Design Space of Origin‐Destination Data Visualization
|
M. Tennekes, Min Chen
|
2021
|
View Paper |
Reconfiguration Strategies with Composite Data Physicalizations
|
Kim Sauvé, D.J.W. Verweij, Jason Alexander, Steven Houben
|
2021
|
View Paper |
Correlational Data Visualizations with Colored Bar Charts
|
Bdour Alwuqaysi, Alfie Abdul-Rahman, Rita Borgo
|
2024
|
View Paper |
Associating User’s Preference and Satisfaction into Quality of Experience: A Shoulder-surfing Resistant Authentication Scheme by Visual Perception
|
Juliana Mohamed, M. Fudzee, Sofia Najwa Ramli, Mohd. Norasri Ismail, Muhamad Hanif Jofri
|
2022
|
View Paper |
Comments (0)