Authors
Summary
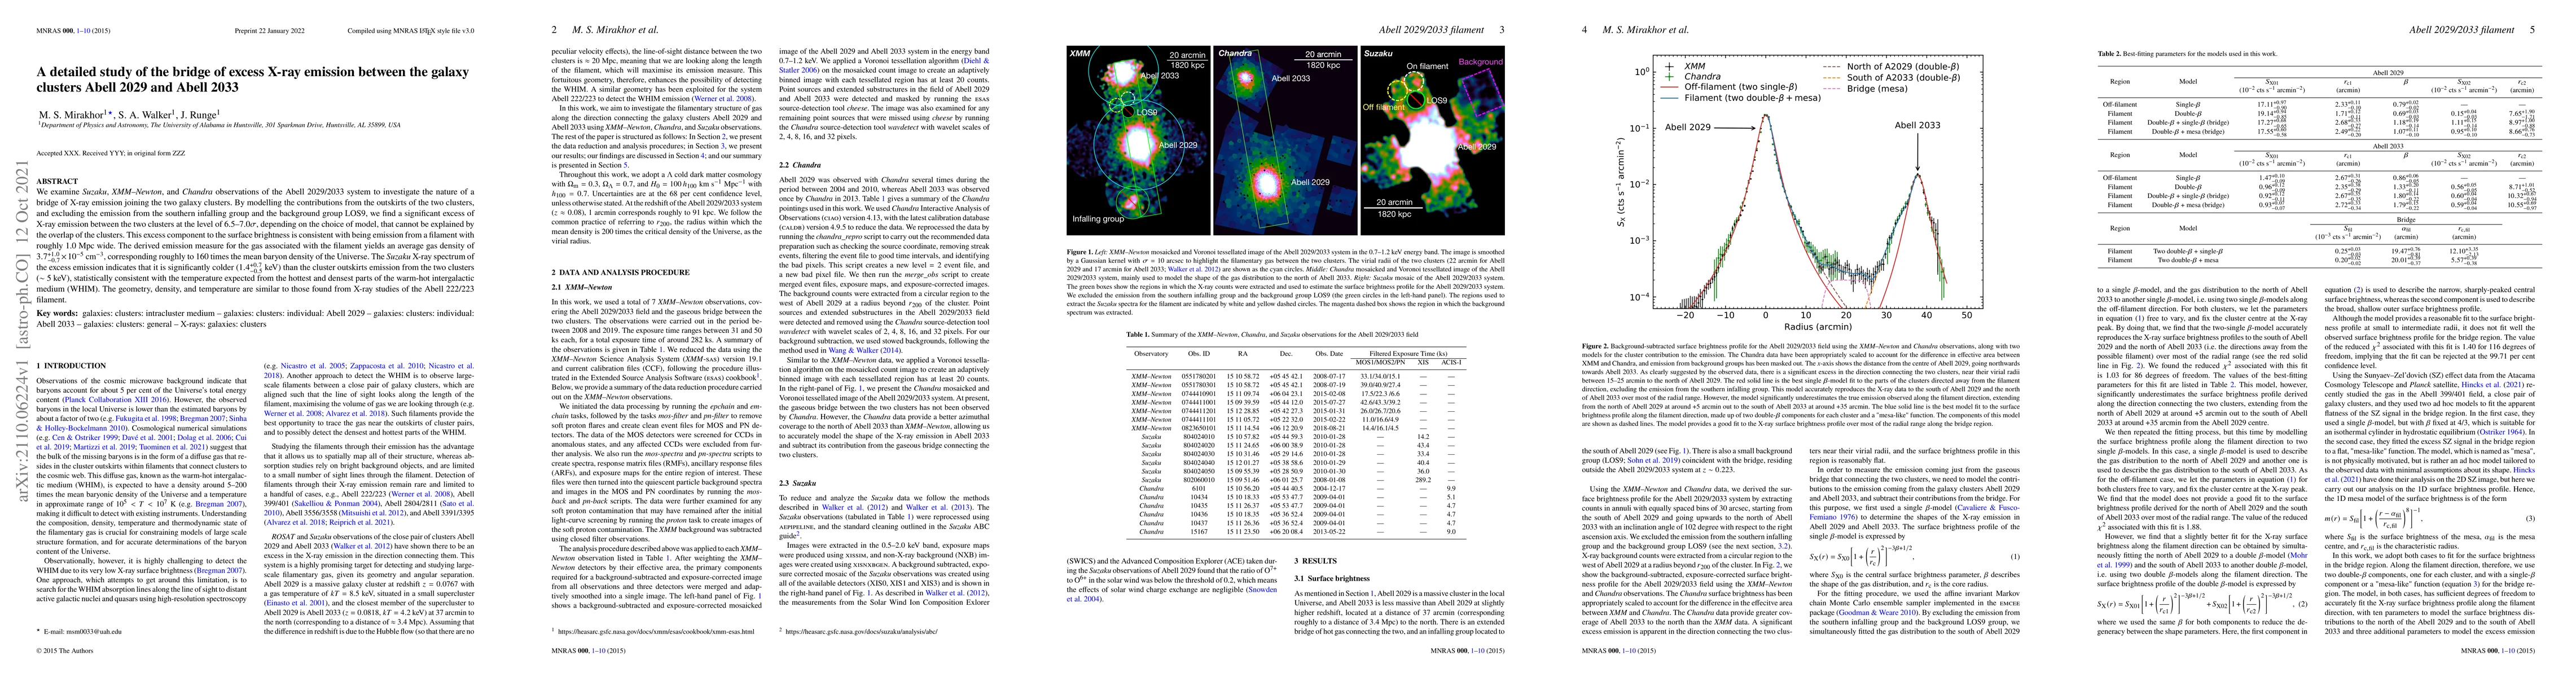
We examine Suzaku, XMM-Newton, and Chandra observations of the Abell 2029/2033 system to investigate the nature of a bridge of X-ray emission joining the two galaxy clusters. By modelling the contributions from the outskirts of the two clusters, and excluding the emission from the southern infalling group and the background group LOS9, we find a significant excess of X-ray emission between the two clusters at the level of 6.5-7.0$\sigma$, depending on the choice of model, that cannot be explained by the overlap of the clusters. This excess component to the surface brightness is consistent with being emission from a filament with roughly 1.0 Mpc wide. The derived emission measure for the gas associated with the filament yields an average gas density of $3.7^{+1.0}_{-0.7} \times 10^{-5}$ cm$^{-3}$, corresponding roughly to 160 times the mean baryon density of the Universe. The Suzaku X-ray spectrum of the excess emission indicates that it is significantly colder ($1.4_{-0.5}^{+0.7}$ keV) than the cluster outskirts emission from the two clusters ($\sim$ 5 keV), statistically consistent with the temperature expected from the hottest and densest parts of the warm-hot intergalactic medium (WHIM). The geometry, density, and temperature are similar to those found from X-ray studies of the Abell 222/223 filament.
AI Key Findings
Get AI-generated insights about this paper's methodology, results, and significance.
Paper Details
PDF Preview
Key Terms
Citation Network
Current paper (gray), citations (green), references (blue)
Display is limited for performance on very large graphs.
Similar Papers
Found 4 papers| Title | Authors | Year | Actions |
|---|
Comments (0)