A-DisETrac Advanced Analytic Dashboard for Distributed Eye Tracking
Publication
Metrics
AI Quick Summary
The paper introduces A-DisETrac, an advanced analytic dashboard for distributed eye tracking that enables real-time monitoring and analysis of multiple users' gaze behavior during collaborative tasks. Pilot studies show the system's effectiveness in correlating advanced gaze measures with collaborative performance and provides a favorable user experience.
Paper Preview
Abstract
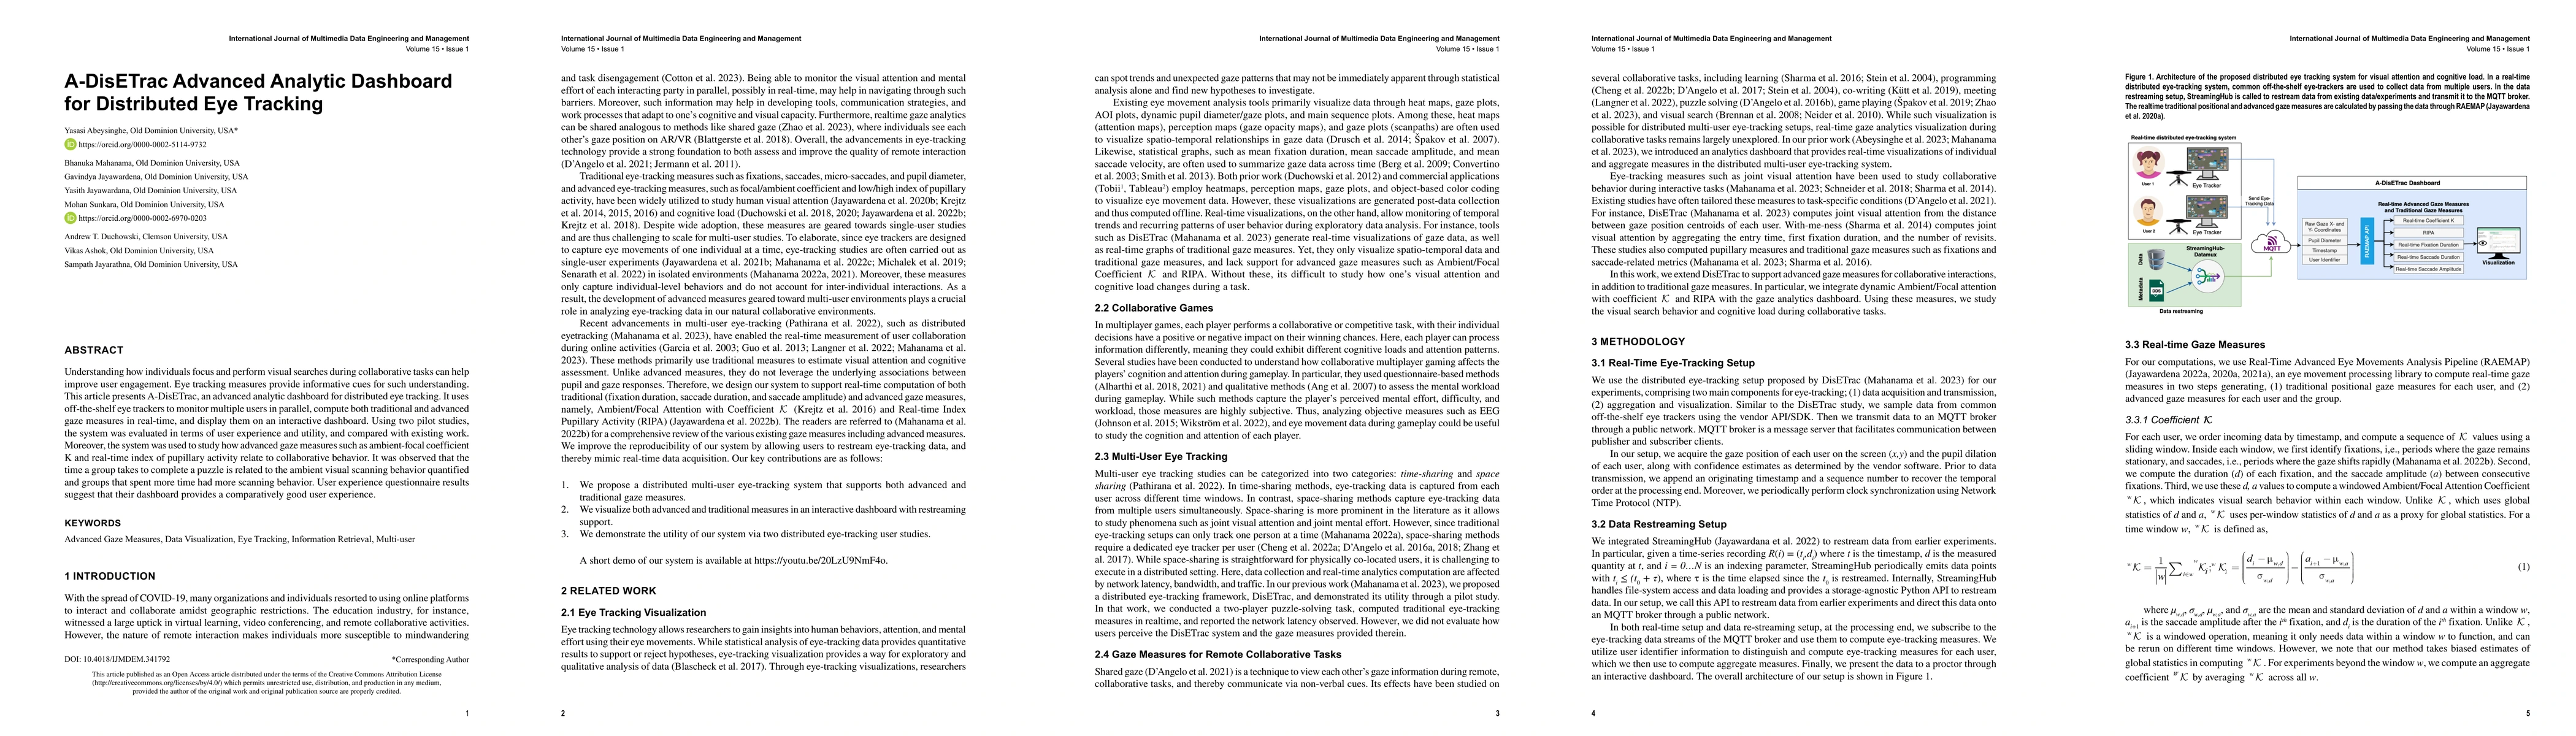
Understanding how individuals focus and perform visual searches during collaborative tasks can help improve user engagement. Eye tracking measures provide informative cues for such understanding. This article presents A-DisETrac, an advanced analytic dashboard for distributed eye tracking. It uses off-the-shelf eye trackers to monitor multiple users in parallel, compute both traditional and advanced gaze measures in real-time, and display them on an interactive dashboard. Using two pilot studies, the system was evaluated in terms of user experience and utility, and compared with existing work. Moreover, the system was used to study how advanced gaze measures such as ambient-focal coefficient K and real-time index of pupillary activity relate to collaborative behavior. It was observed that the time a group takes to complete a puzzle is related to the ambient visual scanning behavior quantified and groups that spent more time had more scanning behavior. User experience questionnaire results suggest that their dashboard provides a comparatively good user experience.
AI Key Findings
Get AI-generated insights about this paper's methodology, results, significance, and more — seven facets brought into focus.
Impact
Paper Details
Authors
PDF Preview
Key Terms
Citation Network
Current paper (gray), citations (green), references (blue)
Display is limited for performance on very large graphs.
Discussion 0