01
MethodologyHow they did it
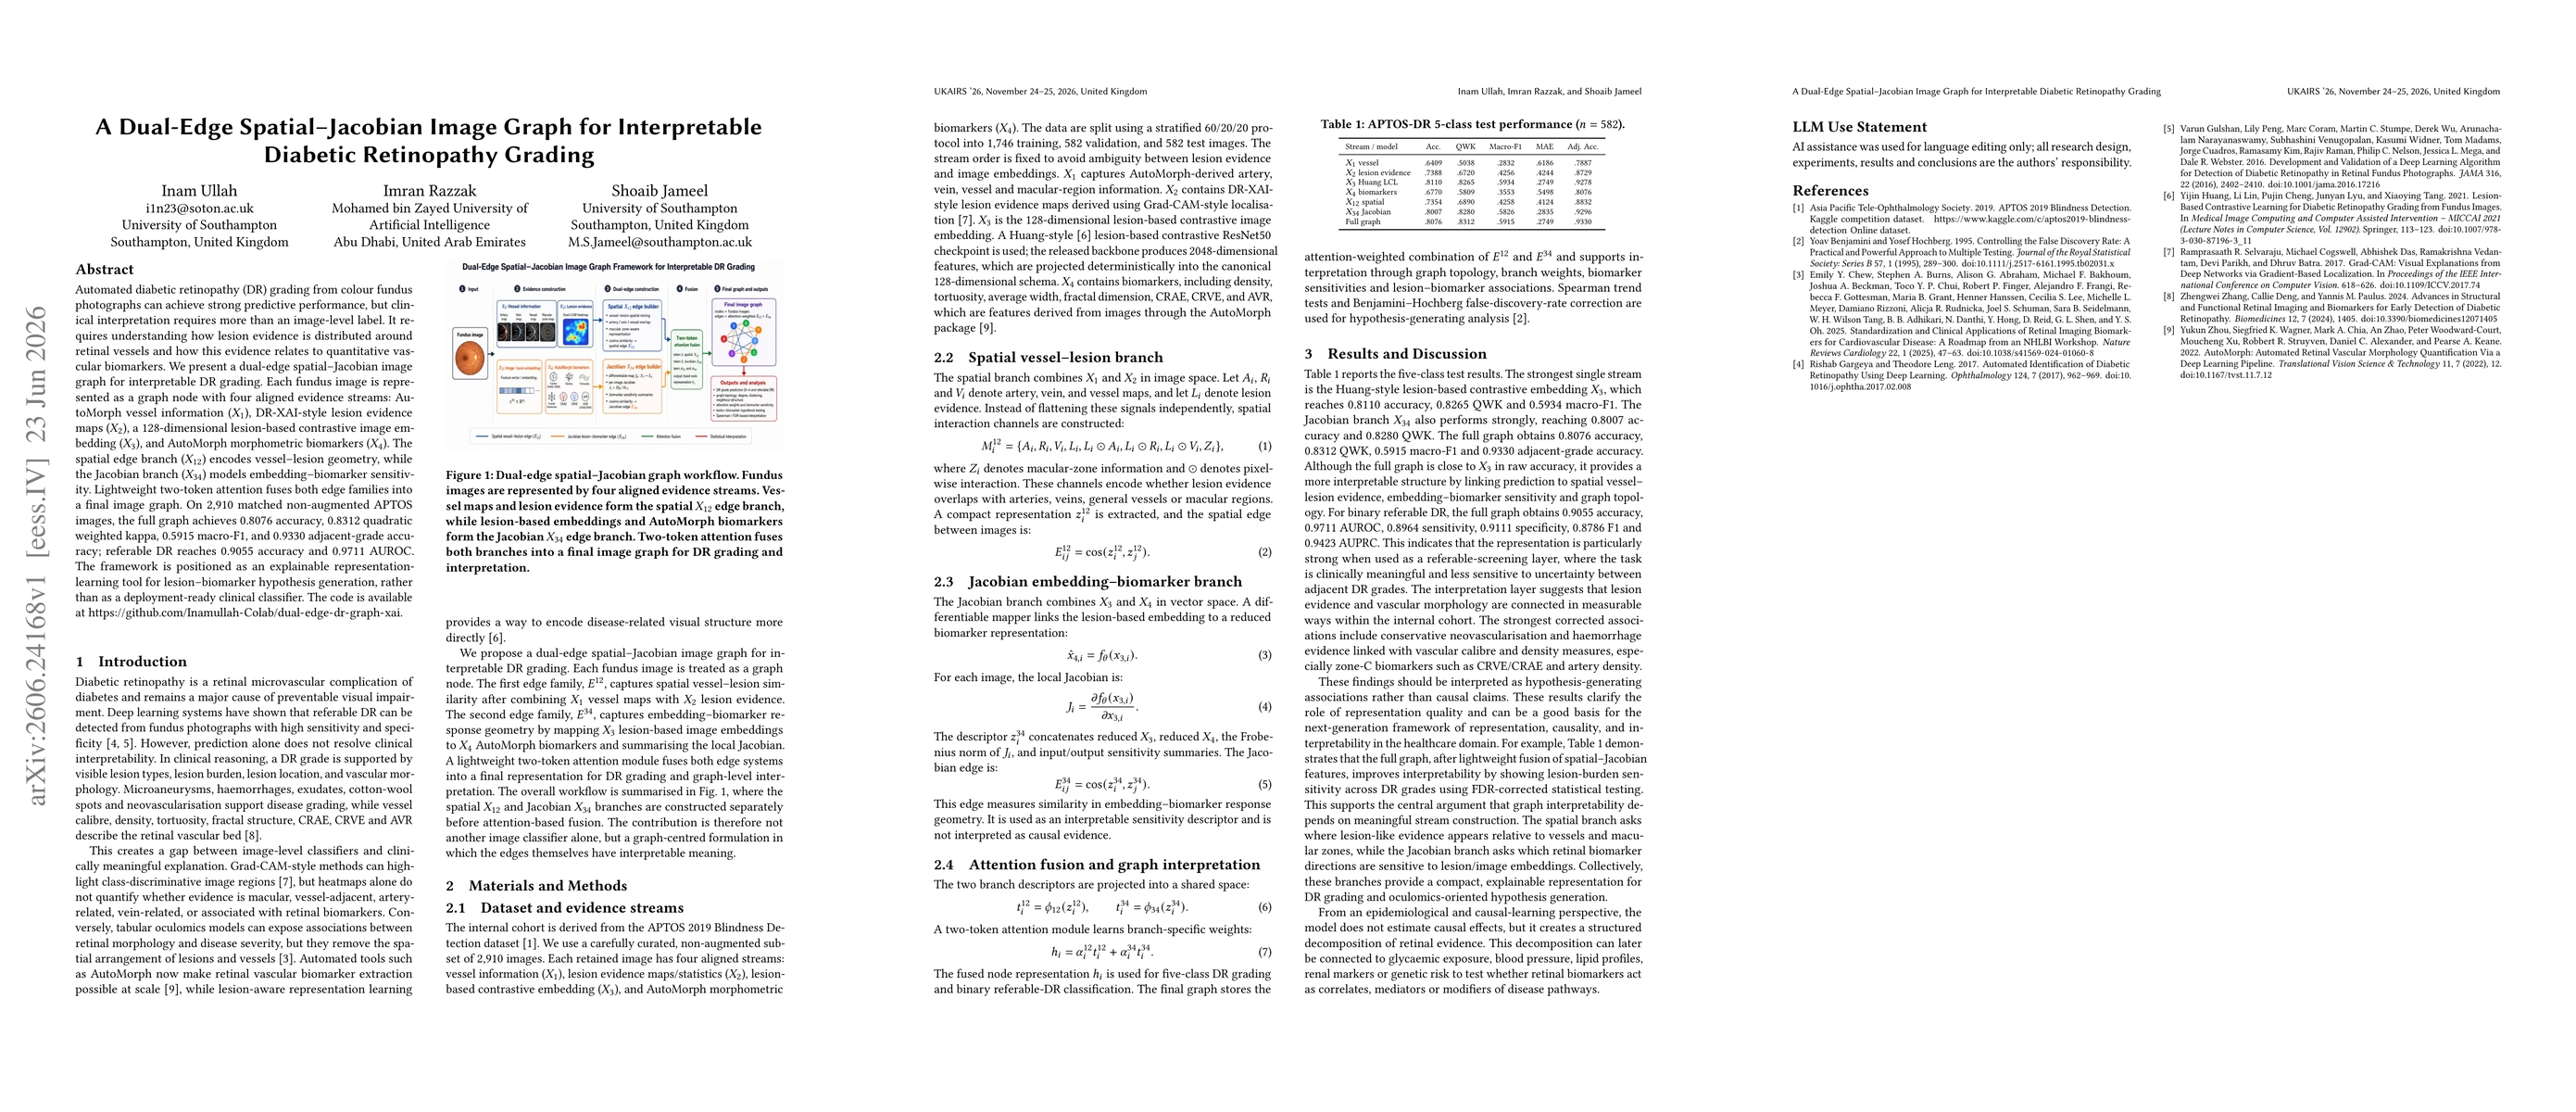
A dual-edge spatial–Jacobian image graph is constructed where each fundus image is represented as a node with four aligned evidence streams (X1 vessel info, X2 lesion evidence maps, X3 lesion-based embedding, X4 AutoMorph biomarkers). The spatial edge branch E12 fuses X1 and X2 to encode vessel–lesion geometry; the Jacobian edge branch E34 links X3 and X4 via a differentiable mapper to obtain local Jacobians and sensitivity descriptors. A lightweight two-token attention module fuses both edge families into a final image graph for DR grading and interpretation, with hypothesis-generation support for lesion–biomarker relationships rather than deployment-ready classification.
Discussion 0