A Field Study of On-Calendar Visualizations
Publication
Metrics
AI Quick Summary
An eight-week field study on an on-calendar visualization tool for feedback data showed that personal calendars can help users identify patterns and anomalies in health, sustainability, and wellness data. The research also developed a model for the behavior feedback process, identifying potential barriers for ongoing use of such tools.
Paper Preview
Abstract
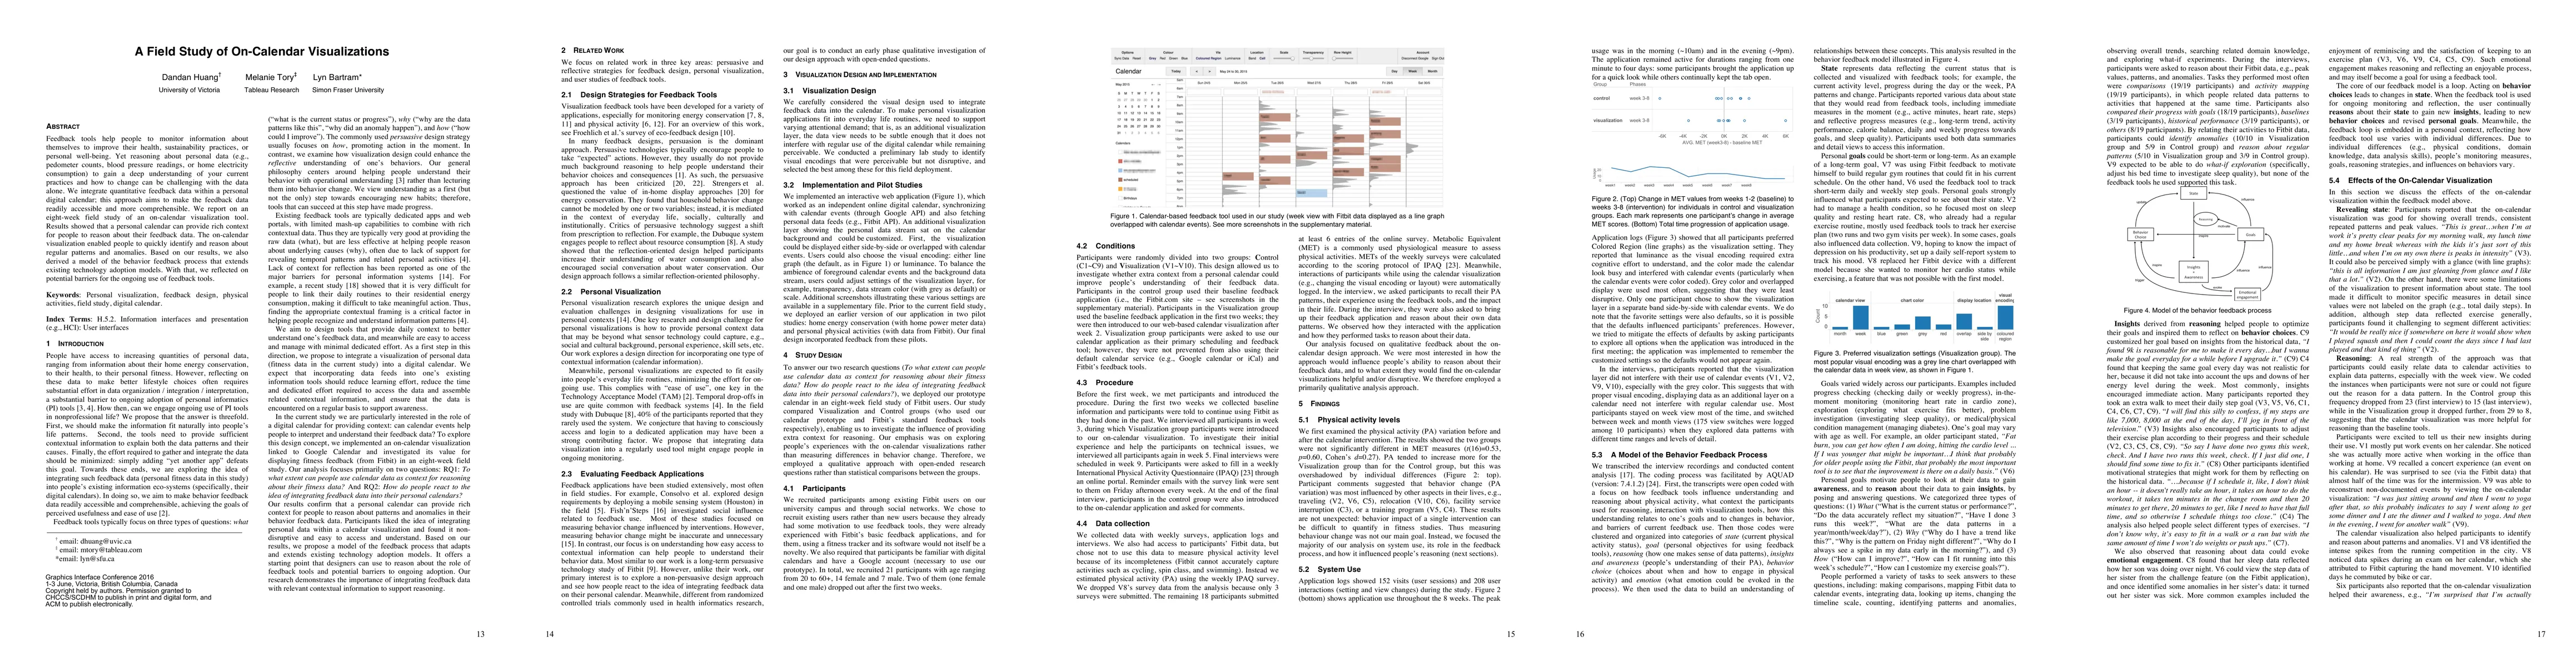
Feedback tools help people to monitor information about themselves to improve their health, sustainability practices, or personal well-being. Yet reasoning about personal data (e.g., pedometer counts, blood pressure readings, or home electricity consumption) to gain a deep understanding of your current practices and how to change can be challenging with the data alone. We integrate quantitative feedback data within a personal digital calendar; this approach aims to make the feedback data readily accessible and more comprehensible. We report on an eight-week field study of an on-calendar visualization tool. Results showed that a personal calendar can provide rich context for people to reason about their feedback data. The on-calendar visualization enabled people to quickly identify and reason about regular patterns and anomalies. Based on our results, we also derived a model of the behavior feedback process that extends existing technology adoption models. With that, we reflected on potential barriers for the ongoing use of feedback tools.
AI Key Findings
Get AI-generated insights about this paper's methodology, results, significance, and more — seven facets brought into focus.
Impact
Paper Details
PDF Preview
Key Terms
Citation Network
Current paper (gray), citations (green), references (blue)
Display is limited for performance on very large graphs.
Discussion 0