Publication
Metrics
AI Quick Summary
This paper conducts an initial econometric analysis of the CRIX family indices using a time-series framework, identifying an ARIMA(2,0,2) model for the data from August 2014 to April 2016. To address volatility clustering, the study refines the model to an ARIMA(2,0,2)-t-GARCH(1,1) process, which accounts for fat tails in financial markets, and explores interactions using multivariate GARCH models.
Paper Preview
Abstract
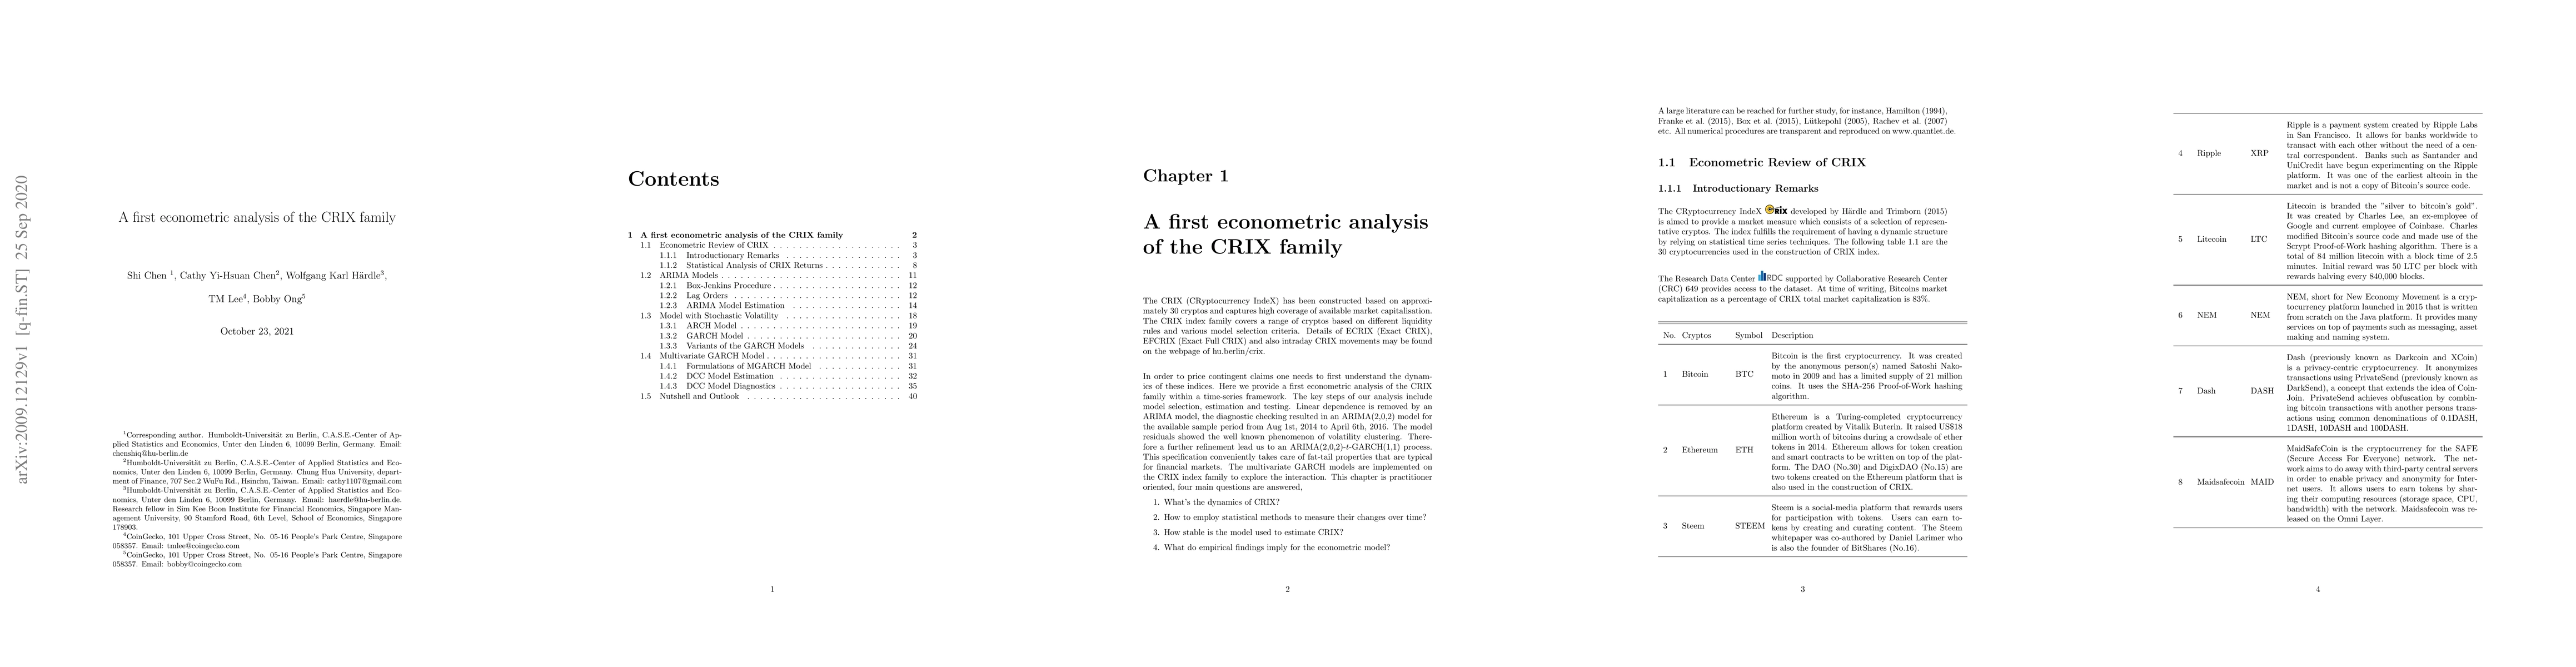
In order to price contingent claims one needs to first understand the dynamics of these indices. Here we provide a first econometric analysis of the CRIX family within a time-series framework. The key steps of our analysis include model selection, estimation and testing. Linear dependence is removed by an ARIMA model, the diagnostic checking resulted in an ARIMA(2,0,2) model for the available sample period from Aug 1st, 2014 to April 6th, 2016. The model residuals showed the well known phenomenon of volatility clustering. Therefore a further refinement lead us to an ARIMA(2,0,2)-t-GARCH(1,1) process. This specification conveniently takes care of fat-tail properties that are typical for financial markets. The multivariate GARCH models are implemented on the CRIX index family to explore the interaction.
AI Key Findings
Get AI-generated insights about this paper's methodology, results, significance, and more — seven facets brought into focus.
Impact
Paper Details
Authors
PDF Preview
Key Terms
Citation Network
Current paper (gray), citations (green), references (blue)
Display is limited for performance on very large graphs.
Discussion 0