Publication
Metrics
AI Quick Summary
This paper presents the first full-disk solar images of the Sun at 0.86 mm using ALMA, revealing quiet Sun structures similar to those observed in other wavelengths. The study finds a higher brightness temperature at the solar center and suggests that the observed flattening in brightness temperature curves indicates a proximity to the solar temperature minimum.
Paper Preview
Abstract
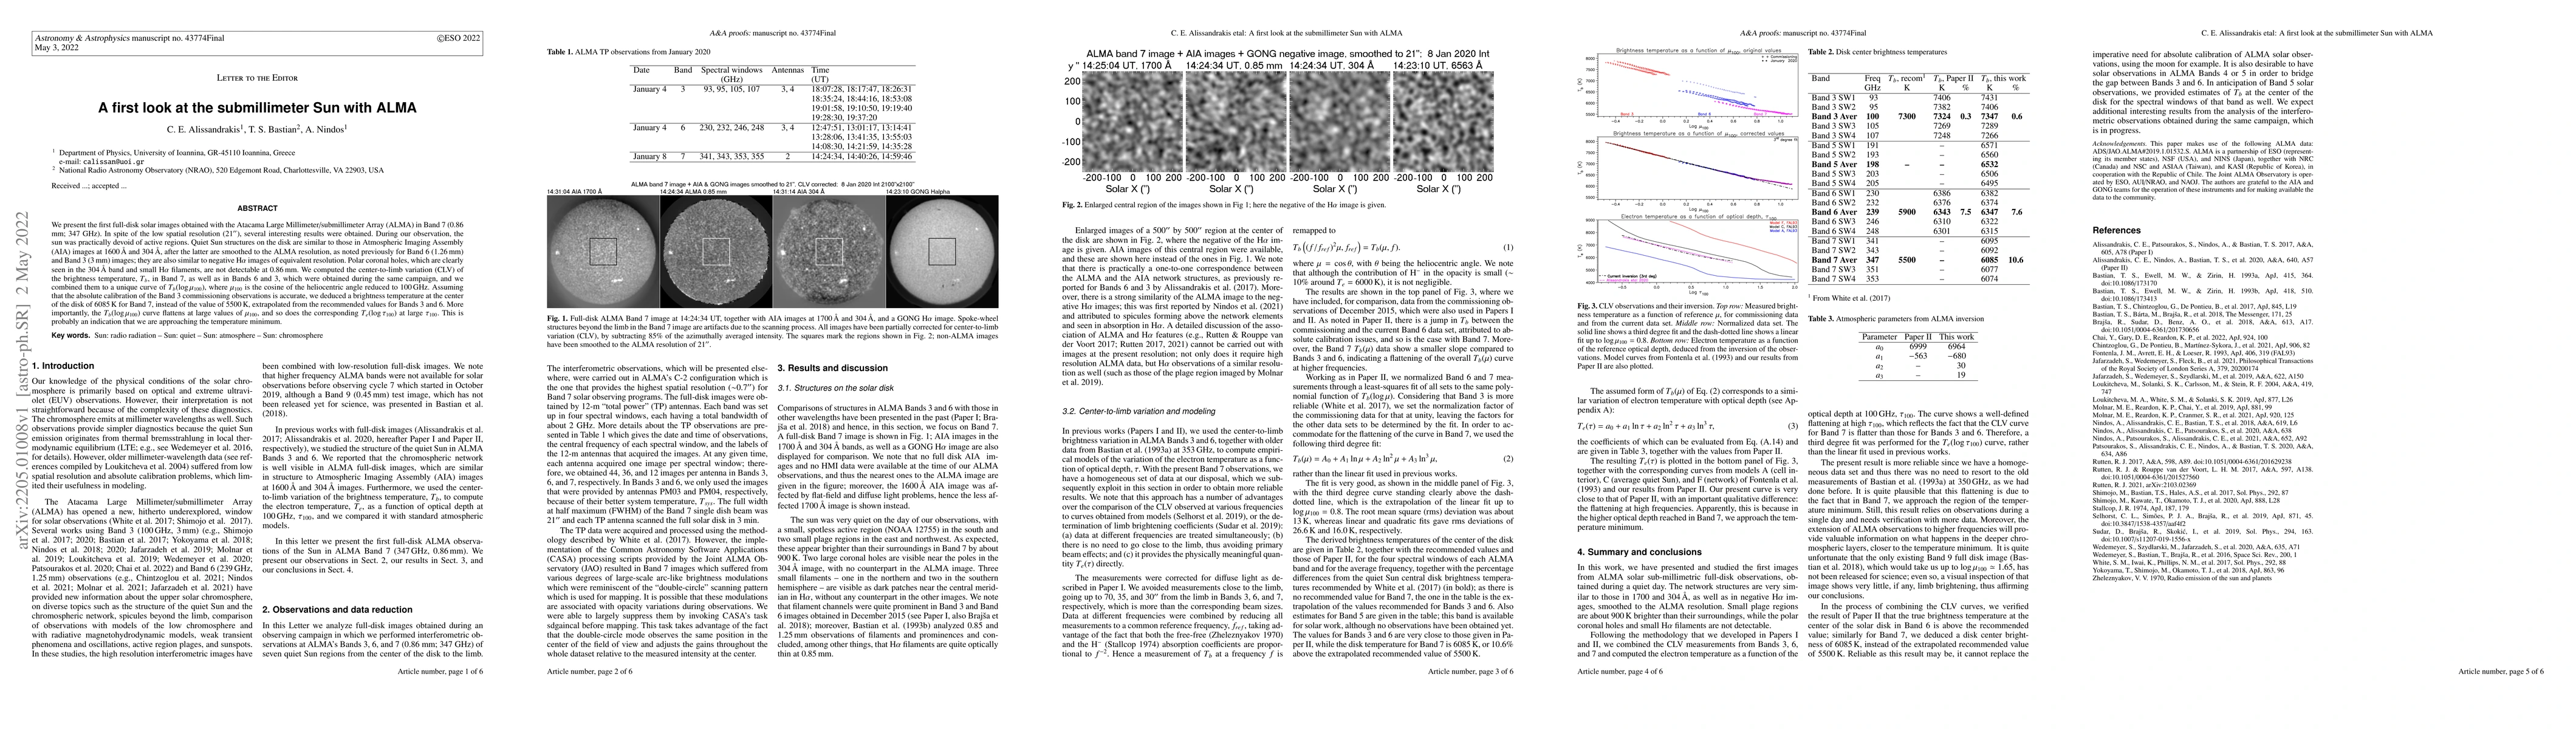
We present the first full-disk solar images obtained with the Atacama Large Millimeter/submillimeter Array (ALMA) in Band 7 (0.86 mm; 347 GHz). In spite of the low spatial resolution (21"), several interesting results were obtained. During our observation, the sun was practically devoid of active regions. Quiet Sun structures on the disk are similar to those in Atmospheric Imaging Assembly (AIA) images at 1600 A and 304 A, after the latter are smoothed to the ALMA resolution, as noted previously for Band 6 (1.26 mm) and Band 3 (3 mm) images; they are also similar to negative H$\alpha$ images of equivalent resolution. Polar coronal holes, which are clearly seen in the 304 A band and small H$\alpha$ filaments, are not detectable at 0.86 mm. We computed the center-to-limb variation (CLV) of the brightness temperature, $T_b$, in Band 7, as well as in Bands 6 and 3, which were obtained during the same campaign, and we combined them to a unique curve of $T_b(\log\mu_{100})$, where $\mu_{100}$ is the cosine of the heliocentric angle reduced to 100 GHz. Assuming that the absolute calibration of the Band 3 commissioning observations is accurate, we deduced a brightness temperature at the center of the disk of 6085 K for Band 7, instead of the value of 5500 K, extrapolated from the recommended values for Bands 3 and 6. More importantly, the $T_b(\log\mu_{100})$ curve flattens at large values of $\mu_{100}$, and so does the corresponding $T_e(\log\tau_{100})$ at large $\tau_{100}$. This is probably an indication that we are approaching the temperature minimum.
AI Key Findings
Get AI-generated insights about this paper's methodology, results, significance, and more — seven facets brought into focus.
Impact
Paper Details
Authors
PDF Preview
Key Terms
Citation Network
Current paper (gray), citations (green), references (blue)
Display is limited for performance on very large graphs.
Discussion 0