A flexible and interpretable spatial covariance model for data on graphs
Publication
Metrics
AI Quick Summary
This paper introduces a flexible spatial covariance model for graph data that accommodates complex spatial dependence patterns beyond typical adjacency assumptions. The proposed method embeds graphs in Euclidean space using network flow metrics, allowing traditional covariance functions to model spatial relationships, and demonstrates advantages over existing conditional autoregressive models through an application to bird abundance data in North Carolina.
Paper Preview
Abstract
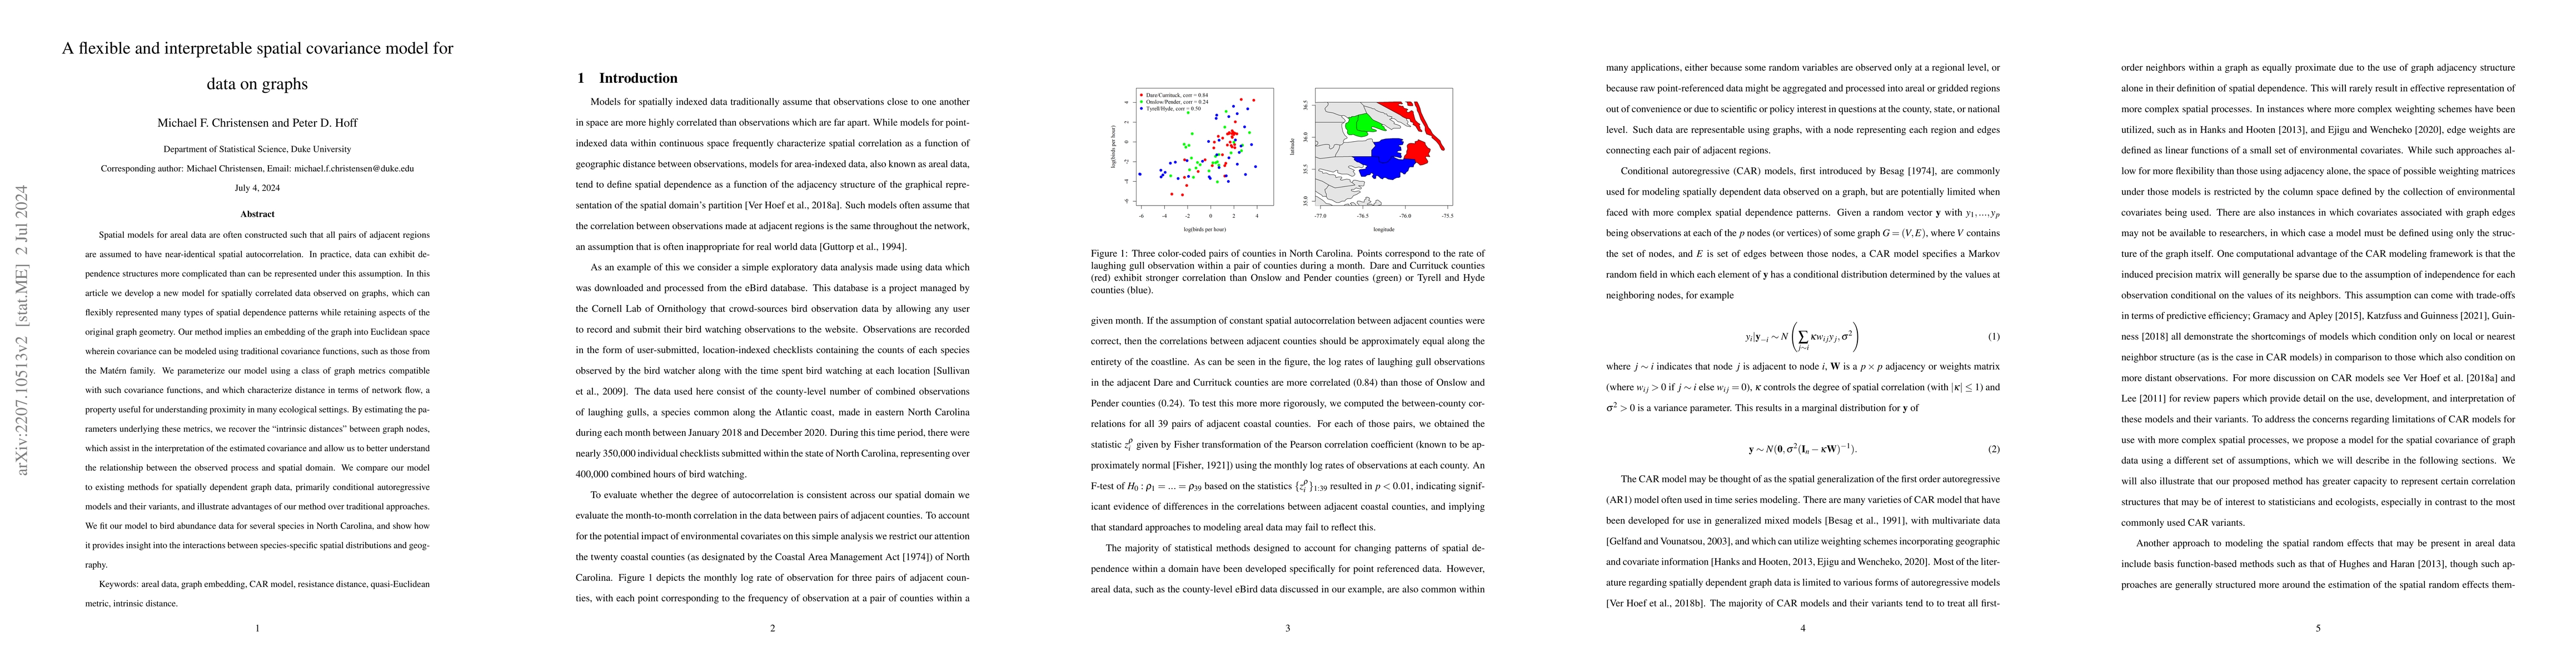
Spatial models for areal data are often constructed such that all pairs of adjacent regions are assumed to have near-identical spatial autocorrelation. In practice, data can exhibit dependence structures more complicated than can be represented under this assumption. In this article we develop a new model for spatially correlated data observed on graphs, which can flexibly represented many types of spatial dependence patterns while retaining aspects of the original graph geometry. Our method implies an embedding of the graph into Euclidean space wherein covariance can be modeled using traditional covariance functions, such as those from the Mat\'{e}rn family. We parameterize our model using a class of graph metrics compatible with such covariance functions, and which characterize distance in terms of network flow, a property useful for understanding proximity in many ecological settings. By estimating the parameters underlying these metrics, we recover the "intrinsic distances" between graph nodes, which assist in the interpretation of the estimated covariance and allow us to better understand the relationship between the observed process and spatial domain. We compare our model to existing methods for spatially dependent graph data, primarily conditional autoregressive models and their variants, and illustrate advantages of our method over traditional approaches. We fit our model to bird abundance data for several species in North Carolina, and show how it provides insight into the interactions between species-specific spatial distributions and geography.
AI Key Findings
Get AI-generated insights about this paper's methodology, results, significance, and more — seven facets brought into focus.
Impact
Paper Details
Authors
PDF Preview
Key Terms
Citation Network
Current paper (gray), citations (green), references (blue)
Display is limited for performance on very large graphs.
Discussion 0