Background
The paper addresses a practical bottleneck in data mining: as data volumes explode, extracting actionable knowledge becomes increasingly difficult for non-domain experts. While data mining techniques are mature, their effective use often hinges on specialized knowledge to select features, tune algorithms, and interpret results. The authors propose a framework that integrates autonomous intelligent agents to automate these steps and present the results in an accessible, multidimensional visualization, thus lowering the barrier to entry and enabling faster, more informed decisions.
In this context, intelligent agents are leveraged not merely as passive tools but as proactive components that interact with user profiles, remember prior activity, and coordinate among specialized modules. Prior work in automated data mining and agent-based visualization informs the architecture, but the novelty here lies in combining automated attribute selection, algorithm choice, cluster quality assessment aligned with user history, and visualization selection into a single, cohesive pipeline.
Problem / Research Question
The central problem is how to automate the core mining pipeline in a way that respects user objectives and histories, while delivering understandable results to non-experts. Key research questions include: (1) how to automatically select the most appropriate clustering technique given data types, size, and user profile; (2) how to prioritize attributes in a domain-agnostic manner; (3) how to quantify cluster quality in a way that is meaningful relative to a user’s needs; and (4) how to choose and present multidimensional visualizations that convey the discovered patterns without domain-specific interpretation.
Innovation / Contribution
The paper contributes an agent-driven framework comprising four interacting agents: a User Interface (UI) Agent, a Ranking Agent, a Data Mining Agent, and a Visualization Agent. The novelty lies in the end-to-end integration where:
- The UI Agent captures high-level objectives and leverages user history to tailor subsequent steps.
- The Ranking Agent prioritizes attributes using a scoring function, considering query weight, attribute type, and similarity relationships.
- The Data Mining Agent selects clustering algorithms (e.g., k-means, k-medoids, k-modes, CLARA, CLARANS) based on data characteristics and the ranked attributes, executes clustering, and feeds results forward.
- The Visualization Agent analyzes cluster data types and determines suitable 1D/2D/3D visual representations, ensuring that results are interpretable and actionable.
The framework also emphasizes cluster detection and quality assessment in the context of the user profile, enabling a feedback loop where results are refined over time as user history grows. The practical demonstration uses a large student dataset to show how the system can surface meaningful patterns and present them through multidimensional visualizations.
Methodology / Approach
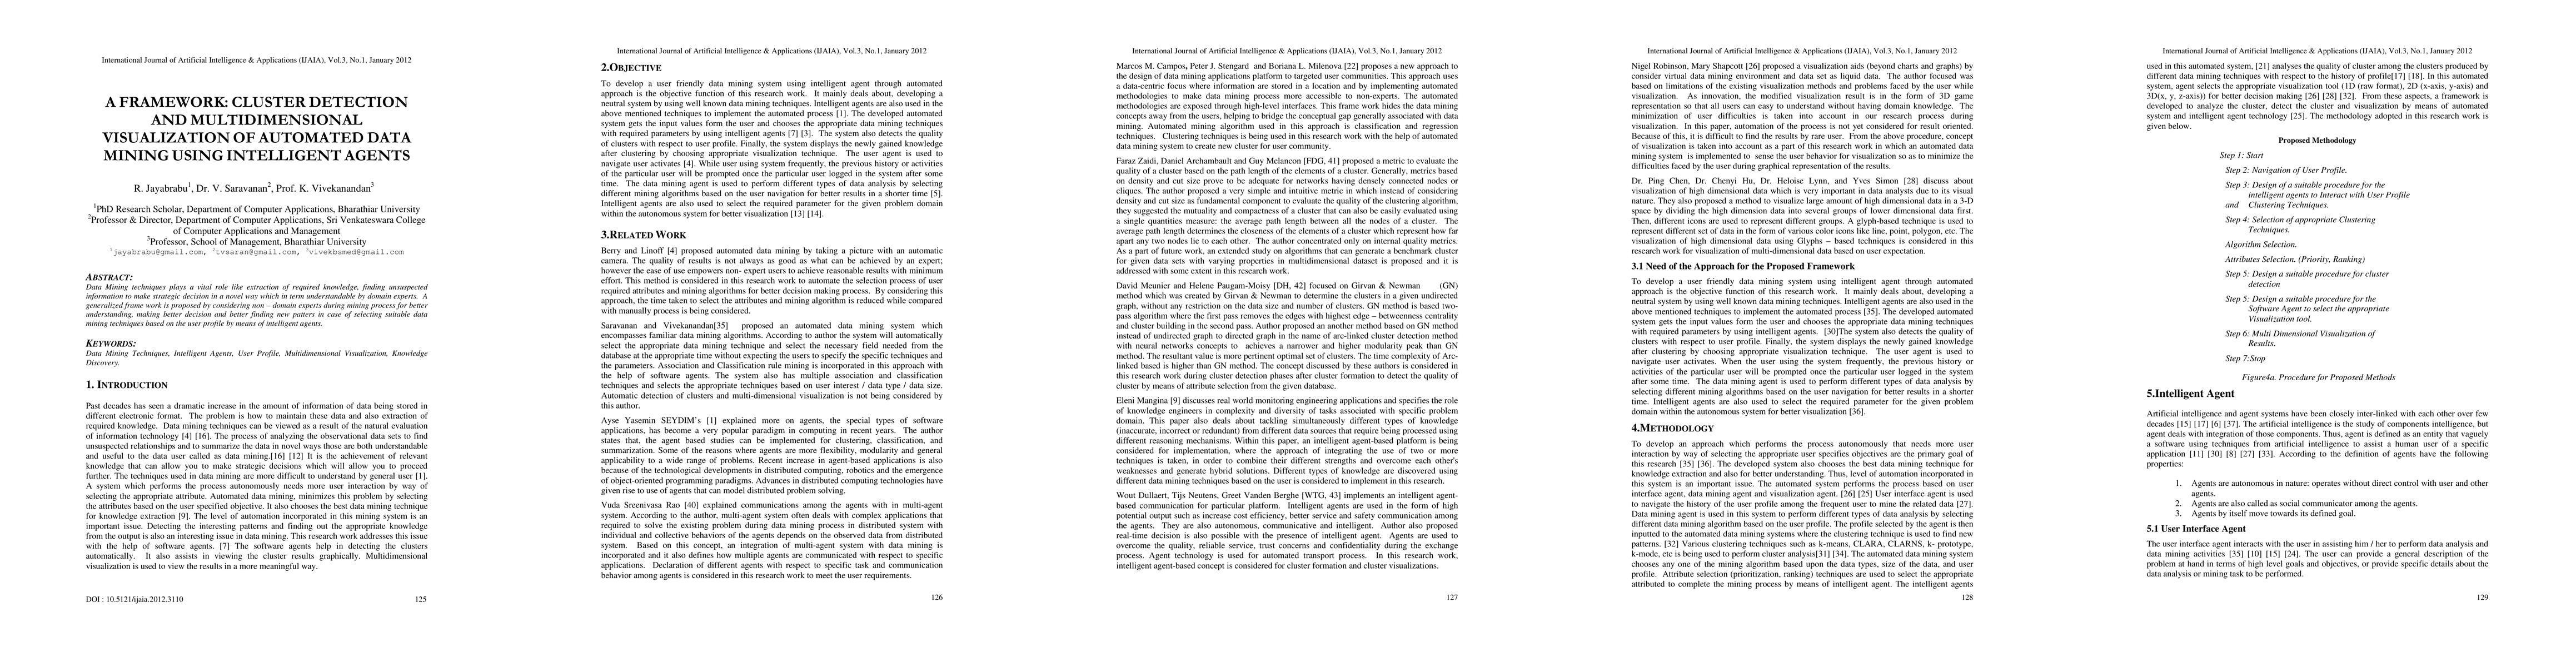
The proposed methodology unfolds as a sequence of coordinated steps driven by agents:
- Start and capture user objectives via the UI Agent.
- Check whether the user is new or returning, and retrieve or update the user history accordingly.
- Ranking Agent computes scores for attributes, classifies attribute types, and assigns weights to prioritize features for clustering.
- Data Mining Agent identifies ranked attributes, selects a suitable clustering algorithm based on data characteristics, and performs clustering (supporting a range of partitioning methods).
- Visualization Agent analyzes cluster data types, chooses suitable visualization tools (1D, 2D, or 3D), and maps attributes to appropriate visual encodings.
- Multidimensional visualization is produced to convey the results, guided by user constraints and data properties.
- Results are stored and, if appropriate, reused to inform subsequent analyses by other users.
The system relies on a student dataset with approximately 50,000 records and around 40 attributes, comprising numerical and categorical data. Clustering techniques are partitioning-based, and the approach includes attribute prioritization, cluster quality assessment, and visualization tailored to the cluster characteristics.
Experiments / Evaluation
The evaluation centers on a prototype implementation applied to a student performance dataset. The authors report that the automated agents detect clusters automatically and identify high-quality clusters that support better decision making. Visualizations include 3D glyph-based representations and link charts illustrating relationships among attributes and performance components across semesters. While explicit quantitative metrics (e.g., silhouette scores or modularity) are not provided in the excerpt, the results are presented as qualitative demonstrations of improved interpretability, reduced manual effort, and faster insight generation compared with manual workflows.
Key Results
Key outcomes include: (a) end-to-end automation of data mining tasks driven by user profiles and history; (b) automatic selection of data mining techniques and parameters; (c) cluster quality assessment aligned with user needs; (d) multidimensional visualizations that adapt to cluster characteristics (1D/2D/3D); and (e) demonstration on a substantial real-world dataset showing meaningful patterns (e.g., semester-based performance patterns) that support decision making.
Practical Applications
The framework is broadly applicable beyond the educational domain. Any scenario with heterogeneous data (mixed numeric/categorical attributes), a need for rapid pattern discovery, and a user population that benefits from guided interpretation could leverage this architecture. Potential applications include customer analytics, healthcare data exploration, financial risk assessment, and smart city analytics, where non-expert users require reliable, explainable insights delivered through intuitive visualizations.
Limitations & Considerations
Several considerations emerge from the described work. The framework’s effectiveness depends on the quality and completeness of the user history; cold-start users may experience limited personalization. The excerpt lacks explicit quantitative evaluation, leaving questions about scalability, robustness to noise or missing data, and sensitivity to parameter settings. The reliance on partitioning clustering methods suggests limitations for certain data shapes or cluster structures. Data privacy, security, and governance considerations are not elaborated, yet are critical for real-world deployment with sensitive data. Finally, while visualizations are central to interpretability, empirical validation with user studies would strengthen claims about understandability and decision impact.
Discussion 0