A Framework for Evaluating the Impact of Food Security Scenarios
Publication
Metrics
AI Quick Summary
This study proposes a framework for predicting food security impacts through scenario analysis, utilizing a Vector Autoregression model and Monte Carlo simulation. The approach is demonstrated through a case study using a proprietary food security database, revealing insights for decision-making on food prices and availability.
Paper Preview
Abstract
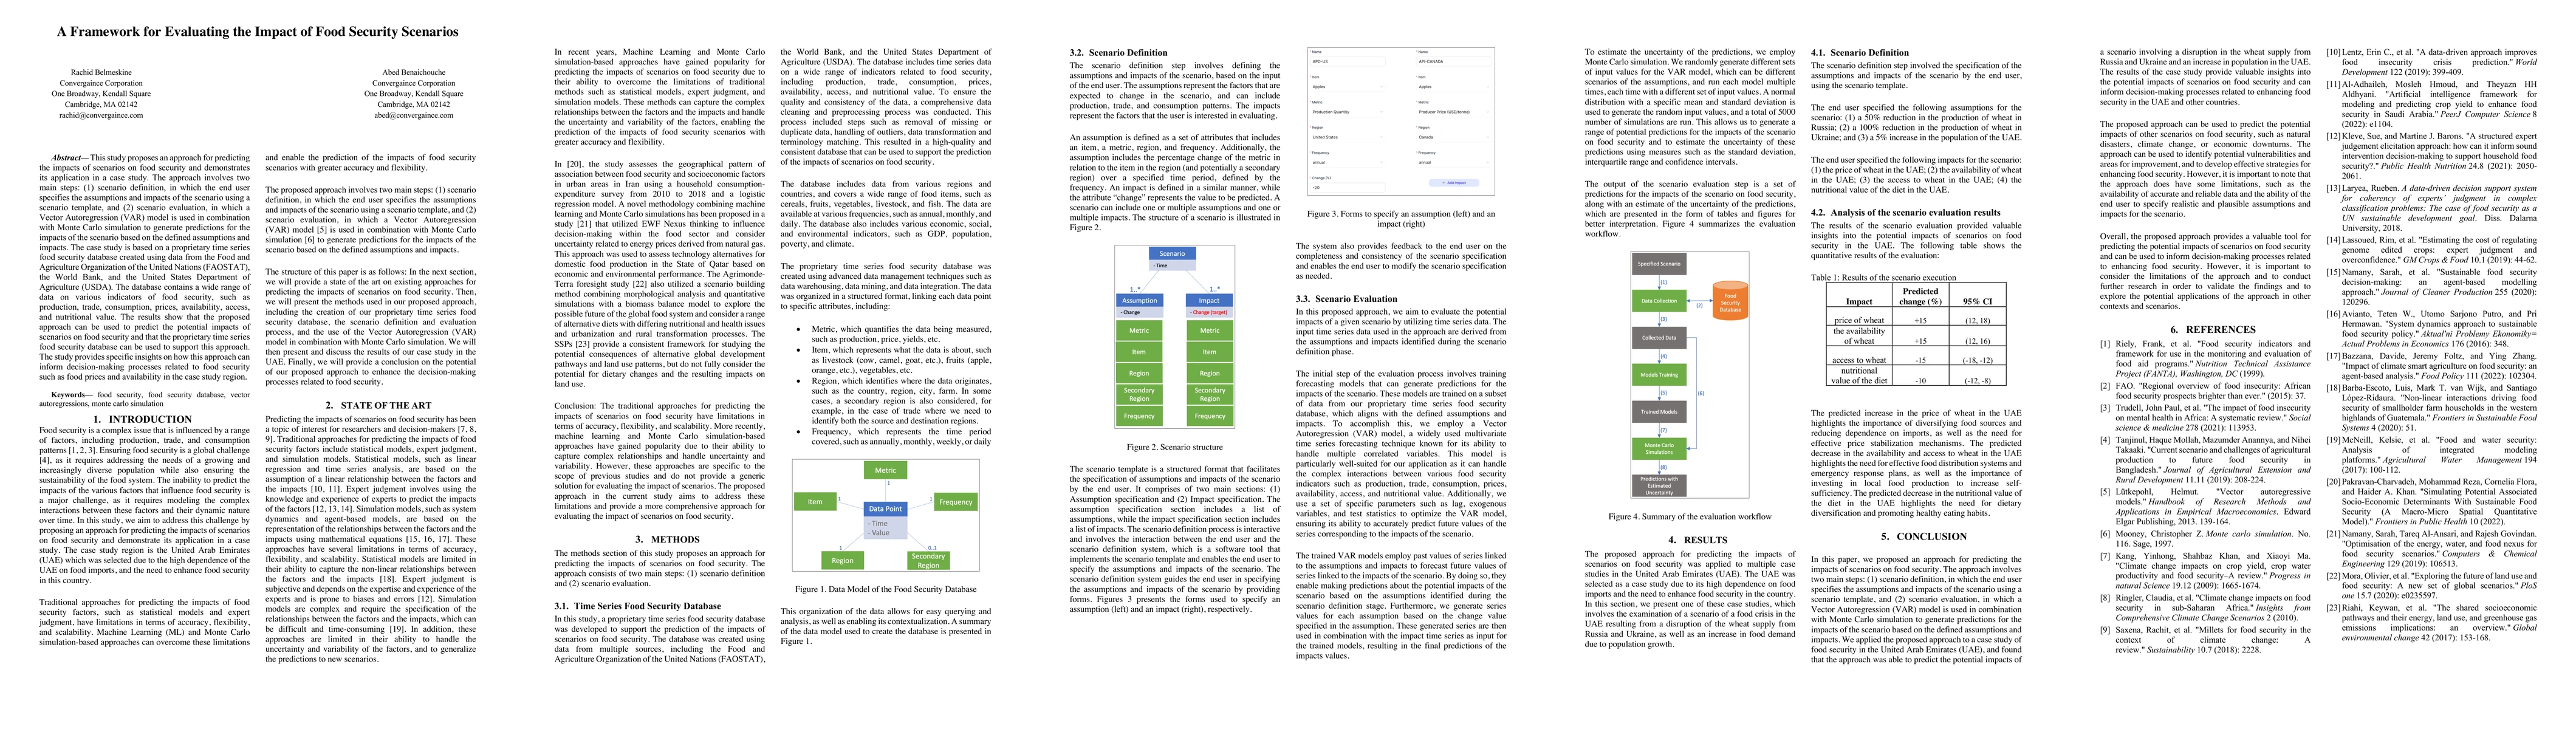
This study proposes an approach for predicting the impacts of scenarios on food security and demonstrates its application in a case study. The approach involves two main steps: (1) scenario definition, in which the end user specifies the assumptions and impacts of the scenario using a scenario template, and (2) scenario evaluation, in which a Vector Autoregression (VAR) model is used in combination with Monte Carlo simulation to generate predictions for the impacts of the scenario based on the defined assumptions and impacts. The case study is based on a proprietary time series food security database created using data from the Food and Agriculture Organization of the United Nations (FAOSTAT), the World Bank, and the United States Department of Agriculture (USDA). The database contains a wide range of data on various indicators of food security, such as production, trade, consumption, prices, availability, access, and nutritional value. The results show that the proposed approach can be used to predict the potential impacts of scenarios on food security and that the proprietary time series food security database can be used to support this approach. The study provides specific insights on how this approach can inform decision-making processes related to food security such as food prices and availability in the case study region.
AI Key Findings
Get AI-generated insights about this paper's methodology, results, significance, and more — seven facets brought into focus.
Impact
Paper Details
Authors
PDF Preview
Key Terms
Citation Network
Current paper (gray), citations (green), references (blue)
Display is limited for performance on very large graphs.
Discussion 0