This paper develops a framework to enhance the quality of neural network system diagrams based on qualitative interviews and card sorting, aiming to improve their communicative efficacy. The framework is validated through mixed-methods experiments and a corpus-based analysis of published diagrams, suggesting it effectively addresses current diagrammatic shortcomings.
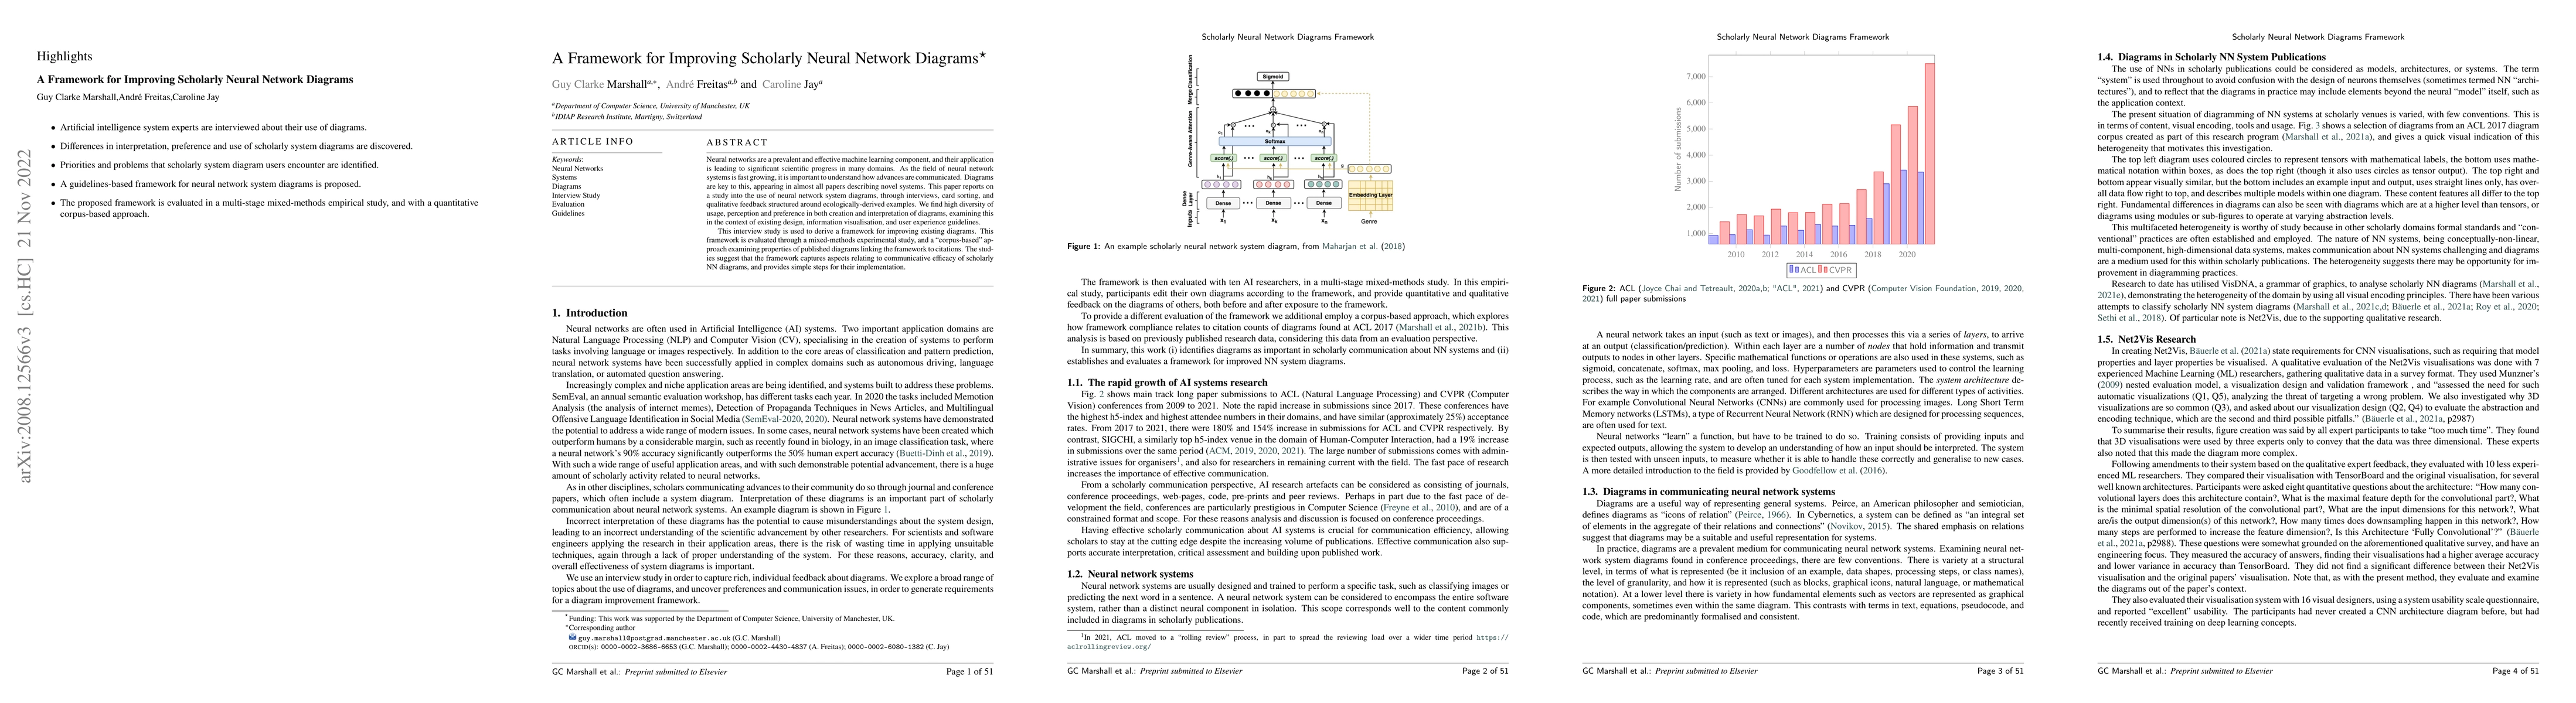
Neural networks are a prevalent and effective machine learning component, and their application is leading to significant scientific progress in many domains. As the field of neural network systems is fast growing, it is important to understand how advances are communicated. Diagrams are key to this, appearing in almost all papers describing novel systems. This paper reports on a study into the use of neural network system diagrams, through interviews, card sorting, and qualitative feedback structured around ecologically-derived examples. We find high diversity of usage, perception and preference in both creation and interpretation of diagrams, examining this in the context of existing design, information visualisation, and user experience guidelines. This interview study is used to derive a framework for improving existing diagrams. This framework is evaluated through a mixed-methods experimental study, and a ``corpus-based'' approach examining properties of published diagrams linking the framework to citations. The studies suggest that the framework captures aspects relating to communicative efficacy of scholarly NN diagrams, and provides simple steps for their implementation.
Get AI-generated insights about this paper's methodology, results, and significance.
Current paper (gray), citations (green), references (blue)
No citations found for this paper.
Title | Authors | Year | Actions |
---|---|---|---|
When Red Means Good, Bad, or Canada: Exploring People’s Reasoning for Choosing Color Palettes
|
Jarryullah Ahmad, Elaine Huynh, Fanny Chevalier
|
2021
|
View Paper |
Not just a pretty picture: Scientific fact visualisation styles, preferences, confidence and recall
|
E. Walsh, G. Sargent, W. Grant
|
2021
|
View Paper |
Structuralist analysis for neural network system diagrams
|
G. Marshall, C. Jay, A. Freitas
|
2021
|
View Paper |
Number and quality of diagrams in scholarly publications is associated with number of citations
|
G. Marshall, C. Jay, A. Freitas
|
2021
|
View Paper |
Net2Vis – A Visual Grammar for Automatically Generating Publication-Tailored CNN Architecture Visualizations
|
A. Bäuerle, Christian van Onzenoodt, T. Ropinski
|
2021
|
View Paper |
Measuring diagram quality through semiotic morphisms
|
G. Marshall, A. Freitas
|
2021
|
View Paper |
Diag2graph: Representing Deep Learning Diagrams In Research Papers As Knowledge Graphs
|
Aditi Roy, I. Akrotirianakis, Amar Viswanathan, Dmitriy Fradkin, A. Canedo, K. Koneripalli, Tugba Kulahcioglu
|
2020
|
View Paper |
How Researchers Use Diagrams in Communicating Neural Network Systems
|
G. Marshall, A. Freitas, C. Jay
|
2020
|
View Paper |
How Domain Experts Create Conceptual Diagrams and Implications for Tool Design
|
Dor Ma'ayan, Wode Ni, Katherine Q. Ye, Chinmay Kulkarni, Joshua Sunshine
|
2020
|
View Paper |
Do You Get the Picture? A Meta-Analysis of the Effect of Graphics on Reading Comprehension
|
Daibao Guo, Shuai Zhang, Katherine Landau Wright, E. McTigue
|
2020
|
View Paper |
Cognitive Linguistics
|
P. Chilton
|
2019
|
View Paper |
Deep neural networks outperform human expert's capacity in characterizing bioleaching bacterial biofilm composition
|
A. Buetti-Dinh, Vanni Galli, Sören Bellenberg, Olga Ilie, Malte Herold, Stephan Christel, M. Boretska, I. Pivkin, P. Wilmes, W. Sand, M. Vera, Mark Dopson
|
2019
|
View Paper |
A Systematic Literature Review of Research-Derived Touchscreen Design Guidelines for Older Adults
|
L. Nurgalieva, Juan José Jara Laconich, Marcos Báez, F. Casati, M. Marchese
|
2019
|
View Paper |
NN-SVG: Publication-Ready Neural Network Architecture Schematics
|
A. LeNail
|
2019
|
View Paper |
A systematic literature review of software visualization evaluation
|
Leonel Merino, Mohammad Ghafari, C. Anslow, Oscar Nierstrasz
|
2018
|
View Paper |
AI Superpowers: China, Silicon Valley, and the New World Order
|
Kai-Fu Lee
|
2018
|
View Paper |
Picturing Science: Design Patterns in Graphical Abstracts
|
J. Hullman, Benjamin Bach
|
2018
|
View Paper |
Association for Information Science and Technology
|
D. Sonnenwald, Charles H. Davis, Debora Shaw
|
2017
|
View Paper |
DLPaper2Code: Auto-generation of Code from Deep Learning Research Papers
|
Akshay Sethi, A. Sankaran, Naveen Panwar, Shreya Khare, Senthil Mani
|
2017
|
View Paper |
Design and evaluation of line symbolizations for origin–destination flow maps
|
Caglar Koylu, Diansheng Guo
|
2017
|
View Paper |
Chunk-based Decoder for Neural Machine Translation
|
Shonosuke Ishiwatari, Jingtao Yao, Shujie Liu, Mu Li, M. Zhou, Naoki Yoshinaga, M. Kitsuregawa, Weijia Jia
|
2017
|
View Paper |
Deep Multitask Learning for Semantic Dependency Parsing
|
Hao Peng, Sam Thomson, Noah A. Smith
|
2017
|
View Paper |
Untersuchungen zur Lehre von der Gestalt
|
M. Wertheimer
|
2017
|
View Paper |
A Progressive Learning Approach to Chinese SRL Using Heterogeneous Data
|
Qiaolin Xia, Lei Sha, Baobao Chang, Zhifang Sui
|
2017
|
View Paper |
Keeping up to date: An academic researcher's information journey
|
S. Pontis, A. Blandford, Elke Greifeneder, Hesham Attalla, David Neal
|
2017
|
View Paper |
Systematic methodological review: developing a framework for a qualitative semi-structured interview guide.
|
Hanna Kallio, A. Pietilä, Martin Johnson, M. Kangasniemi
|
2016
|
View Paper |
Data graphs and mechanistic explanation.
|
Daniel C. Burnston
|
2016
|
View Paper |
Qualitative HCI Research: Going Behind the Scenes
|
A. Blandford, D. Furniss, S. Makri
|
2016
|
View Paper |
What recent research on diagrams suggests about learning with rather than learning from visual representations in science
|
Christine D. Tippett
|
2016
|
View Paper |
The work that visualisation conventions do
|
H. Kennedy, R. Hill, G. Aiello, W. Allen
|
2016
|
View Paper |
Semantic Properties of Diagrams and Their Cognitive Potentials
|
Atsushi Shimojima
|
2015
|
View Paper |
Cybernetics: From Past to Future
|
D. Novikov
|
2015
|
View Paper |
On the Semantic Transparency of Visual Notations: Experiments with UML
|
A. E. Kouhen, Abdelouahed Gherbi, C. Dumoulin, F. Khendek
|
2015
|
View Paper |
“Concreteness fading” promotes transfer of mathematical knowledge
|
Nicole M. McNeil, Emily R. Fyfe
|
2012
|
View Paper |
Philosophical reflections on diagram models and diagrammatic representation
|
Koray Karaca
|
2012
|
View Paper |
Professional status and expertise for UML class diagram comprehension: An empirical study
|
Z. Soh, Zohreh Sharafi, Bertrand Van den Plas, Gerardo Cepeda Porras, Yann-Gaël Guéhéneuc, G. Antoniol
|
2012
|
View Paper |
Publication guidelines need widespread adoption.
|
E. Larson, Manuel Cortazal
|
2012
|
View Paper |
Making sense of business process descriptions: An experimental comparison of graphical and textual notations
|
Avner Ottensooser, A. Fekete, H. Reijers, J. Mendling, C. Menictas
|
2012
|
View Paper |
Writing Science: How to Write Papers That Get Cited and Proposals That Get Funded
|
J. Schimel
|
2011
|
View Paper |
Adapting UML Activity Diagrams for Mobile Work Process Modelling: Experimental Comparison of Two Notation Alternatives
|
S. Gopalakrishnan, J. Krogstie, Guttorm Sindre
|
2010
|
View Paper |
Visual syntax does matter: improving the cognitive effectiveness of the i* visual notation
|
D. Moody, P. Heymans, Raimundas Matulevičius
|
2010
|
View Paper |
Guidelines on the aesthetic quality of UML class diagrams
|
Holger Eichelberger, Klaus Schmid
|
2009
|
View Paper |
A Nested Model for Visualization Design and Validation
|
T. Munzner
|
2009
|
View Paper |
The “Physics” of Notations: Toward a Scientific Basis for Constructing Visual Notations in Software Engineering
|
D. Moody
|
2009
|
View Paper |
Expectation (and attention) in visual cognition
|
C. Summerfield, T. Egner
|
2009
|
View Paper |
EPC vs. UML Activity Diagram - Two Experiments Examining their Usefulness for Requirements Engineering
|
Anne Gross, Jörg Dörr
|
2009
|
View Paper |
Uses of figures and tables from scholarly journal articles in teaching and research
|
Robert J. Sandusky, C. Tenopir, Margaret M. Casado
|
2008
|
View Paper |
Informational Aesthetics Measures
|
Jaume Rigau, M. Feixas, M. Sbert
|
2008
|
View Paper |
Interactive Digital Television: Technologies and Applications
|
Yolanda Blanco-Fernández, M. Springett
|
2007
|
View Paper |
Information graphics: an untapped resource for digital libraries
|
S. Carberry, S. Schwartz, Seniz Demir
|
2006
|
View Paper |
Graphic elicitation: using research diagrams as interview stimuli
|
N. Crilly, A. Blackwell, P. Clarkson
|
2006
|
View Paper |
Arrows in Comprehending and Producing Mechanical Diagrams
|
Julie Heiser, B. Tversky
|
2006
|
View Paper |
The value of visualization
|
J. V. Wijk
|
2005
|
View Paper |
Material anchors for conceptual blends
|
E. Hutchins
|
2005
|
View Paper |
Writing for academic journals
|
R. Murray
|
2004
|
View Paper |
Commentary for Academic Writing for Graduate Students: Essential Tasks and Skills
|
J. Swales, Christine B. Feak
|
2004
|
View Paper |
Diagram Schemas: What, Why, How
|
R. Futrelle
|
2004
|
View Paper |
Why Diagrams Are (Sometimes) Six Times Easier than Words: Benefits beyond Locational Indexing
|
P. Cheng
|
2004
|
View Paper |
The transfer of abstract principles governing complex adaptive systems
|
Robert L. Goldstone, Yasuaki Sakamoto
|
2003
|
View Paper |
Image as Text. Aspects of the shared visual language of scientific conference participants
|
Elizabeth Rowley-Jolivet
|
2000
|
View Paper |
How to write a paper
|
Oded Goldreich
|
2000
|
View Paper |
Taking the visual turn in research and scholarly communication key issues in developing a more visually literate (social) science
|
L. Pauwels
|
2000
|
View Paper |
Effective Diagrammatic Communication: Syntactic, Semantic and Pragmatic Issues
|
C. Gurr
|
1999
|
View Paper |
The effect of graphic style on data model interpretation
|
J. Nordbotten, M. Crosby
|
1999
|
View Paper |
Evidence for abstract, schematic knowledge of three spatial diagram representations
|
L. R. Novick, Sean M. Hurley, Melissa Francis
|
1999
|
View Paper |
The Extended Mind
|
A. Clark, D. Chalmers
|
1998
|
View Paper |
What do architects and students perceive in their design sketches? A protocol analysis
|
M. Suwa, B. Tversky
|
1997
|
View Paper |
The eyes have it: a task by data type taxonomy for information visualizations
|
B. Shneiderman
|
1996
|
View Paper |
How a Cockpit Remembers Its Speeds
|
E. Hutchins
|
1995
|
View Paper |
Why looking isn't always seeing: readership skills and graphical programming
|
M. Petre
|
1995
|
View Paper |
Logic and the complexity of reasoning
|
H. Levesque
|
1988
|
View Paper |
Why a Diagram is (Sometimes) Worth Ten Thousand Words
|
J. Larkin, H. Simon
|
1987
|
View Paper |
Mental Models: Towards a Cognitive Science of Language, Inference, and Consciousness
|
M. Ford, P. Johnson-Laird
|
1985
|
View Paper |
The measurement of observer agreement for categorical data.
|
J. Landis, G. Koch
|
1977
|
View Paper |
On the Failure to Eliminate Hypotheses in a Conceptual Task
|
P. Wason
|
1960
|
View Paper |
visualizations. IEEE transactions on visualization and computer graphics
|
2021
|
||
Scholarly AI system diagrams as an access point to mental models
|
G. Marshall, C. Jay, A. Freitas
|
2021
|
View Paper |
Net2vis software
|
2021
|
||
Cvpr 2021 provisional accepts
|
2021
|
||
Understanding scholarly Natural Language Processing system diagrams through application of VisDNA
|
2021
|
||
A pattern language for the design of diagrams
|
2021
|
||
Neural network diagram interview transcripts
|
2020
|
||
Diagrammatic signification of artificial intelligence systems
|
2020
|
||
ACL2020: General conference statistics
|
2020
|
||
International workshop on semantic evaluation: Tasks
|
2020
|
||
Nvivo qualitative data analysis software
|
2020
|
||
Computer Vision Foundation
|
2020
|
||
Chi '20: Post-program committee update
|
2019
|
||
Tools-to-Design-or-Visualize-Architecture-of-Neural-Network
|
2019
|
||
User interface guidelines for Tablet PC Arabic educational applications
|
Ahmed Al-Sa’di
|
2018
|
View Paper |
A Genre-Aware Attention Model to Improve the Likability Prediction of Books
|
Suraj Maharjan, M. Montes-y-Gómez, F. González, T. Solorio
|
2018
|
View Paper |
Diagrammatic reasoning Abstraction , interaction , and insight
|
K. Tyléna, R. Fusarolia, J. S. Bjørndahla, czaszek-Leonardic, S. Østergaarda, F. Stjernfeltd
|
2015
|
View Paper |
Writing for Computer Science
|
J. Zobel
|
2014
|
View Paper |
Visual Mathematics and Cyberlearning in View of Affordance and Activity Theories
|
D. Martinovic, V. Freiman, Z. Karadag
|
2013
|
View Paper |
Visualizing the Invisible: Generating Explanations of Scientific Phenomena
|
Eliza Bobek
|
2013
|
View Paper |
Chapter 22 – UX Design Guidelines
|
R. Hartson, Partha S. Pyla
|
2012
|
View Paper |
Types of Design Guidance for iTV Applications
|
T. Kunert
|
2009
|
View Paper |
A quantitative evaluation of the relative status of journal and conference publications in computer science
|
J. Freyne, Lorcan Coyle, Barry Smyth, P. Cunningham
|
2008
|
View Paper |
Card Sorting : Current Practices and Beyond
|
Jed R. Wood
|
2008
|
View Paper |
The Knowledge Book: Science and technology studies
|
Steffen Staab
|
2007
|
View Paper |
Guidelines for Designing Easy-to-Use Interactive Television Services: Experiences from the ArviD Programme
|
A. Ahonen, Laura Turkki, Marjukka Saarijärvi, M. Lahti, Tytti Virtanen
|
2007
|
View Paper |
What Makes a Good Diagram? Improving the Cognitive Effectiveness of Diagrams in IS Development
|
D. Moody
|
2006
|
View Paper |
Do Children Need Concrete Instantiations to Learn an Abstract Concept
|
A. Heckler, Jennifer A. Kaminski, V. Sloutsky
|
2006
|
View Paper |
semi-structured interview guide. Journal of advanced nursing
|
2006
|
||
Uml class diagrams: an empirical study of comprehension, in: Software Visualization
|
2003
|
||
Information Visualization and Visual Data Mining
|
D. Keim
|
2002
|
View Paper |
Visual Literacy in Teaching and Learning: A Literature Perspective
|
Suzanne P. Stokes
|
2002
|
View Paper |
Why Are Some Diagrams Easier to Work With? : Effects of Diagrammatic Representation on the Cognitive Integration Process of Systems Analysis and Design
|
Jungpil Hahn, Jinwoo Kim
|
1999
|
View Paper |
ASSESSING DIAGRAM QUALITY: MAKING A DIFFERENCE TO REPRESENTATION
|
Carmel M. Diezmann
|
1999
|
View Paper |
A Cognitive Theory of Graphical and Linguistic Reasoning: Logic and Implementation
|
K. Stenning, J. Oberlander
|
1995
|
View Paper |
Representations in Distributed Cognitive Tasks
|
Jiajie Zhang, D. Norman
|
1994
|
View Paper |
Envisioning information. volume 126
|
1990
|
||
Standards versus guidelines for designing user interface software
|
Sidney L. Smith
|
1986
|
View Paper |
Some aspects of comprehension of technical diagrams: an intercultural study
|
J. Deręgowski, S. Dziurawiec
|
1986
|
View Paper |
Meeting of the Association for Computational Linguistics (Volume 1: Long Papers), pp. 1901–1912
|
1983
|
||
Psychology of Reasoning: Structure and Content
|
P. Wason, P. Johnson-Laird
|
1972
|
View Paper |
The collected papers of Charles S
|
1966
|
||
The Qualitative
|
Muriah Umoquit, Peggy Tso, Tünde Varga-Atkins, Mark O’Brien, Johannes Wheeldon
|
View Paper | |
Please Scroll down for Article Qualitative Research in Psychology Using Thematic Analysis in Psychology
|
Virginia Braun, Victoria Clarke
|
View Paper | |
Interact'99 Workshop ." Making Designers Aware of Existing Guidelines for Accessibility Evaluation of Guidelines for Designing Accessible Web Content
|
C. Colwell, H. Petrie
|
View Paper | |
Why We Need Many Knowledge Representation Formalisms
|
A. Sloman
|
View Paper | |
Scholarly Neural Network Diagrams Framework
|
Showing first page preview. Click "Open Full PDF" to view the complete paper.
Your comment contains inappropriate language and has been rejected.
Are you sure you want to remove this tag? This action cannot be undone.
Someone just favorited a paper!
Comments (0)