This paper introduces a fraud detection system that uses radial drawings and heat-maps to visualize employee activity patterns and identify potential fraud. The system employs a multi-layer radial visualization and animations to highlight suspicious activity based on preprocessed data and decision trees.
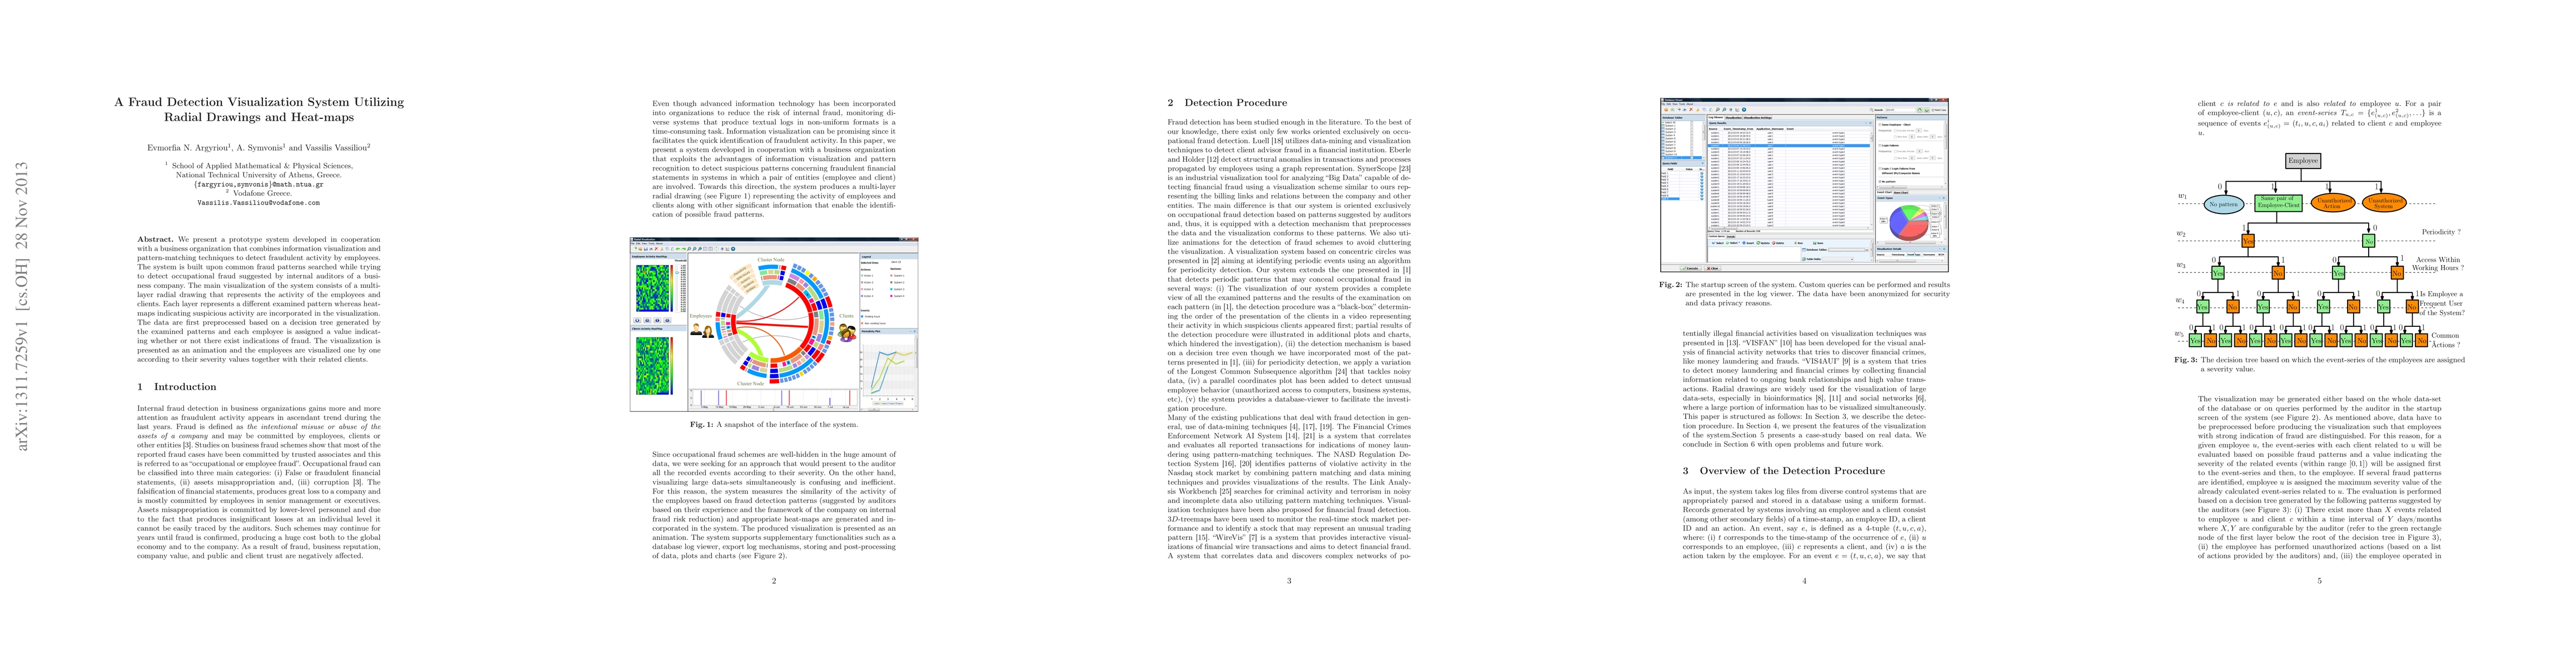
We present a prototype system developed in cooperation with a business organization that combines information visualization and pattern-matching techniques to detect fraudulent activity by employees. The system is built upon common fraud patterns searched while trying to detect occupational fraud suggested by internal auditors of a business company. The main visualization of the system consists of a multi-layer radial drawing that represents the activity of the employees and clients. Each layer represents a different examined pattern whereas heat-maps indicating suspicious activity are incorporated in the visualization. The data are first preprocessed based on a decision tree generated by the examined patterns and each employee is assigned a value indicating whether or not there exist indications of fraud. The visualization is presented as an animation and the employees are visualized one by one according to their severity values together with their related clients.
Get AI-generated insights about this paper's methodology, results, and significance.
Current paper (gray), citations (green), references (blue)
Yulu Gong, Shuning Huo, Mengran Zhu et al.
Daniel Schlör, Andreas Hotho, Anna Krause et al.
Title | Authors | Year | Actions |
---|---|---|---|
The Impact of Augmented Reality (AR) and Virtual Reality (VR) on Virtual Banking and Consumer Experience
|
Sonia Pal
|
2024
|
View Paper |
The power of big data affordances to reshape anti-fraud strategies
|
Gianluca Gabrielli, Carlotta Magri, Alice Medioli, Pier Luigi Marchini
|
2024
|
View Paper |
ATOVis – A visualisation tool for the detection of financial fraud
|
Catarina Maçãs, Evgheni Polisciuc, P. Machado
|
2022
|
View Paper |
Financial fraud detection: the use of visualization techniques in credit card fraud and money laundering domains
|
M. Lokanan
|
2022
|
View Paper |
A Heterogeneous Graph-based Fraudulent Community Detection System
|
Anting Zhang, Bin Wu, Yinsheng Li
|
2021
|
View Paper |
Visualisation Tool to Support Fraud Detection
|
Pedro Silva, Catarina Maçãs, Evgheni Polisciuc, P. Machado
|
2021
|
View Paper |
InfoBehavior: Self-supervised Representation Learning for Ultra-long Behavior Sequence via Hierarchical Grouping
|
Runshi Liu, Pengda Qin, Yuhong Li, Weigao Wen, Dong Li, Kefeng Deng, Qiang Wu
|
2021
|
View Paper |
Fraud Audit Based on Visual Analysis: A Process Mining Approach
|
Jorge-Félix Rodríguez-Quintero, Alexander Sánchez-Díaz, Leonel Iriarte-Navarro, A. Maté, Manuel Marco-Such, J. Trujillo
|
2021
|
View Paper |
Scenario-Based Requirements Elicitation for User-Centric Explainable AI - A Case in Fraud Detection
|
Douglas Cirqueira, D. Nedbal, M. Helfert, Marija Bezbradica
|
2020
|
View Paper |
Hybrid Graph Visualizations With ChordLink: Algorithms, Experiments, and Applications
|
Lorenzo Angori, W. Didimo, F. Montecchiani, Daniele Pagliuca, Alessandra Tappini
|
2020
|
View Paper |
NEVA: Visual Analytics to Identify Fraudulent Networks
|
R. Leite, T. Gschwandtner, S. Miksch, Erich Gstrein, Johannes Kuntner
|
2020
|
View Paper |
Visual querying and analysis of temporal fiscal networks
|
W. Didimo, L. Grilli, G. Liotta, F. Montecchiani, Daniele Pagliuca
|
2019
|
View Paper |
ChordLink: A New Hybrid Visualization Model
|
Lorenzo Angori, W. Didimo, F. Montecchiani, Daniele Pagliuca, Alessandra Tappini
|
2019
|
View Paper |
Visual Analytics of Anomalous User Behaviors: A Survey
|
Yang Shi, Yuyin Liu, Hanghang Tong, Jingrui He, Gang Yan, Nan Cao
|
2019
|
View Paper |
Parallel hierarchies: A visualization for cross-tabulating hierarchical categories
|
Zana Vosough, Marius Hogräfer, Loïc Royer, Rainer Groh, Hans-Jörg Schulz
|
2018
|
View Paper |
Profiling distributed graph processing systems through visual analytics
|
Alessio Arleo, W. Didimo, G. Liotta, F. Montecchiani
|
2018
|
View Paper |
A visual analytics system to support tax evasion discovery
|
W. Didimo, Luca Giamminonni, G. Liotta, F. Montecchiani, Daniele Pagliuca
|
2018
|
View Paper |
GiViP: A Visual Profiler for Distributed Graph Processing Systems
|
Alessio Arleo, W. Didimo, G. Liotta, F. Montecchiani
|
2017
|
View Paper |
Incremental Outlier Detection Modelling Using Streaming Analytics in Finance & Health Care
|
C. Priyanka, Vivek
|
2023
|
View Paper |
ATOVis—a Visualization Tool for the Detection of Financial Fraud
|
2022
|
View Paper | |
Schematics of Graphs and Hypergraphs
|
Till Bruckdorfer
|
2016
|
View Paper |
Comments (0)