Summary
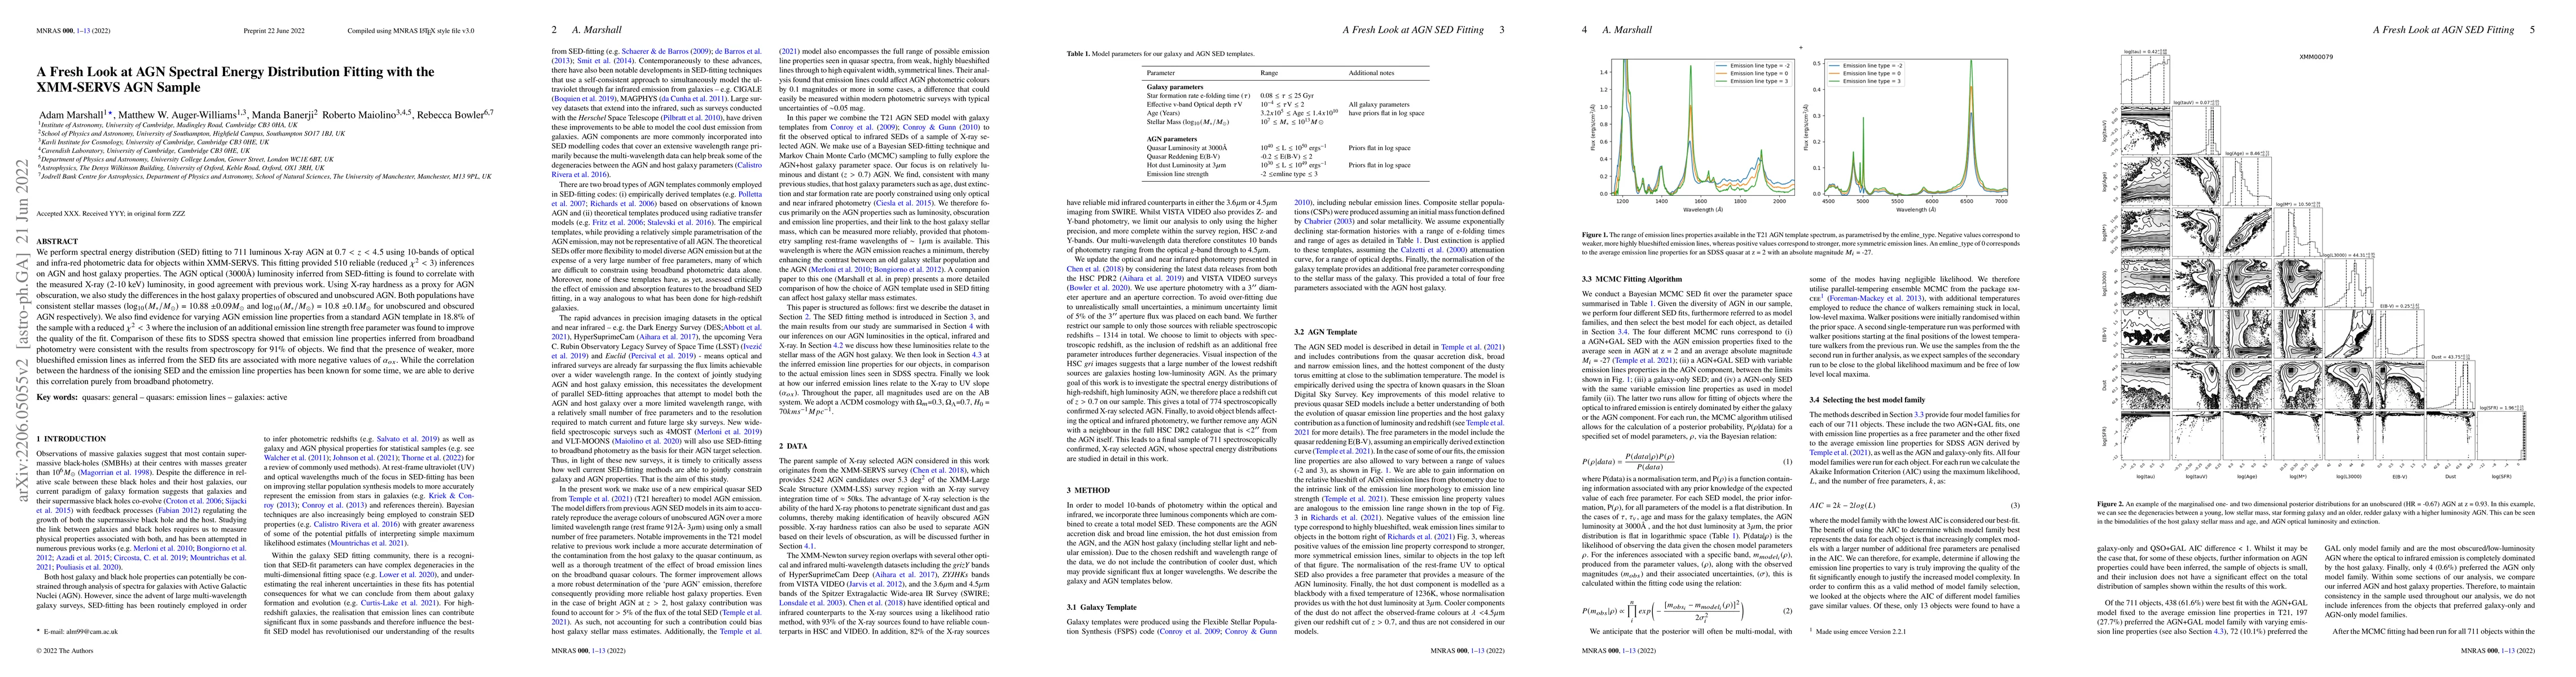
We perform spectral energy distribution (SED) fitting to 711 luminous X-ray AGN at 0.7 < z < 4.5 using 10-bands of optical and infra-red photometric data for objects within XMM-SERVS. This fitting provided 510 reliable (reduced $\chi ^2 < 3$) inferences on AGN and host galaxy properties. The AGN optical (3000\r{A}) luminosity inferred from SED-fitting is found to correlate with the measured X-ray (2-10 keV) luminosity, in good agreement with previous work. Using X-ray hardness as a proxy for AGN obscuration, we also study the differences in the host galaxy properties of obscured and unobscured AGN. Both populations have consistent stellar masses (log$_{10}(M_*/M_{\odot})$ = 10.88 $\pm0.09M_\odot$ and log$_{10}(M_*/M_{\odot})$ = 10.8 $\pm0.1M_\odot$ for unobscured and obscured AGN respectively). We also find evidence for varying AGN emission line properties from a standard AGN template in 18.8% of the sample with a reduced $\chi^2 < 3$ where the inclusion of an additional emission line strength free parameter was found to improve the quality of the fit. Comparison of these fits to SDSS spectra showed that emission line properties inferred from broadband photometry were consistent with the results from spectroscopy for 91% of objects. We find that the presence of weaker, more blueshifted emission lines as inferred from the SED fits are associated with more negative values of $\alpha_{ox}$. While the correlation between the hardness of the ionising SED and the emission line properties has been known for some time, we are able to derive this correlation purely from broadband photometry.
AI Key Findings
Get AI-generated insights about this paper's methodology, results, and significance.
Paper Details
PDF Preview
Key Terms
Citation Network
Current paper (gray), citations (green), references (blue)
Display is limited for performance on very large graphs.
Similar Papers
Found 4 papers| Title | Authors | Year | Actions |
|---|
Comments (0)