A General Framework of Brain Region Detection And Genetic Variants Selection in Imaging Genetics
Publication
Metrics
AI Quick Summary
This paper introduces a new statistical framework for imaging genetics, employing Canonical Correlation Analysis to jointly model brain imaging, genetic data, and clinical phenotypes. The method addresses high-dimensional "big data squared" challenges and preserves spatial information, ultimately detecting significant brain regions and genetic variants associated with cognitive function using UK Biobank data.
Paper Preview
Abstract
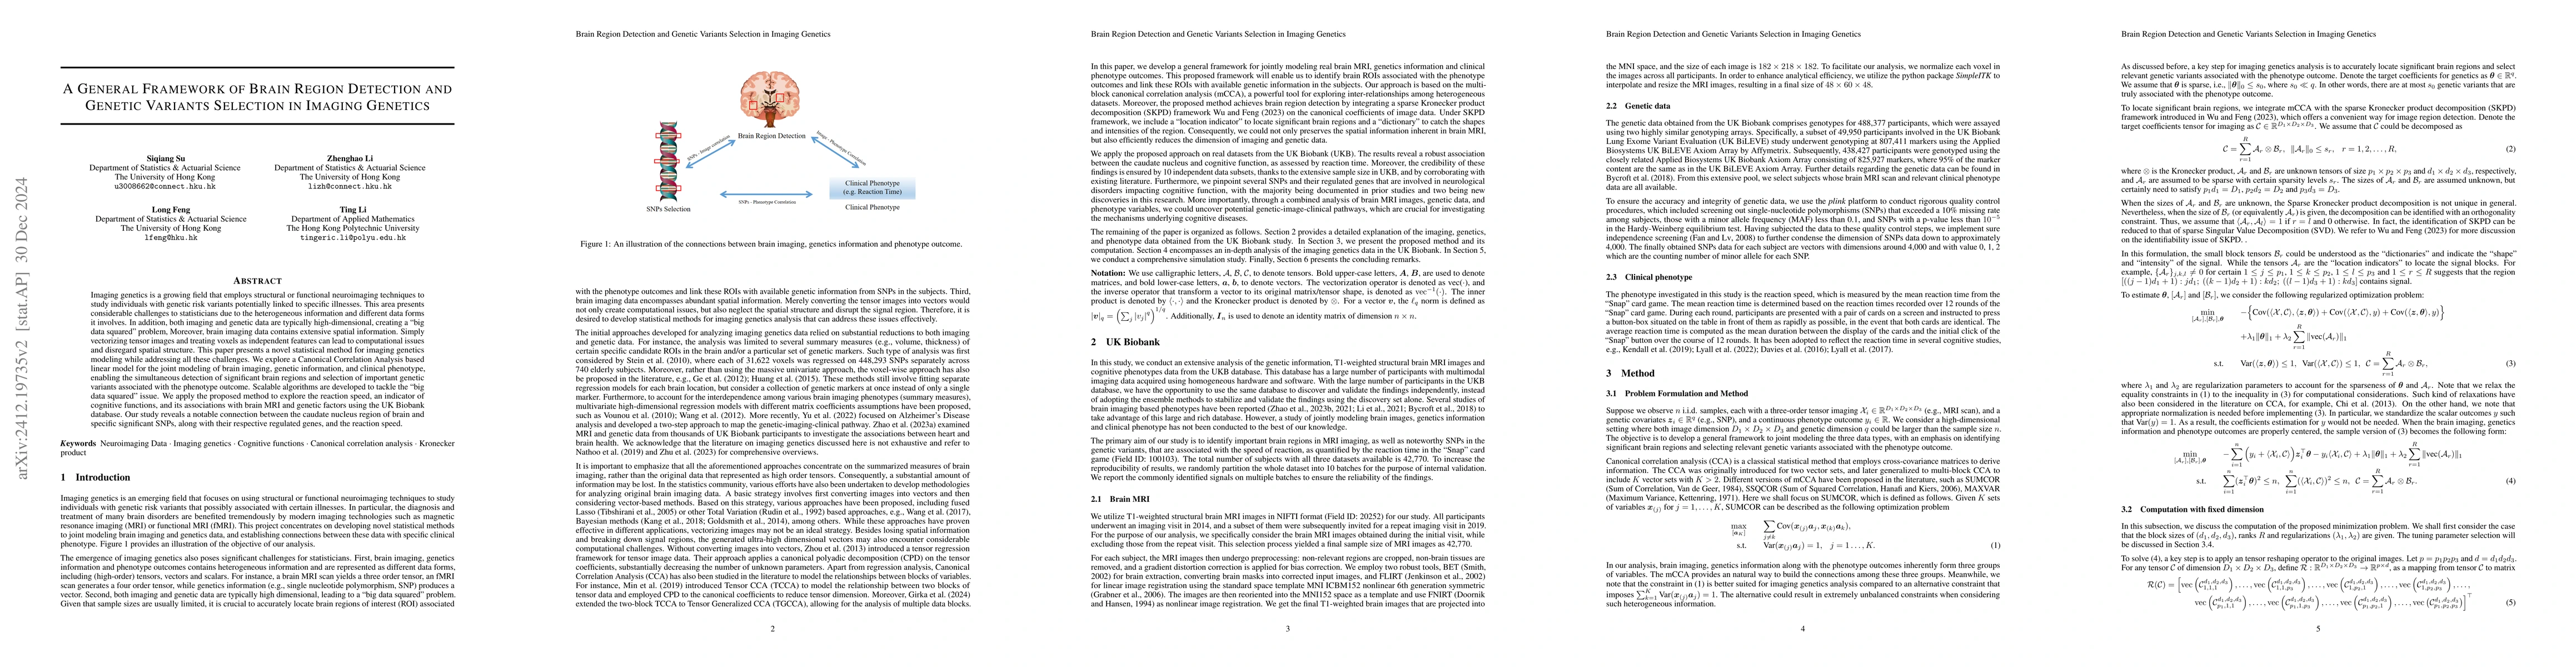
Imaging genetics is a growing field that employs structural or functional neuroimaging techniques to study individuals with genetic risk variants potentially linked to specific illnesses. This area presents considerable challenges to statisticians due to the heterogeneous information and different data forms it involves. In addition, both imaging and genetic data are typically high-dimensional, creating a "big data squared" problem. Moreover, brain imaging data contains extensive spatial information. Simply vectorizing tensor images and treating voxels as independent features can lead to computational issues and disregard spatial structure. This paper presents a novel statistical method for imaging genetics modeling while addressing all these challenges. We explore a Canonical Correlation Analysis based linear model for the joint modeling of brain imaging, genetic information, and clinical phenotype, enabling the simultaneous detection of significant brain regions and selection of important genetic variants associated with the phenotype outcome. Scalable algorithms are developed to tackle the "big data squared" issue. We apply the proposed method to explore the reaction speed, an indicator of cognitive functions, and its associations with brain MRI and genetic factors using the UK Biobank database. Our study reveals a notable connection between the caudate nucleus region of brain and specific significant SNPs, along with their respective regulated genes, and the reaction speed.
AI Key Findings
Get AI-generated insights about this paper's methodology, results, significance, and more — seven facets brought into focus.
Impact
Authors
PDF Preview
Citation Network
Current paper (gray), citations (green), references (blue)
Display is limited for performance on very large graphs.
Discussion 0