Publication
Metrics
AI Quick Summary
This paper introduces a novel geometric method for visualizing variability in functional data by decomposing it into amplitude, phase, and vertical translation components. It constructs boxplot-type displays for each component and evaluates the method through simulations and real-world applications in sea surface temperature, electrocardiogram, and growth curve analyses.
Paper Preview
Abstract
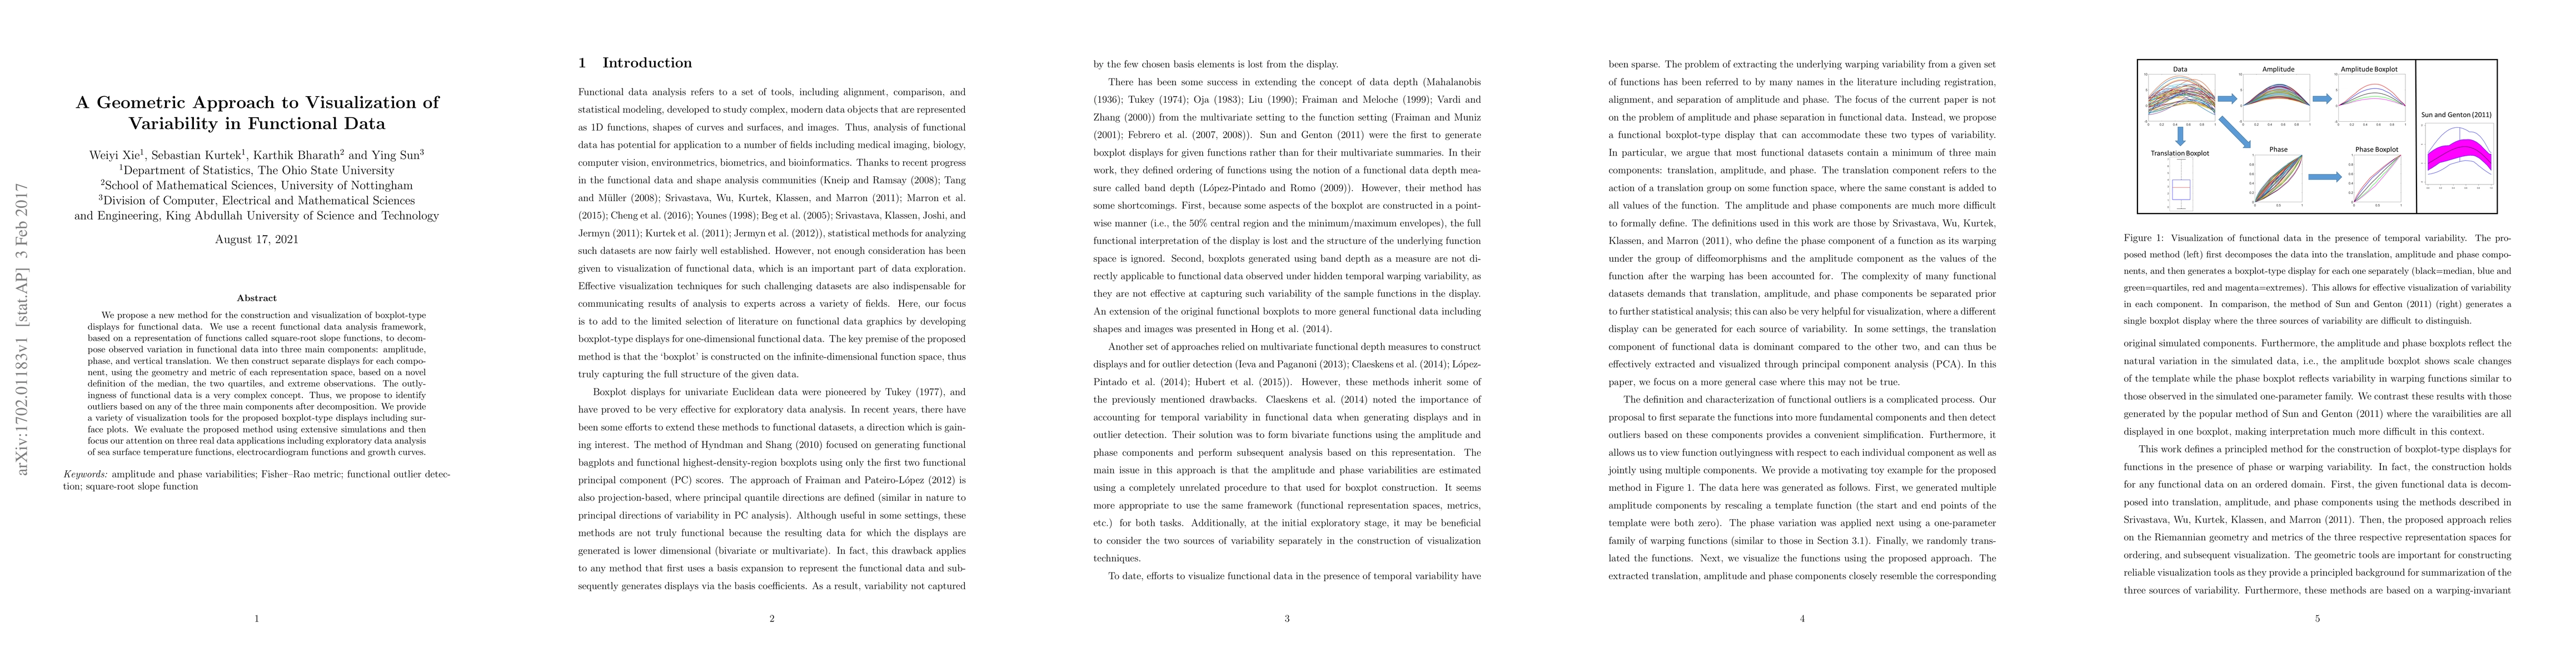
We propose a new method for the construction and visualization of boxplot-type displays for functional data. We use a recent functional data analysis framework, based on a representation of functions called square-root slope functions, to decompose observed variation in functional data into three main components: amplitude, phase, and vertical translation. We then construct separate displays for each component, using the geometry and metric of each representation space, based on a novel definition of the median, the two quartiles, and extreme observations. The outlyingness of functional data is a very complex concept. Thus, we propose to identify outliers based on any of the three main components after decomposition. We provide a variety of visualization tools for the proposed boxplot-type displays including surface plots. We evaluate the proposed method using extensive simulations and then focus our attention on three real data applications including exploratory data analysis of sea surface temperature functions, electrocardiogram functions and growth curves.
AI Key Findings
Get AI-generated insights about this paper's methodology, results, significance, and more — seven facets brought into focus.
Impact
Paper Details
PDF Preview
Key Terms
Citation Network
Current paper (gray), citations (green), references (blue)
Display is limited for performance on very large graphs.
Discussion 0