Summary
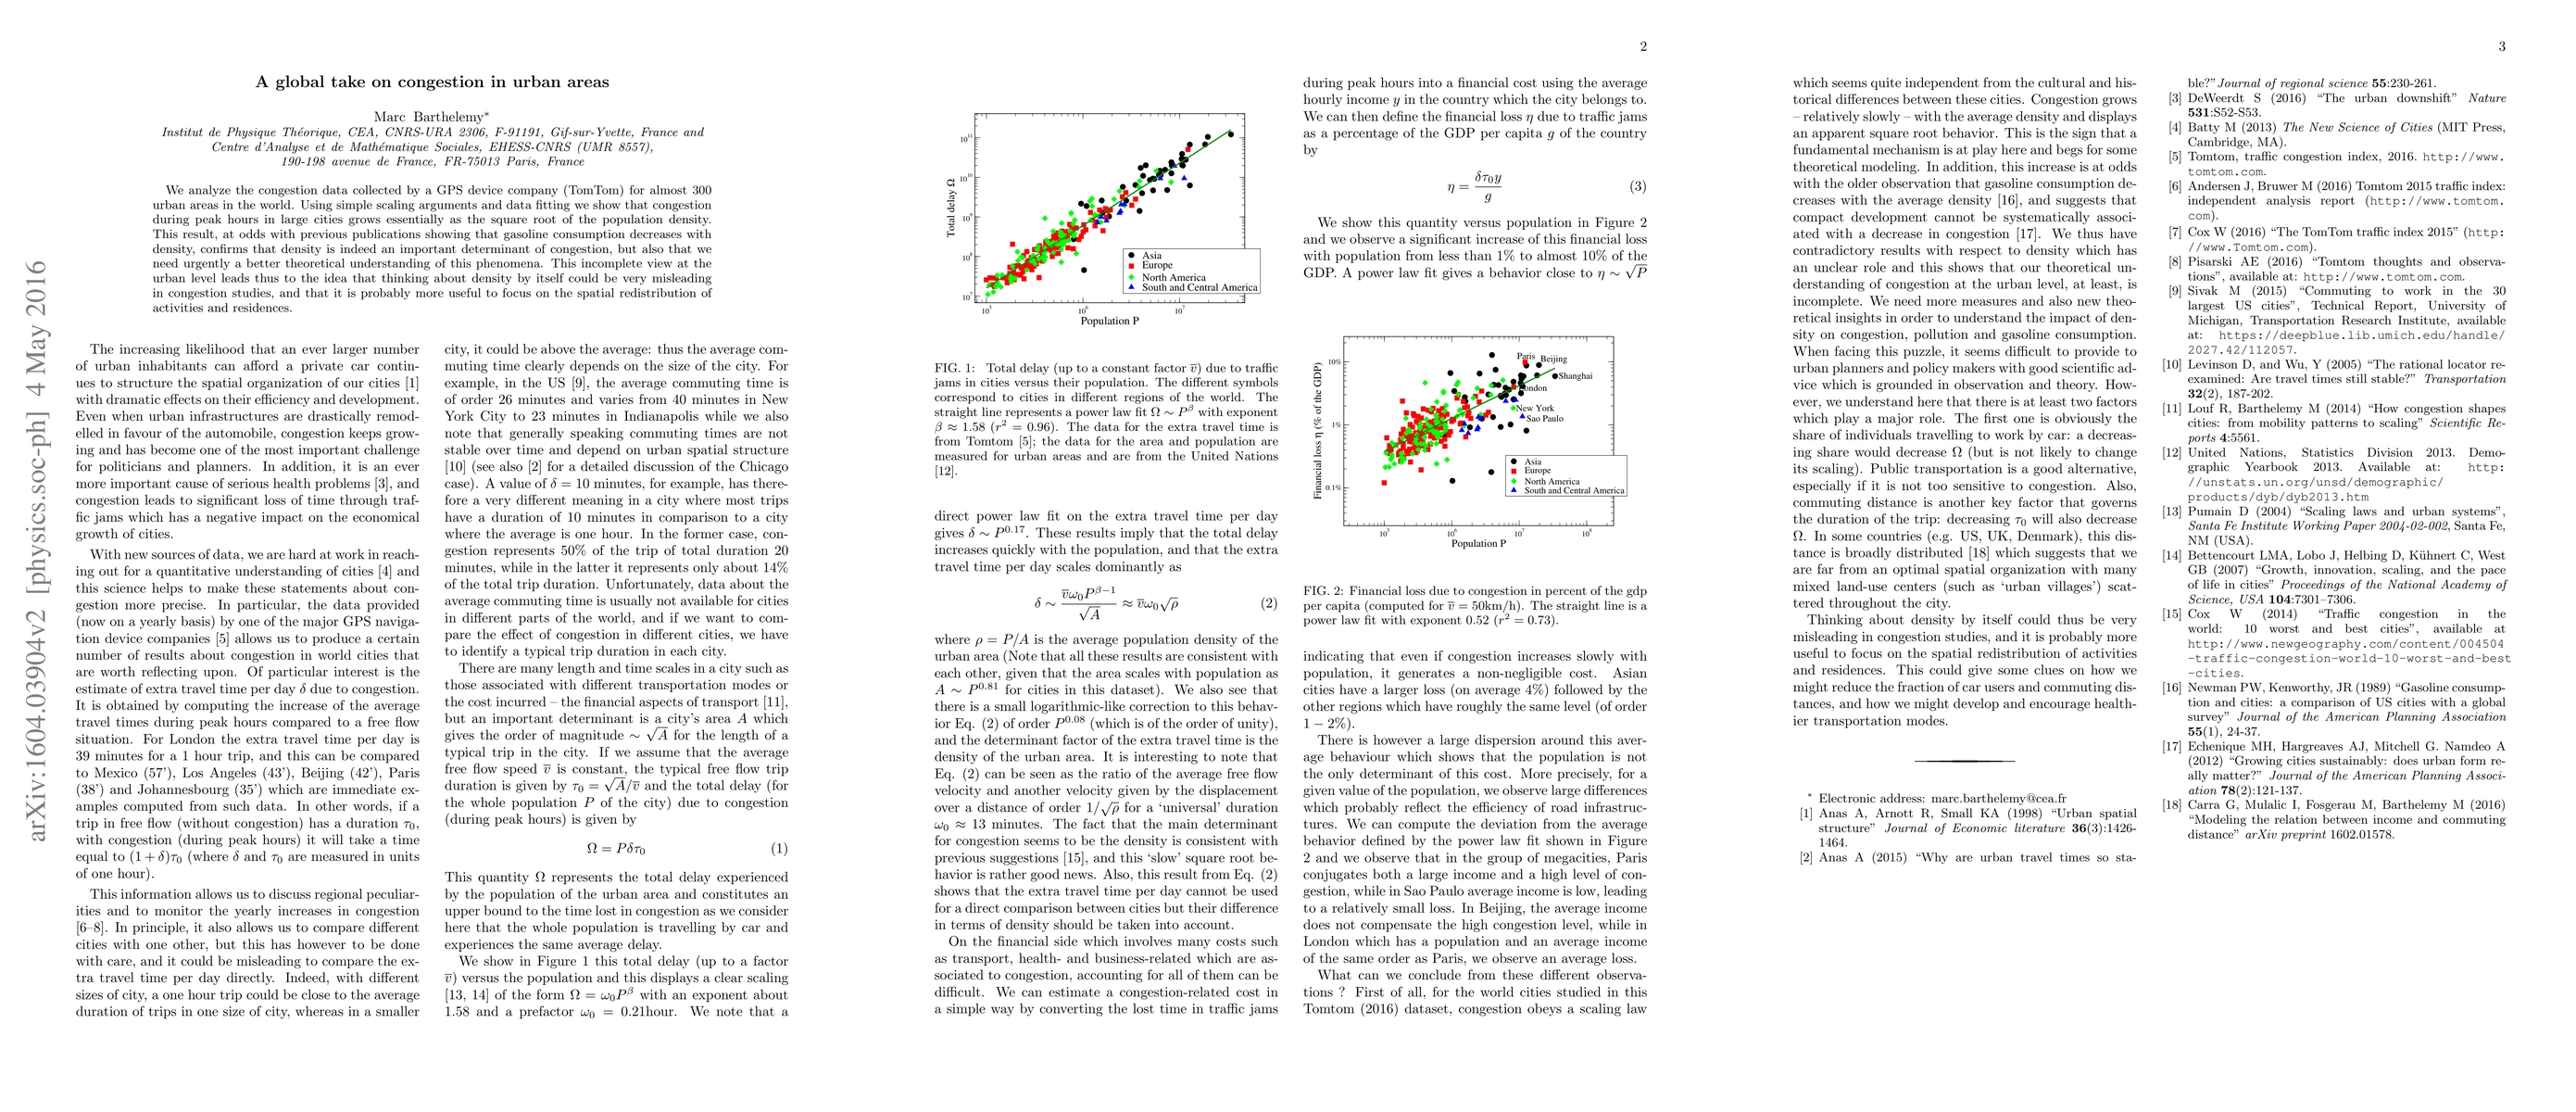
We analyze the congestion data collected by a GPS device company (TomTom) for almost 300 urban areas in the world. Using simple scaling arguments and data fitting we show that congestion during peak hours in large cities grows essentially as the square root of the population density. This result, at odds with previous publications showing that gasoline consumption decreases with density, confirms that density is indeed an important determinant of congestion, but also that we need urgently a better theoretical understanding of this phenomena. This incomplete view at the urban level leads thus to the idea that thinking about density by itself could be very misleading in congestion studies, and that it is probably more useful to focus on the spatial redistribution of activities and residences.
AI Key Findings
Get AI-generated insights about this paper's methodology, results, and significance.
Paper Details
PDF Preview
Key Terms
Citation Network
Current paper (gray), citations (green), references (blue)
Display is limited for performance on very large graphs.
| Title | Authors | Year | Actions |
|---|
Comments (0)