A goodness-of-fit diagnostic for count data derived from half-normal plots with a simulated envelope
Publication
Metrics
AI Quick Summary
This paper introduces a new goodness-of-fit diagnostic for count data based on half-normal plots with a simulated envelope, aiming to provide a quantitative, objective model evaluation method. The method is validated through extensive simulation studies using count data, and demonstrated in ecological and fisheries case studies.
Paper Preview
Abstract
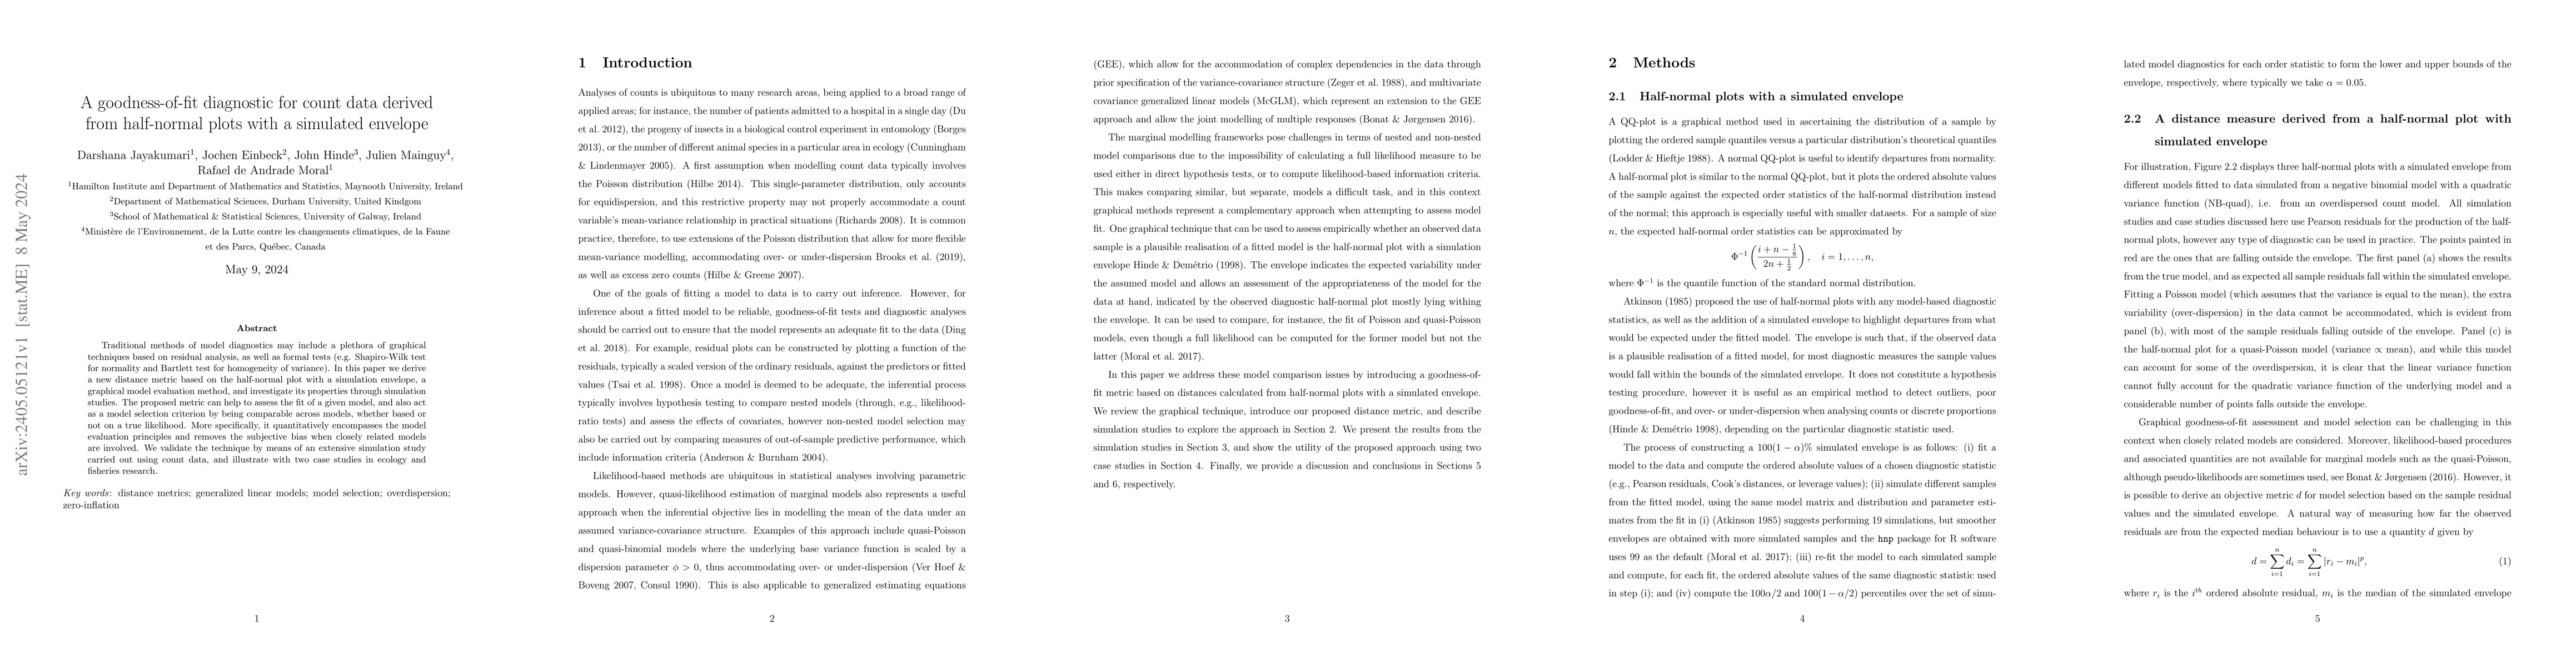
Traditional methods of model diagnostics may include a plethora of graphical techniques based on residual analysis, as well as formal tests (e.g. Shapiro-Wilk test for normality and Bartlett test for homogeneity of variance). In this paper we derive a new distance metric based on the half-normal plot with a simulation envelope, a graphical model evaluation method, and investigate its properties through simulation studies. The proposed metric can help to assess the fit of a given model, and also act as a model selection criterion by being comparable across models, whether based or not on a true likelihood. More specifically, it quantitatively encompasses the model evaluation principles and removes the subjective bias when closely related models are involved. We validate the technique by means of an extensive simulation study carried out using count data, and illustrate with two case studies in ecology and fisheries research.
AI Key Findings
Get AI-generated insights about this paper's methodology, results, significance, and more — seven facets brought into focus.
Impact
Paper Details
Authors
PDF Preview
Key Terms
Citation Network
Current paper (gray), citations (green), references (blue)
Display is limited for performance on very large graphs.
Discussion 0