Publication
Metrics
AI Quick Summary
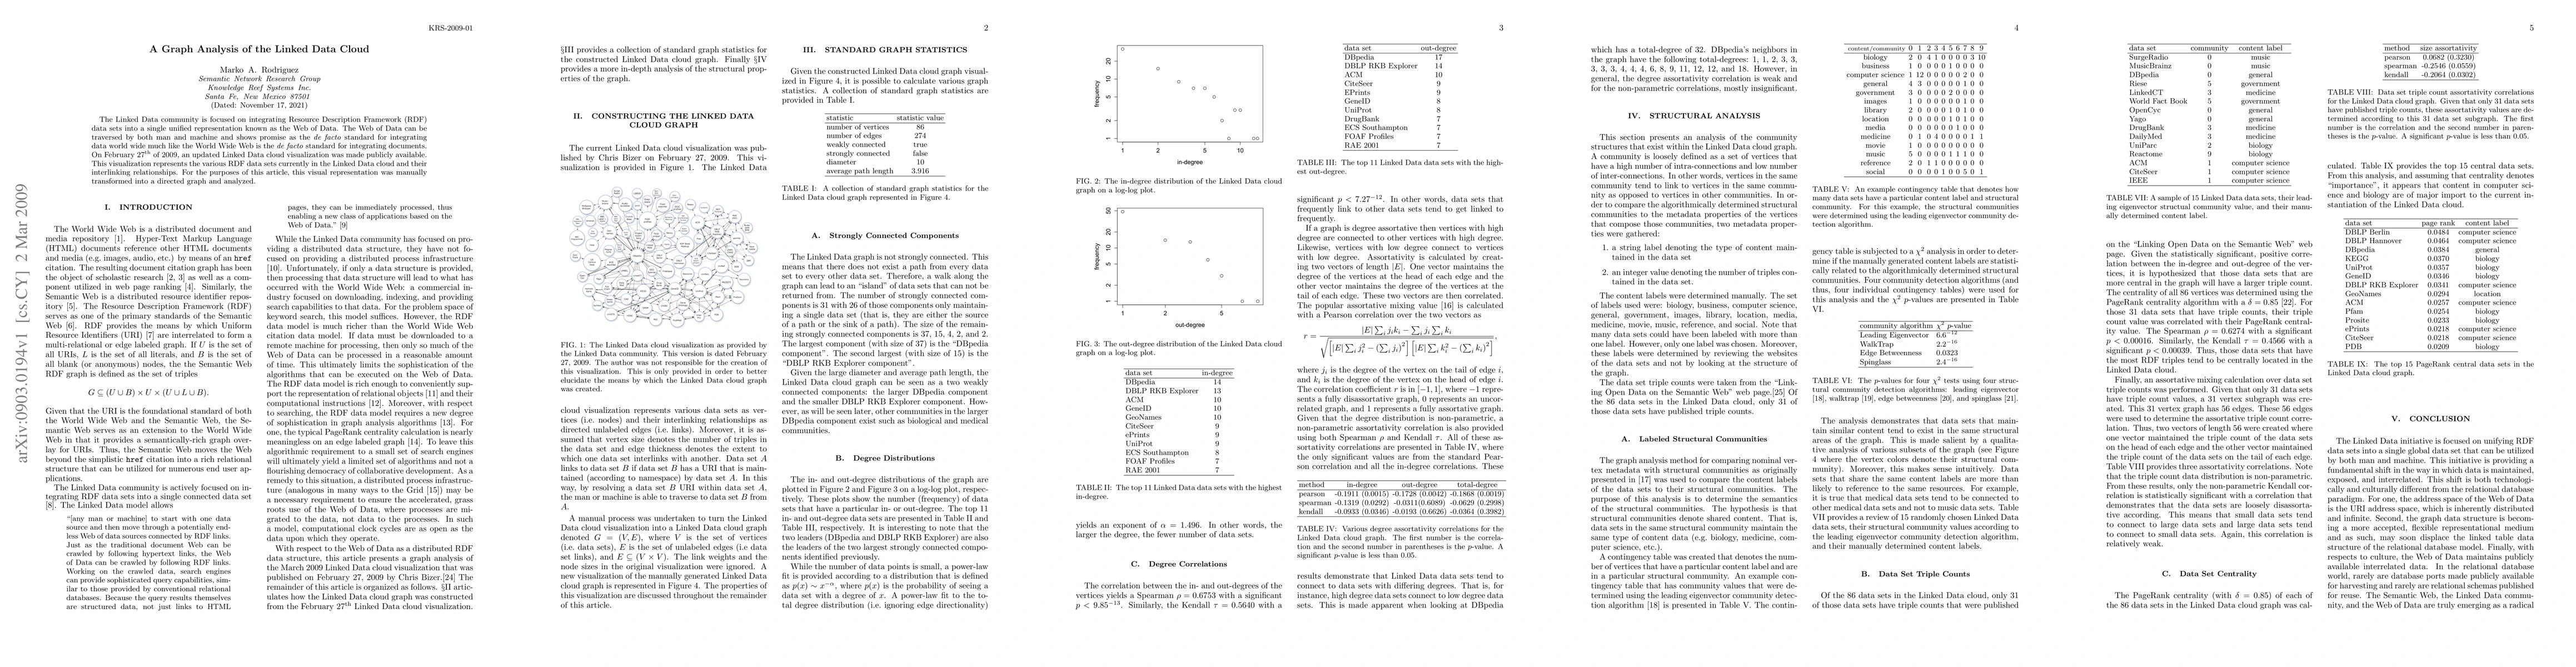
This paper analyzes the Linked Data cloud, a unified representation of RDF datasets, using a directed graph derived from its February 2009 visualization. The study aims to understand the interlinking relationships and structure of the Web of Data.
Paper Preview
Abstract
The Linked Data community is focused on integrating Resource Description Framework (RDF) data sets into a single unified representation known as the Web of Data. The Web of Data can be traversed by both man and machine and shows promise as the \textit{de facto} standard for integrating data world wide much like the World Wide Web is the \textit{de facto} standard for integrating documents. On February 27$^\text{th}$ of 2009, an updated Linked Data cloud visualization was made publicly available. This visualization represents the various RDF data sets currently in the Linked Data cloud and their interlinking relationships. For the purposes of this article, this visual representation was manually transformed into a directed graph and analyzed.
AI Key Findings
Get AI-generated insights about this paper's methodology, results, significance, and more — seven facets brought into focus.
Impact
Paper Details
PDF Preview
Key Terms
Citation Network
Current paper (gray), citations (green), references (blue)
Display is limited for performance on very large graphs.
Discussion 0