Publication
Metrics
AI Quick Summary
A new measure of graph complexity is proposed based on spectral analysis of the Laplace operator, distinguishing between connected and disconnected graphs and highlighting features like connectivity and cluster formation.
Paper Preview
Abstract
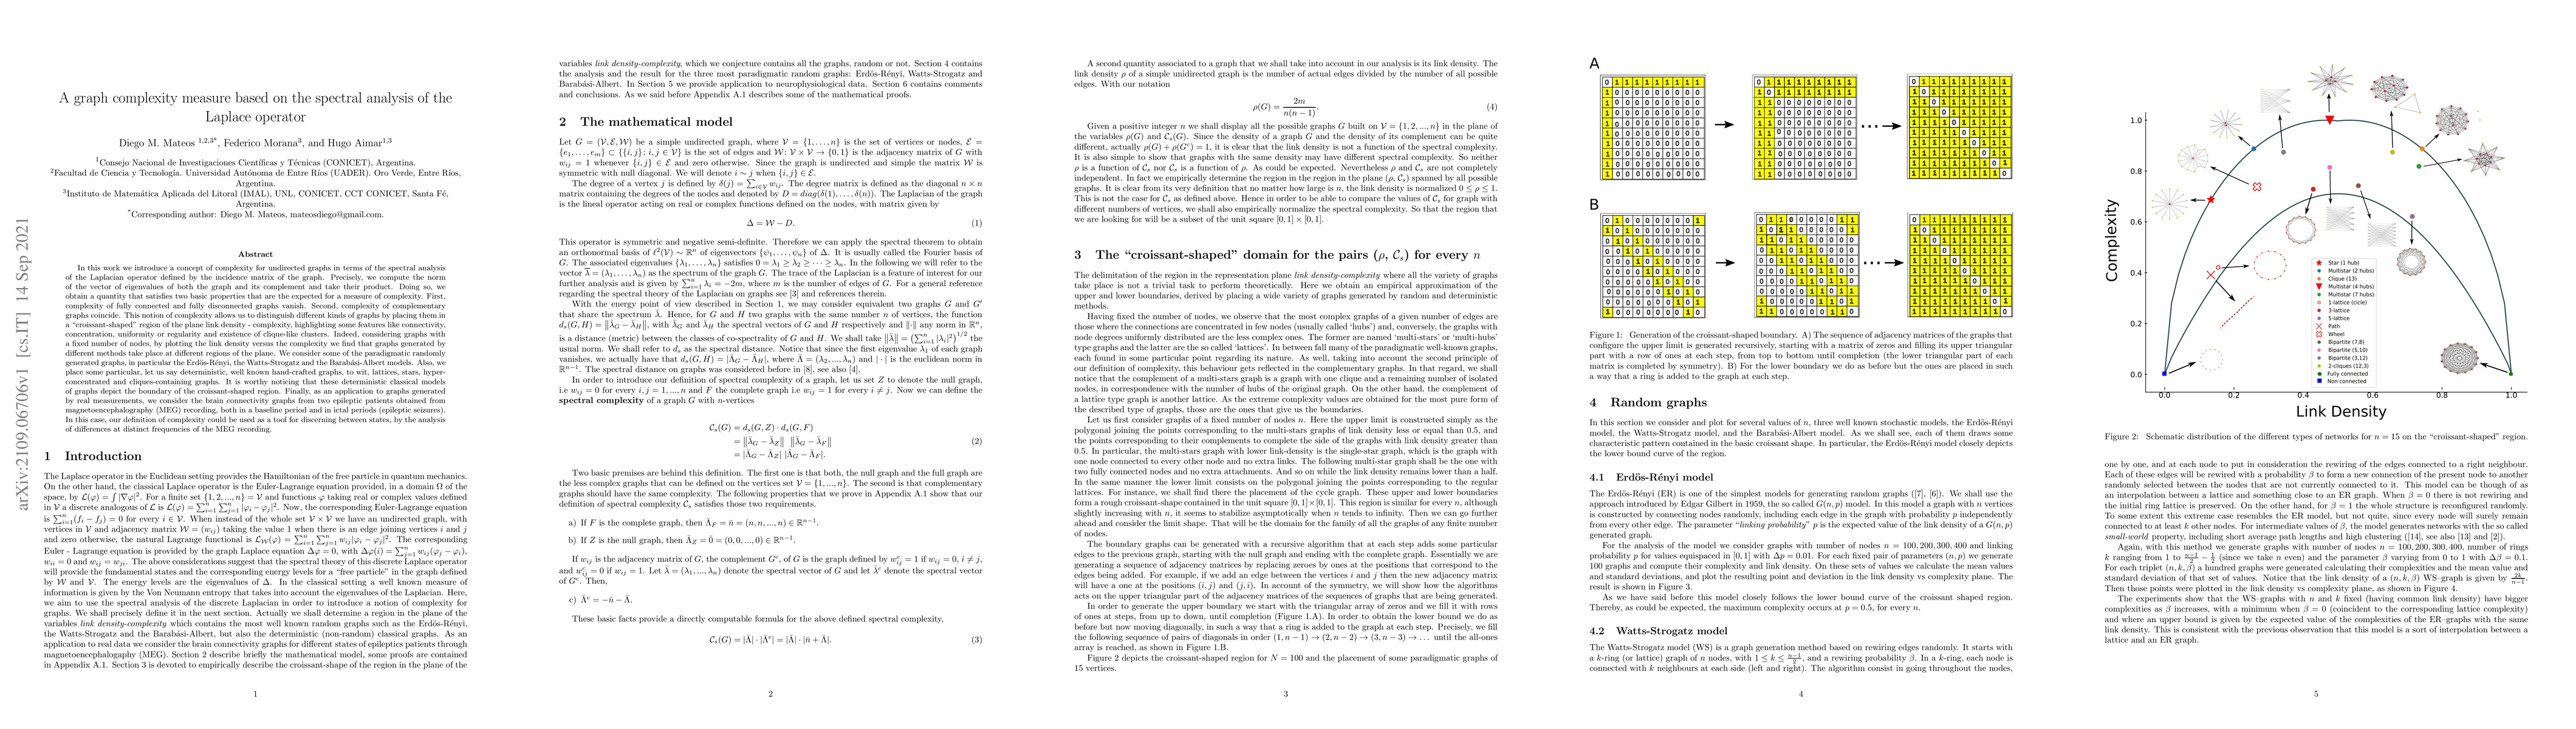
In this work we introduce a concept of complexity for undirected graphs in terms of the spectral analysis of the Laplacian operator defined by the incidence matrix of the graph. Precisely, we compute the norm of the vector of eigenvalues of both the graph and its complement and take their product. Doing so, we obtain a quantity that satisfies two basic properties that are the expected for a measure of complexity. First,complexity of fully connected and fully disconnected graphs vanish. Second, complexity of complementary graphs coincide. This notion of complexity allows us to distinguish different kinds of graphs by placing them in a "croissant-shaped" region of the plane link density - complexity, highlighting some features like connectivity,concentration, uniformity or regularity and existence of clique-like clusters. Indeed, considering graphs with a fixed number of nodes, by plotting the link density versus the complexity we find that graphs generated by different methods take place at different regions of the plane. We consider some generated graphs, in particular the Erd\"os-R\'enyi, the Watts-Strogatz and the Barab\'asi-Albert models. Also, we place some particular, let us say deterministic, to wit, lattices, stars, hyper-concentrated and cliques-containing graphs. It is worthy noticing that these deterministic classical models of graphs depict the boundary of the croissant-shaped region. Finally, as an application to graphs generated by real measurements, we consider the brain connectivity graphs from two epileptic patients obtained from magnetoencephalography (MEG) recording, both in a baseline period and in ictal periods .In this case, our definition of complexity could be used as a tool for discerning between states, by the analysis of differences at distinct frequencies of the MEG recording.
AI Key Findings
Get AI-generated insights about this paper's methodology, results, significance, and more — seven facets brought into focus.
Impact
Paper Details
Authors
PDF Preview
Key Terms
Citation Network
Current paper (gray), citations (green), references (blue)
Display is limited for performance on very large graphs.
Discussion 0